Posts filed under Medical news (341)

May 5, 2014

Weight gain lie factor

From  Malaysian newspaper The Star, via Twitter, an infographic that gets the wrong details right

BmxTXxXCcAA5D3O


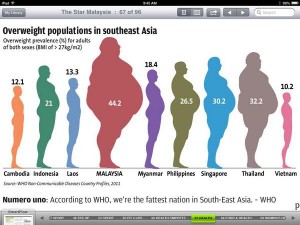
The designer went to substantial effort to make the area of each figure proportional to the number displayed (it says something about modern statistical computing that the my quickest way to check this was read the image file in R, use cluster analysis to find the figures, then tabulate).

However, it’s not remotely true that typical Malaysians weigh nearly four times as much as typical Cambodians. The number is the proportion above a certain BMI threshold, and that changes quite fast as mean weight increases.  Using 1971 US figures for the variability of BMI, you’d get this sort of range of proportion overweight with a 23% range in mean weight between the highest and lowest countries.

May 4, 2014

False, but not misleading

An infographic tweeted by Bill Gates recently on the world’s deadliest animals
00


He’s trying to make the point that malaria is a really big deal, killing more people than human violence, which is true, and which is the impression from the infographic, so it’s not misleading in that sense.

However, mosquitos don’t rend people limb from limb. The mosquito deaths are due to mosquitos infecting people with malaria parasites. The human deaths, however, are just directly due to violence. If  he’d included deaths due to human-human transmission of infection (influenza, tuberculosis, HIV, …), humans would easily be at the top of the list again.

May 2, 2014

Mammography ping-pong

Hilda Bastian at Scientific American

It’s like a lot of evidence ping-pong matches. There are teams with strongly held opinions at the table, smashing away at opposing arguments based on different interpretations of the same data.

Meanwhile, women are being advised to go to their doctors if they have questions. And their doctors may be just as swayed by extremist views and no more on top of the science than anyone else.

She explains where the different views  and numbers come from, and why the headlines keep changing.

How to fix academic press releases

In the ‘Rapid Responses’ (aka ‘rabid responses’) section of BMJ, Ben Goldacre has two suggestions:

Firstly, all press releases in all academic journals should be made publicly available online, alongside the academic journal article they relate to, so that everyone can see whether the press release contained misrepresentations or exaggerations. Secondly, all academic journal press releases should give named authors, who take full responsibility for the contents, including at least one significant author from the academic paper itself.

This isn’t a complete fix, because the culpable press releases are as likely to come from universities as journals, but it would be straightforward to implement, moderately effectively, and I can’t think of any good reason not to do it.

April 24, 2014

Drinking age change

There’s a story in the Herald about the impact of changes in the drinking age. It’s a refreshing change since it’s a sensible analysis of reasonable data to address an interesting question; but I still want to disagree with some of the interpretation.

As those of you who have lived in NZ for longer will remember, the drinking age was lowered from 20 to 18 on December 1, 1999. One of the public-health questions this raises is the effect on driving.  You’d expect an increase in crashes in 18-20 year olds, but it’s not obvious what would happen in older drivers. You could imagine a range of possibilities:

  • People are more at risk when they’re learning to manage drinking in the context of needing to drive, but there’s no real difference between doing this at 18 or at 20
  • At eighteen, a significant minority of people still have the street smarts of a lemming and so the problem will be worse than at twenty
  • At eighteen, fewer people are driving, so the problem will be less bad
  • At eighteen, fewer people are driving so there’s more pressure on those with cars to drive, so the problem will be worse
  • At eighteen, drivers are less experienced and are relying more on their reflexes, so the problem will be worse.

Data would be helpful, and the research (PDF,$; update: now embedded in the story) is about the relative frequency of serious crashes involving alcohol at various ages for 1994-1999, 2000-2004, 2006-2010, ie, before the change, immediately after the change, and when things had settled down a bit. The analysis uses the ratio of crashes involving alcohol to other crashes, to try to adjust for other changes over the period.  That’s sensible but not perfect: changing the drinking age could end up changing the average number of passengers per car and affecting the risk that way, for example.

The research found that 18-20 year olds were at 11% lower risk than 20-24 year olds when 20 was the drinking age, and 21% higher risk when 18 was the drinking age (with large margins of uncertainty). That seems to fit the first explanation: there’s a training period when you’re less safe, but it doesn’t make a lot of difference when it happens — the 20% increase for two years matches the 11% increase for four years quite closely. We certainly can’t rule out the problem being worse at 18 than at 20, but there doesn’t seem to be a strong signal that way.

The other thing to note is that the research also looked at fatal crashes separately and there was no real sign of the same pattern being present. That could easily just be because of the sparser data, but it seems worth pointing out given that all three of the young people named in the story were in fatal crashes.
April 21, 2014

Reefer madness brain scan panic roundup

On the recent paper claiming brain changes from low-level cannabis use, you’ve already seen the StatsChat post (I hope)

There’s also


April 14, 2014

What do we learn from the Global Drug Use Survey?

drug


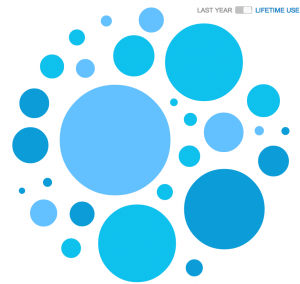
That’s the online summary at Stuff.  When you point at one of the bubbles it jumps out at you and tells you what drug it is. The bubbles make it relatively hard to compare non-adjacent numbers, especially as you can only see the name of one at a time. It’s not even that easy to compare adjacent bubbles, eg, the two at the lower right, which differ by more than two percentage points.

More importantly, this is the least useful data from the survey.  Because it’s a voluntary, self-selected online sample, we’d expect the crude proportions to be biased, probably with more drug use in the sample than the population. To the extent that we can tell, this seems to have happened: the proportion of past-year smokers is 33.5% compared to the Census estimate of 15% active smokers.  It’s logically possible for both of these to be correct, but I don’t really believe it.  The reports of cannabis use are much higher than the (admittedly out of date) NZ Alcohol and Drug Use Survey.  For this sort of data, the forthcoming drug-use section of the NZ Health Survey is likely to be more representative.

Where the Global Drug Use Survey will be valuable is in detail about things like side-effects, attempts to quit, strategies people use for harm reduction. That sort of information isn’t captured by the NZ Health Survey, and presumably it is still being processed and analysed.  Some of the relative information might be useful, too: for example, synthetic cannabis is much less popular than the real thing, with past-year use nearly five times lower.

April 8, 2014

Asthma inhalers and diet: shorter, with more swearing

Ok, so the previous post is about Herald (Daily Mail) story on asthma research. As science reporting goes it’s no worse than usual for these Mail reprints. The reason for this second post is that I read the story again and thought about health reporting.

The story lead says

Eating fast food and consuming sugary drinks renders the most common asthma inhaler ineffective, a study warns.

 That is, the Herald is telling people their emergency asthma inhaler will not work if they eat certain foods. There’s no suggestion of what to do instead in an attack or who to call for help. Even if the claim were true, that would be irresponsible. When it’s just linkbait, it’s fscking appalling.

Overinterpreting diet and asthma

The Herald’s lead

Eating fast food and consuming sugary drinks renders the most common asthma inhaler ineffective, a study warns.

This is two studies. One looked at a ‘dietary inflammation index’ and whether people with higher values were more likely to be asthmatic. It did not look at inhaler effectiveness at all.  The dietary inflammation index does not measure ‘sugary drinks’; it treats all carbohydrate the same. It doesn’t directly measure fast food, though it does distinguish different types of fat.  Since the dietary inflammation index, according to the paper that proposed it, is relatively weakly associated with biological measures of inflammation,  the strong association seen in this study between the index and asthma may just mean that other factors are affecting both asthma and diet.

The other study looked at how salbutamol, the active ingredient of the Ventolin inhaler, was absorbed in samples of lung tissue in the lab. The amount of polyunsaturated fat affected absorption — but that wasn’t dietary fat and there weren’t any inhalers, or any sugary drinks.  Further research might show this translates into real differences in inhaler effectiveness, or it might not.

So, while there is actual science described in the article, there is almost no support for the lead. No inhalers, no sugary drinks, no fast food.

You might also wonder why the Herald is getting a comment from Asthma UK for research presented at a conference of the Thoracic Society of Australia and New Zealand. Or not.

March 29, 2014

WiFi context

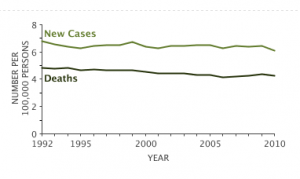
Age-adjusted brain cancer diagnoses and deaths in the US over time (SEER)

brain


The IEEE 802.11a standard was published in 1999 and was first called WiFi in 2000.  WiFi exposure has increased dramatically since then. You can see what the trend in brain cancer has been.

The International Agency for Cancer Research (IARC) lists WiFi as a ‘possible’ human carcinogen. That doesn’t mean they think it’s actually causing cancer. That means there’s enough uncertainty that they can’t rule out the possibility that it would cause cancer at some dose.

A cancer ‘hazard’ is an agent that is capable of causing cancer under some circumstances, while a cancer ‘risk’ is an estimate of the carcinogenic effects expected from exposure to a cancer hazard. The Monographs are an exercise in evaluating cancer hazards, despite the historical presence of the word ‘risks’ in the title. The distinction between hazard and risk is important, and the Monographs identify cancer hazards even when risks are very low at current exposure levels, because new uses or unforeseen exposures could engender risks that are significantly higher.

It’s quite hard to rule this sort of thing out, which is why out of the 970 agents IARC has classified, only one has been labelled “probably not carcinogenic to humans”. That one wasn’t radiofrequency electromagnetic fields, but if you read the summary of the monograph (PDF) you find it’s cellphones held to the ear that are the possible risk they were concerned about.

This information may be helpful context if you read the Dominion Post.