Posts filed under Just look it up (284)

August 4, 2016

Garbage numbers

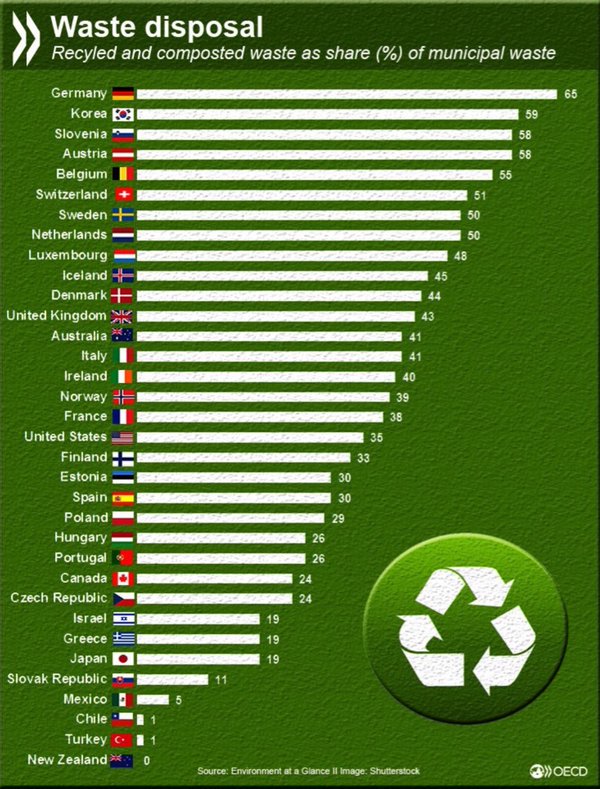
This appeared on Twitter

CcO-e4rWwAERzX5

Now, I could just about believe NZ was near the bottom of the OECD, but to accept zero recycling and composting is a big ask.  Even if some of the recycling ends up in landfill, surely not all of it does.  And the garden waste people don’t charge enough to be putting all my wisteria clippings into landfill.

So, I looked up the source (updated link). It says to see the Annex Notes. Here’s the note for New Zealand

New Zealand: Data refer to amount going to landfill

The data point for New Zealand is zero by definition — they aren’t counting any of the recycling and composting.

When the most you can hope for is that the lies in the graph will be explained in the footnotes, you need to read the footnotes.


May 26, 2016

Budget visualisations

This will likely be updated as I find them

  1. From Keith Ng. Budget now and over time. This gets special mention for being inflation-adjusted (it’s in 2014 dollars). Doesn’t work on my phone, but works well on a small laptop screen
  2. NZ Herald. Works (though hard to read) on a mobile. Still hard to read on a small laptop screen, but attractive on a large screen. I still have reservations about the bubbles.
  3. Stuff has a set of charts. The surplus/deficit one is nicely clear, though there’s nothing about the financial crisis/recession as an explanation for a lot of it.
  4. The government has interactive charts of Core Crown Revenue, Core Crown Expenditure, and breakdown for a taxpayer. On the last one, they lose points for displaying just income tax, when the Treasury are about the only people who could easily do better.
May 7, 2016

Open data: baby names

The Herald has a headline “Emma and Noah continue to be tops for baby names”, with this link from the web front page

baby

In fact, Noah was number 11 as a baby boy’s name, and Emma didn’t make the top hundred names for baby girls in New Zealand.  The top names in NZ, as in this Stuff story from the first week of January, were Oliver and Olivia. That story also had tables and graphs from the Dept of Internal Affairs data.

The new Herald story is about the USA, where they take longer to accumulate and release the baby-name data, but where they have the indefatigable Laura Wattenberg to make sure it gets publicised.

In fact, it’s kind of surprising how much difference there is between the US and NZ lists. Enough to make it worth pointing out in the story.  UK data won’t be out for another few months. Based on last year, it’s a bit more similar to NZ. Maybe we’ll get another story then.


April 29, 2016

Looking up the index


Q: Did you hear that Auckland housing affordability is better now than when the government came to office?

A: No. Surely not.

Q: That’s what Nick Smith says: listen, it’s at 4:38. Is it true?

A: Up to a point.

Q: Up to what point?

A:  As he says, the Massey University Housing Affordability Index for February 2016 is lower than it was for November 2008, for Auckland and everywhere else in the country. For Auckland it was 38.44 then and is 33.8 now.

Q: But The Spinoff says one of the people behind the Index says Nick Smith is wrong, that housing isn’t more affordable than it was then.

A: Indeed she does. That’s because housing isn’t more affordable.

Q: But you said the index was lower?

A: Yes, it is.

Q: And lower is supposed to be better?

A: Yes.

Q: But how can the Housing Affordability Index be lower when housing isn’t more affordable? What is the index?

A: If it’s the same as it was is 2006 (which would make sense) it’s median selling price multiplied by a weighted-average interest rate and divided by the mean individual weekly earnings.

Q: Can you translate that?

A: Roughly,  the number of weeks of average earnings you’d need to pay the first year’s interest on a 100% mortgage.

Q: So if it’s 34, and you’ve got two people making the average, it’s 17 weeks each out of 52 going to mortgage interest? About 32% of income?

A: That’s right, only you don’t get 100% mortgages, so it’s more like 26% of income. And there’s taxes and insurance and you actually pay off a bit of the principal even in the first year, so it’s more complicated. But it’s a simple summary of the interest cost.

Q: And that’s lower now than in November 2008?

A: So it seems. I wasn’t living in New Zealand then, but it looks like mortgage interest rates were near 9%. The combination of the increase in incomes and the fall in interest rates has been slightly more than the increase in house prices, even in Auckland.

Q: But what if rates go back up?

A: Then a lot of houses will retroactively become much less affordable.

Q: And what about saving for down payments? That’s what all the snake people have been complaining about, and low interest rates don’t help there.

A: Down payments don’t go into the affordability index

Q: But they go into actual affordability!

A: Which is presumably why the Minister was talking about the affordability index.
 

April 28, 2016

Māori imprisonment statistics: not just age

Jarrod Gilbert had a piece in the Herald about prisons

Fifty per cent of the prison population is Maori. It’s a fact regularly cited in official documents, and from time to time it garners attention in the media. Given they make up 15 per cent of the population, it’s immediately clear that Maori incarceration is highly disproportionate, but it’s not until the numbers are given a greater examination that a more accurate perspective emerges.

The numbers seem dystopian, yet they very much reflect the realities of many Maori families and neighbourhoods.

to know what he was talking about, qualitatively. I mean, this isn’t David Brooks.

It turns out that while you can’t easily get data on ethnicity by age in the prison population, you can get data on age, and that this is enough to get a good idea of what’s going on, using what epidemiologists call “indirect standardisation”.

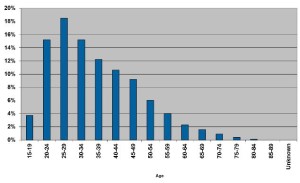
Actually, you can’t even easily get data on age, but you can get a graph of age:
ps_ages_3_16

and I resorted to software that reconstructs the numbers.

Next, I downloaded Māori population estimates by age and total population estimates by age from StatsNZ, for ages 15-84.  The definition of Māori won’t be exactly the same as in Dr Gilbert’s data. Also, the age groups aren’t quite right because we’d really like the age when the offence happened, not the current age.  The data still should be good enough to see how big the age bias is. In these age groups, 13.2% of the population is Māori by the StatsNZ population estimate definition.

We know what proportion of the prison population is in each age group, and we know what the population proportion of Māori is in each age group, so we can combine these to get the expected proportion of Māori in the prison population accounting for age differences. It’s 14.5%.  Now, 14.5% is higher than 13.2%, so the age-adjustment does make a difference, and in the expected direction, just not a very big difference.

We can also see what happens if we use the Māori population proportion from the next-younger five-year group, to allow for offences being committed further in the past. The expected proportion is then 15.3%, which again is higher than 13.2%, but not by very much. Accounting for age, it looks as though Māori are still more than three times as likely to be in prison as non-Māori.

You might then say there are lots of other variables to be looked at. But age is special.  If it turned out that Māori incarceration rates could be explained by poverty, that wouldn’t mean their treatment by society was fair, it would suggest that poverty was how it was unfair. If the rates could be explained by education, that wouldn’t mean their treatment by society was fair; it would suggest education was how it was unfair. But if the rates could be explained by age, that would suggest the system was fair. They can’t be.

April 17, 2016

Overcounting causes

There’s a long story in the Sunday Star-Times about a 2007 report on cannabis from the National Drug Intelligence Bureau (NDIB)

“Perhaps surprisingly,” Maxwell wrote, “cannabis related hospital admissions between 2001 and 2005 exceeded admissions for opiates, amphetamines and cocaine combined”, with about 2000 people a year ending up in hospital because of the drug.

The problem was with hospital diagnostic codes. Discharge summaries include both the primary cause of admission and a lot of other things to be noted. That’s a good thing — you want to know what all was wrong with a patient both for future clinical care and for research and quality control.  For example, if someone is in hospital for bleeding, you want to know they were on warfarin (which is why the bleeding happened), and perhaps why they were on warfarin. It’s not even always the case that the primary cause is the primary cause — if someone has Parkinson’s Disease and is admitted with pneumonia as a complication, which one should be listed? This is a difficult and complex field, and is even slightly less boring than it sounds.

As a result, if you just count up all the discharge summaries where ‘cannabis dependence’ was somewhere on the laundry list of codes, you’re going to get a lot of people who smoke pot but are in hospital for some completely different reason.  And since there’s a lot of cannabis consumption out there, you will get a lot of these false positives.

There are some other things to note about this report, though. The National Drug Foundation says (on Twitter) that they made the same point when it first came out. They also claim


that the Ministry of Health argued against its being published.

Perhaps now the multiple-counting problem has been publicised in the context of hospital admissions the same mistake will be made less often for road crashes, where multiple factors from foreign drivers to speed to alcohol to drugs are repeatedly counted up as ‘the’ cause of any crash where they are present.

April 11, 2016

Missing data

Sometimes…often…practically always… when you get a data set there are missing values. You need to decide what to do with them. There’s a mathematical result that basically says there’s no reliable strategy, but different approaches may still be less completely useless in different settings.

One tempting but usually bad approach is to replace them with the average — it’s especially bad with geographical data.  We’ve seen fivethirtyeight.com get this badly wrong with kidnappings in Nigeria, we’ve seen maps of vaccine-preventable illness at epidemic proportions in the west Australian desert, we’ve seen Kansas misidentified as the porn centre of the United States.

The data problem that attributed porn to Kansas has more serious consequences. There’s a farm not far from Wichita that, according to the major database providing this information, has 600 million IP addresses.  Now think of the reasons why someone might need to look up the physical location of an internet address. Kashmir Hill, at Fusion, looks at the consequences, and at how a better “don’t know” address is being chosen.

March 22, 2016

Counting sheep

From the Guardian (slightly outside our usual beat, but noted by Robin Evans on Twitter)

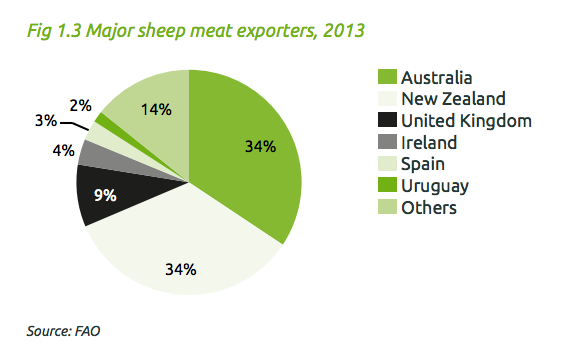
The UK is the world’s third largest lamb exporter – after Australia and New Zealand – with just over a third of the market.

That can’t be true. Even if Australia and New Zealand and the UK were the only exporters, the UK being in third place would mean it had to have less than a third of the market.  The (UK) Agriculture & Horticulture Development Board (PDF) thinks it’s about 9% — yes, that’s not just lamb, but lamb makes up most of the NZ and Oz exports.

sheep

I’m not sure what the ‘just over a third’ really is. It might be the proportion of UK-raised lamb that is exported.

It’s also interesting to see the Guardian slant on the story: that supermarkets should refuse to stock any imported lamb at this time of the year and insist on English lamb raised indoors, out of season.


March 3, 2016

Soft drink doses

From the Herald today

Coca-Cola would prefer to see more people drinking less of its products rather than a few people drinking a lot. So one can a week is quite alright, according to the folks from Coke.

So, how does that compare to current consumption? We don’t know specifically for Coca-Cola, but Stuff gave figures a year ago for fizzy soft drinks

New Zealanders drank just under 73 litres of carbonated drinks each in 2014 – a fraction lower than Australia where the per-capita consumption sat just under 75 litres.

The figure excludes sports drinks, tea and coffee, and other soft drinks, and 73 litres a year breaks down to nearly four cans a week, and that’s averaged over the whole population. Averaged over just those who drink carbonated soft drinks it’s obviously going to be more.

Coca-Cola Amatil would probably be happy if people who don’t currently drink Coke started drinking a can a week, or if people switched to Coke from L&P, Fanta, or Six Barrel Soda Celery Tonic, but if everyone who drinks fizzy soft drinks regularly were to cut down to one can a week, the market would shrink a lot.

February 24, 2016

Home ownership comparisons

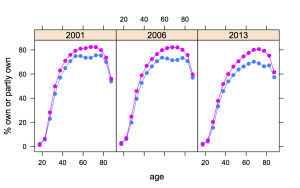
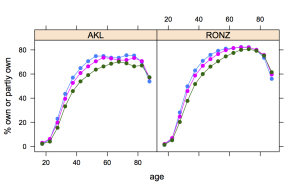
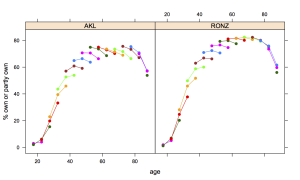
Two graphs to help people on Twitter who are arguing about home ownership trends in Auckland vs rest of NZ or in generational differences.

Both are percentages of home ownership based on the census question “Do you own or partly own your home?”, with data from the last three censuses.

First, comparisons between Auckland and the Rest of NZ by age, over time. Blue is Auckland, pink is RONZ

tenure-1

Second, trends over 12 years, by age, for three census years. Blue is 2001, pink is 2006, green is 2013.

tenure-2

Data from the nzdotstat table “Tenure holder by age group and sex, for the census usually resident population count aged 15 years and over, 2001, 2006 and 2013 Censuses (RC, TA, AU)”


Update: And one more. Here the lines connect roughly the same group of people (birth cohort) over time (only approximately because the planned 2011 census didn’t happen until 2013).

tenure-3