Posts filed under Just look it up (284)

March 31, 2013

Briefly

Easter trading rules don’t appear to forbid blogging today, so a few links

  • Using words like “common”, “uncommon”, “rare”, “very rare” to describe risks of drug side-effects is recommended by guidelines,  and patients like it better than numbers, but it leads to serious overestimation of the actual risks (PDF poster, via Hilda Bastian)
  • A map of gun deaths in the US since the Sandy Hook shootings
  • Stuff’s small-business section says: “Scientists believe the Kiwifruit virus Psa came to New Zealand in a 2009 shipment of flowers.” I hope it’s just the newspaper, not the scientists, that thinks Psa is a virus
  • Another story about petrol prices in the Herald, linked to remind you all that the government collects and publishes data.  You can find it, even if AA, the petrol companies, and the media can’t.  This time AA seems to be right: the importer margin is about 4c above the trend line, which itself is up 5c on last year.
March 27, 2013

Why PDFs are not open data

The US non-profit journalism group Pro Publica has written a number of good stories recently about drug company payments to doctors.  They used the data that some US states force the drug companies to release.  They have a new story explaining why this isn’t as easy as it sounds, since there was no requirement that the data be released in any useful form.  For example, a lot of it was in PDF files.  As they write

Here’s how a PDF works, deep down: It positions text by placing each character at minutely precise coordinates in relation to the bottom-left corner of the page. It does something similar for other elements like images. A PDF knows about shapes, characters and their precise positions on the page. Even if a PDF looks like a spreadsheet — in fact, even when it’s made using Microsoft Excel — the PDF format doesn’t retain any sense of the “cells” that once contained the data.

They used a wide range of techniques: in some cases they could use the grid cells on the tables to work out which digits belonged to the same number, but in other cases they basically had to treat the PDF file as an image and use optical text recognition software on it, just as you would for a scanned bitmap. Most people wouldn’t go to these heroic lengths, and would rapidly decide to investigate other exciting stories.

Even Excel spreadsheets are only useful open data formats if they are structured so that it’s easy for a computer to find and extract the actual numbers from the worksheet. Stats NZ , who realise this, try to have data available both as Excel spreadsheets designed for visual display and in some useful downloadable form. Some other sources of NZ official data are not as helpful.

(via @adzebill on Twitter)

March 25, 2013

Intergenerational inequality

The United States has surprisingly low social mobility: in every country, the children of the rich are more likely to be rich than the children of the poor, but the US is even worse than most Western countries.

Felix Salmon links to some graphs by Evan Soltas, looking at mobility in terms of education, with data from the US General Social Survey. He finds that people whose fathers did not go to university are much less likely to go to university themselves (unsurprising), and that this is true at all levels of income (more interesting).

I’ve repeated what Soltas did, but smoothing[1] the relationships to remove the visual noise, and also restricting to people aged 25-40 (rather than 18+)

ineq


In each panel, black is less than high school, dark red is high school, light brown is university or junior college and yellow is postgraduate. These are plotted by family income (in inflation-adjusted US dollars).  The left panel is for people whose fathers had at least a junior college degree; the right is those whose fathers didn’t.

The difference is striking, and as Soltas says, may imply a greater long-term value for encouraging education than people had thought.


[1] For people who want the technical details:  A sampling-weighted local-linear smoother using a Gaussian kernel with bandwidth $10000, ie, svysmooth() in the R survey package. Bandwidth chosen using the ‘Goldilocks’ method[2]

[2] What? $3000 is too wiggly, $30000 is too smooth, $10000 is just right.

March 24, 2013

Some interactive graphics

These might perhaps be evidence for or against the previous post

March 23, 2013

When you have two numbers

Last month, Statistics New Zealand released the travel and migration statistics for January.  Visits from China and Hong Kong were notably lower than the past year. This was attributed to Chinese New Year being in February. The media duly reported all this.

Now, Statistics New Zealand has released the travel and migration statistics for January.  Visits from China and Hong Kong were notably higher than the past year. This was attributed to Chinese New Year being in February. The media duly reported all this.

It seems obvious that you’d want to combine the two months, so that the Chinese New Year effect drops out. I haven’t seen anyone do this yet:

  • Visitors from China: Jan+Feb 2012: 23300+15300=38600
  • Vistors from China: Jan+Feb 2013 18800+31500=50300

For Hong Kong the January figures aren’t in the press release, but the change is: there were 2200 more than last year in February, and 1500 fewer in January, for an increase of 700.

So, a fairly big increase in visitors from these countries over the past two years.

Net migration was also up a bit, and here I think a longer time series than the media reported would be useful.  The full time series in the Stats NZ release looks like

migration


Arrivals are pretty constant.  Departures are slowly declining, but are still much higher than in the 09/10 minimum.

March 20, 2013

It’s still dry

The NIWA soil moisture maps from March 10 and yesterday show how much difference a single storm doesn’t make:

niwa-now niwa-then


It’s a good thing there are date labels to distinguish them.

March 19, 2013

How could this possibly go wrong?

There’s a new research paper out that sequences the genome of one of the most important cancer cell lines, HeLa.  It shows the fascinating genomic mess that can arise when a cell is freed from the normal constraints against genetic damage, and it gives valuable information about a vital research resource.

However, the discussion on Twitter (or at least the parts I frequent) has been dominated by another fact about the paper.  The researchers apparently didn’t consult at all with the family of Henrietta Lacks, the person whose tumour this originally was.  There are two reasons this is bad.

Firstly, publishing a genome of  an ancestor of yours allows people to learn a lot about your genome. The high levels of mutation in the cancer cell line reduces this information a bit, but there’s still a lot there. As a trivial example, even without worrying about genetic disease risks, you could use the data to tell if someone who thought they were a descendant of Ms Lacks actually was or wasn’t. Publishing a genome without consent from, or consultation with, anyone is at best rude.

And secondly: come on, guys, didn’t you read the book? From the author’s summary

In 1950, Henrietta Lacks, a young mother of five children, entered the colored ward of The Johns Hopkins Hospital to begin treatment for an extremely aggressive strain of cervical cancer. As she lay on the operating table, a sample of her cancerous cervical tissue was taken without her knowledge or consent and given to Dr. George Gey, the head of tissue research. Gey was conducting experiments in an attempt to create an immortal line of human cells that could be used in medical research. Those cells, he hoped, would allow scientists to unlock the mysteries of cancer, and eventually lead to a cure for the disease. Until this point, all of Gey’s attempts to grow a human cell line had ended in failure, but Henrietta’s cells were different: they never died.

Less than a year after her initial diagnosis, Henrietta succumbed to the ravages of cancer and was buried in an unmarked grave on her family’s land. She was just thirty-one years old. Her family had no idea that part of her was still alive, growing vigorously in laboratories—first at Johns Hopkins, and eventually all over the world.

That’s how they did things back then.  It’s not how we do things now. If there was a symbolically worse genome to sequence without some sort of consultation, I’d have a hard time thinking of it.

I don’t think anyone’s saying laws or regulations were violated, and I’m not saying that the family should have had veto power, but they should at least have been talked to.

March 3, 2013

The data speak for themselves

Today, from the Herald “More people on benefits as Govt fiddles with job requirements”

Labour spokeswoman for social development Jacinda Ardern said the highest unemployment numbers were at around 10 per cent in the early 1990s but support for solo parents and invalids have hit record highs during Bennett’s reign as Social Development Minister.

Between January 2009 and January 2012, the number of people on the DPB rose by 13.2 per cent. During the same period, the number of people on the unemployment benefit rose by 82 per cent.

Late January, in the Fairfax papers, “Beneficiary numbers in overall down trend”

Staff at Work and Income work hard to identify job opportunities with local employers and connect them with people who’re ready to work,” Mrs Bennett said.

On average Winz put 1000 people into new jobs each week around the country.

In the year to October 2012, 82,000 New Zealanders went off benefits and into work.

Ministry of Social Development website figures show the number of people on the unemployment benefit last month was the lowest December figure since 2008.

Since the actual numbers are a matter of public record, presumably both Adern and Bennett are telling the literal truth, but both of them are being misleading. To start with, you’d have to be suspicious about a trend that’s being quoted up to Jan 2012, which was more than a year ago.

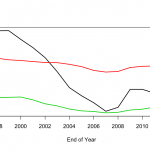
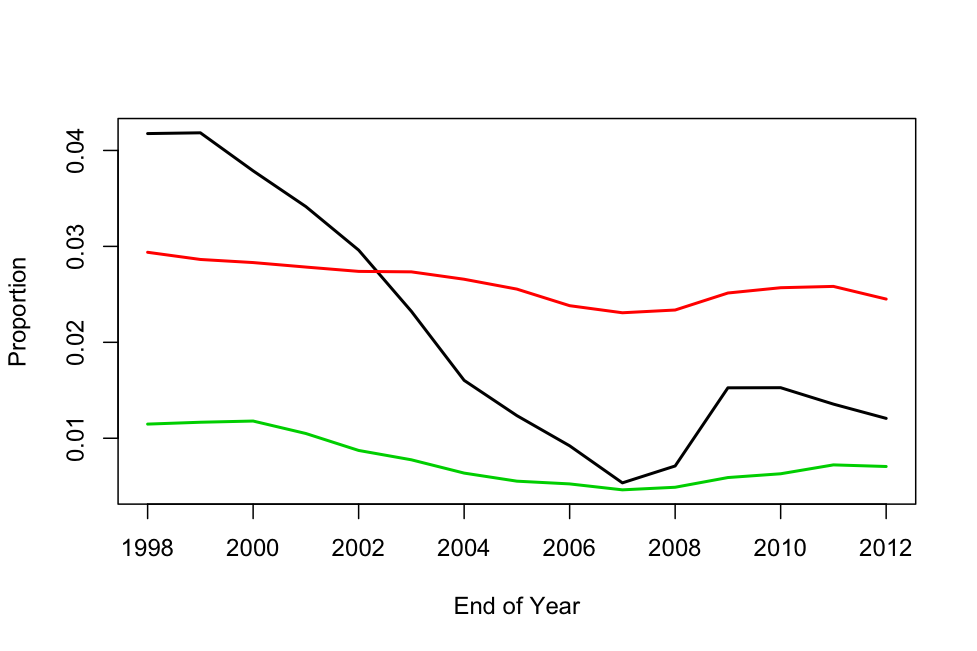
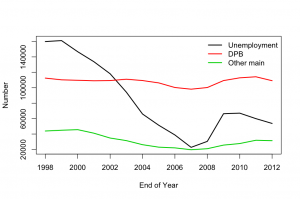
If you at the actual numbers, from the Ministry of Social Development (and work around the fact that they are in a Word document, not some sensible data format), it becomes clear that there are two patterns.  For unemployment, Dependent Persons Domestic Purposes, and “Other main” benefits, the main variation is with the state of the economy (strongly, for unemployment, more weakly for the other two).  It’s not really possible to tell if the recent changes have had any effect, but it is clear that anyone quoting a difference between two points as if it was evidence is not to be trusted.

benefits1


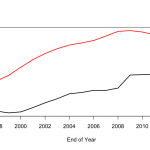
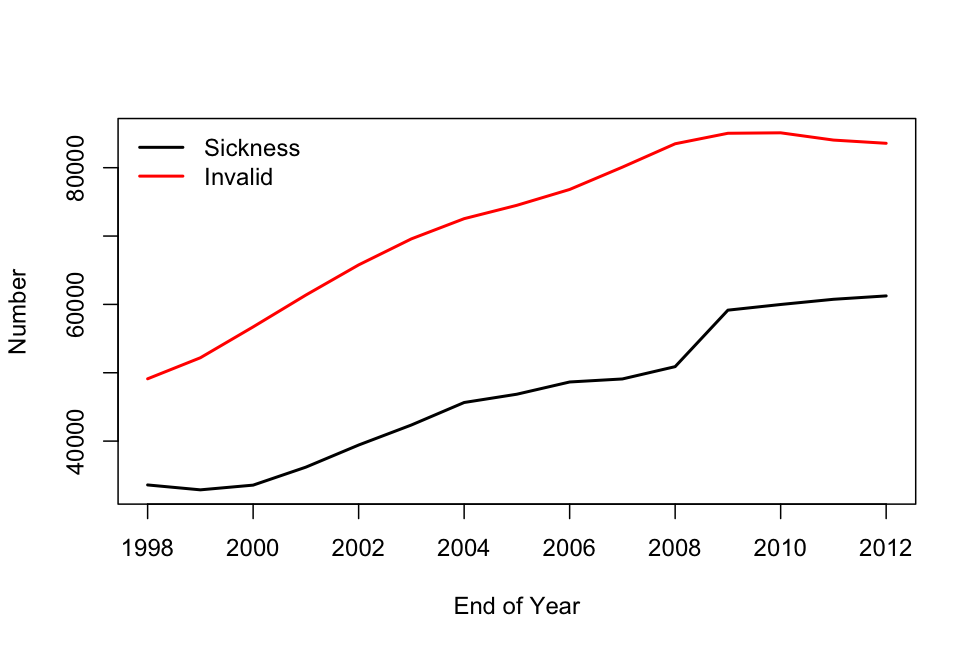
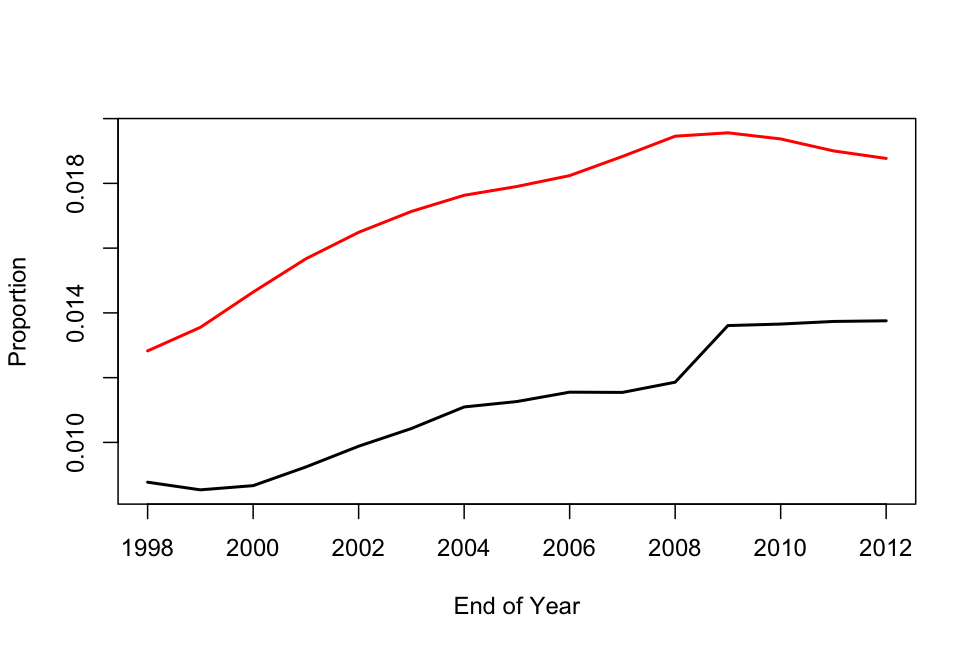
Sickness benefit and Invalid’s benefit have been rising, for as long as I can find the numbers, though the rise has flattened off in recent years.  This could possibly be evidence for the effectiveness of Bennett’s changes; it really can’t be evidence against them.

benefits2


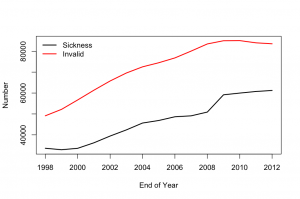
Ideally these should have been standardised by population, which increased about 25% over this period, but it doesn’t make much difference, as you can see.  Age adjustment would also be useful, but is a lot more work.

benefits3  benefits4

February 19, 2013

User fees and road costs

Last month, there was an interesting report from a US group called The Tax Foundation  on the fraction of US state and local road costs contributed by registration fees, tolls, petrol taxes, and other charges for road users.  It turned out to average about 1/3 — that’s just actual monetary costs, not the costs that drivers impose on others through congestion or carbon emissions.

In New Zealand, the fraction for local roads seems to be higher — if you look at the Funding Assistance Rates that say how much the NZ Transport Agency pays toward council road maintenance, operation, and renewal, it varies around roughly 50% (for Wellington, it happens to be 44%). According to NZTA, the rest of the money comes through mechanisms that don’t specifically target drivers, such as council rates.

So, why did I single out the 44% for Wellington? Well, that’s where anyone not at the wheel of a car is apparently a `guest’ on the roads. Or, with unsettling plausibility, `roadkill’.

February 14, 2013

Petty drug users fill NZ homes?

Michelle Gosse points us to a discussion of minor drug crime on Stuff.  The headline “Petty drug users fill New Zealand jails” is definitely off, but most of the rest is just a bit messy.

The primary statistical issue is what epidemiologists call “incidence vs prevalence”, economists call “stocks vs flows”, and point-process mavens call “length-biased sampling”.   Because minor drug offenses lead to short sentences, offenders don’t stay in prison long, and so are a much smaller fraction of the prison population than they are of the court workload.  Specifically, as Michelle calculates, the figures mean there were at most an average of about 400 ‘petty drug users’ in NZ jails over the six years in question, from a prison population of more than 8000.  The ‘petty drug users’ are less than 5% of the prison population.  How much less than 5% is hard to calculate, because there’s a mixture of data on number of people and data on number of charges or offences, which aren’t just one to a customer.

The main point of the story is that lots of people are being prosecuted for minor drug crimes, and that this is dumb.  That, I can certainly agree with.  But one more statistical point is being missed. We get quotes like

The New Zealand Drug Foundation said the figures were alarming and showed the court-focused treatment of minor offenders was not working.

But Justice Minister Judith Collins said all drug offending – no matter how minor – should be dealt with through the criminal justice system.

Looking at the figures, about 3000 people a year are charged with cannabis possession. Based on drug-use survey data, about 385000 people use cannabis sometime during a year, so the criminal justice system is actually missing more than 99% of them.  Or, put another way, the proportion of petty drug users in jails (<5%) is substantially lower than in the NZ population as a whole (>14%).  In order to get convicted, you need to be guilty both of cannabis possession and of coming to the attention of the police.   You don’t need to be very cynical to worry about the impact of differential enforcement of the law.