September 9, 2013
Seeing history
There’s a website that shows a map of all the buildings in the Netherlands, colour-coded by age. To start you off, here’s central Amsterdam
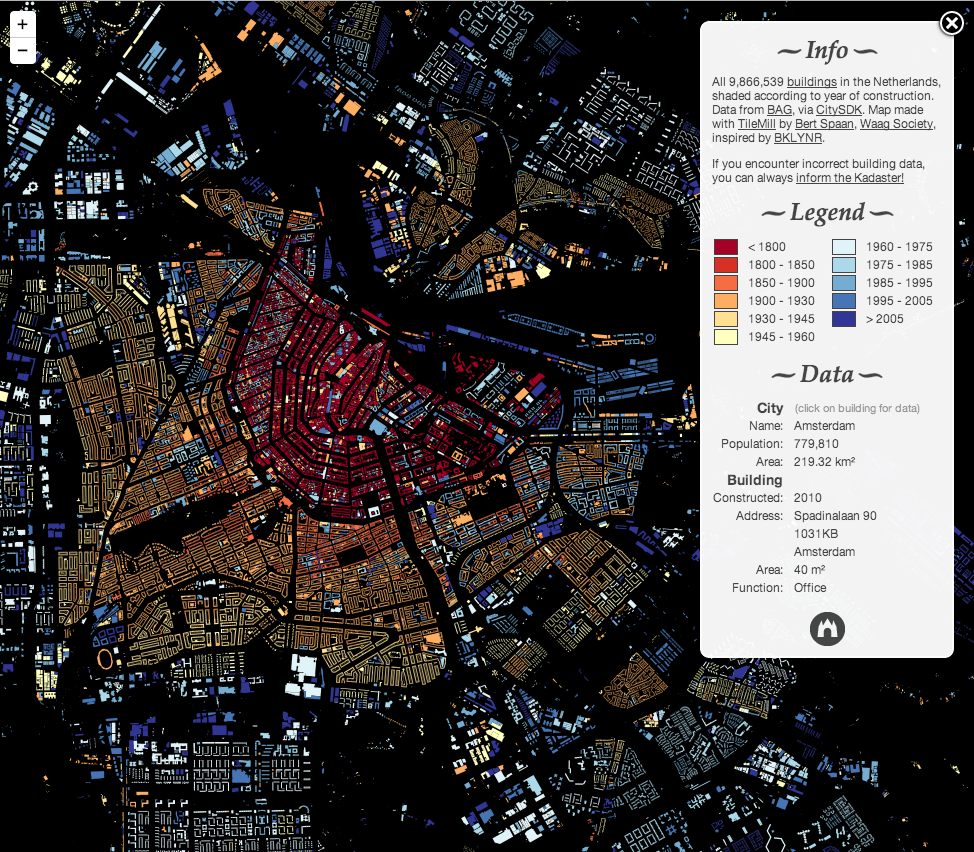
(from Abi Sutherland)
There’s a website that shows a map of all the buildings in the Netherlands, colour-coded by age. To start you off, here’s central Amsterdam
(from Abi Sutherland)
Two examples from other blogs
Mark Liberman, in two posts at Language Log, tackles the claim
Perhaps unsurprisingly, the paper, “Cluttered Writing: Adjectives and Adverbs in academia,” finds that social science papers contain the highest density, followed by humanities and history. Natural science and mathematics contain the lowest frequency, followed by medicine and business and economics.
The difference between the social and the natural sciences is about 15 percent. “Is there a reason that a social scientist cannot write as clearly as a natural scientist?” the paper asks.
He shows that the paper doesn’t provide reliable evidence for the claims, and, in the second post, that neither the claim that social scientists use more modifiers, nor the claim that clear writing uses fewer modifiers is supported by data.
Frances Woolley, at Worthwhile Canadian Initiative, uses life tables to examine the question of grandparents’ funerals as a student excuse. She finds
It turns out, given the age and gender distribution assumed above, and Canadian mortality rates, the odds of all 200 grandparents surviving the term is just 16 percent. In large undergraduate classes, some grandparents will pass away almost every semester.
and
I think some undergraduate students don’t realize just how public and well documented deaths are. It’s far easier to verify whether or not a grandmother died than it is to know whether or not a student was genuinely too sick to complete an assignment.
From the Twitters
Some people are suggesting the 99.9% bus punctuality stats might be made up. I am shocked. Truly shocked.
— AkTransportBlog (@AkTransportBlog) August 21, 2013
There followed a lively discussion, with comparisons to election results in various unpleasant places.
As I’ve suggested before, the really damning aspect of the 99.9% bus punctuality stats is that they might actually be honest. That is, `punctuality’ has been defined in a way that it does not reflect passenger experience and is of almost no interest to passengers. A bus is ‘punctual’ if it starts its route (which I assume means the driver starts up the ticket system) no more than 5 minutes late. What happens later doesn’t matter, as long as the bus does eventually reach its destination.
The real-time prediction system (although it may not be great at predicting the future) knows where the buses have been, so it would be feasible to set up a punctuality summary that actually measured punctuality — perhaps the proportion of major timepoints where the bus was no more than 5 minutes late or 1 minute early in departing.
I mention this point again because I’m teaching Design of Clinical Trials at the moment, and one of the big issues is ‘surrogate outcomes’. That is, people running studies are often tempted to measure something convenient rather than what patients care about: diabetes trials may measure blood sugar rather than heart attacks and kidney failure; heart disease trials may measure blood pressure rather than heart attacks or strokes; cancer trials may measure tumour size rather than survival or symptoms. This matters, because there are important examples where a treatment improves a surrogate outcome, but makes the real outcomes worse.
There is no way that the Auckland bus punctuality statistics are accurate measurements of something that matters to passengers. It’s not a matter of life and death as it is in clinical trials, but it’s still a waste of time and money. And since the Auckland bus system is actually pretty good, it makes Auckland Transport and the Council look unnecessarily stupid.
A beautiful map from the Cooper Center for Demographics at the University of Virginia, showing 300 million dots, one for each person in the United States, coloured by the census-reported race/ethnicity categories.
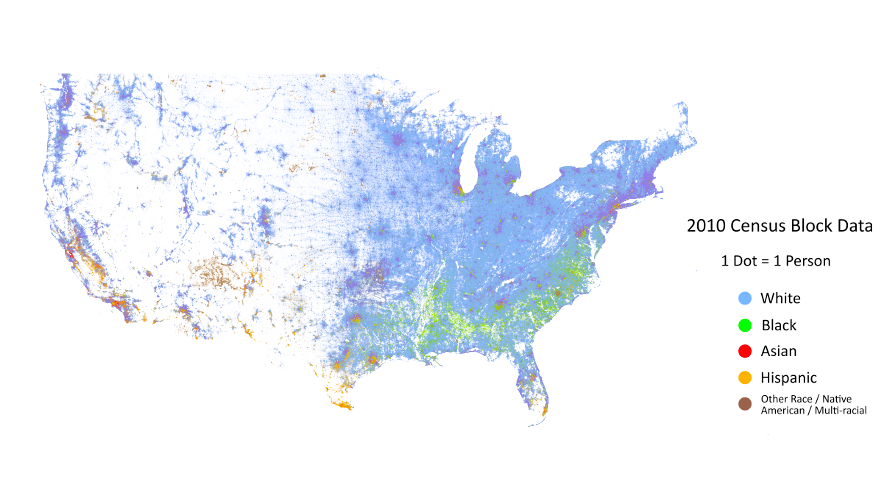
As we’ve pointed out before, the most obvious feature in the map is the change in population density across the north-south ‘dry line’, but it’s the other features that are of most interest. The larger black population across the south-east, and the greater diversity of the cities are obvious.
There’s also a zoomable version of the map for you to explore. Here’s part of Seattle, where I used to live, which is the purple splotch at the top left of the whole-US map
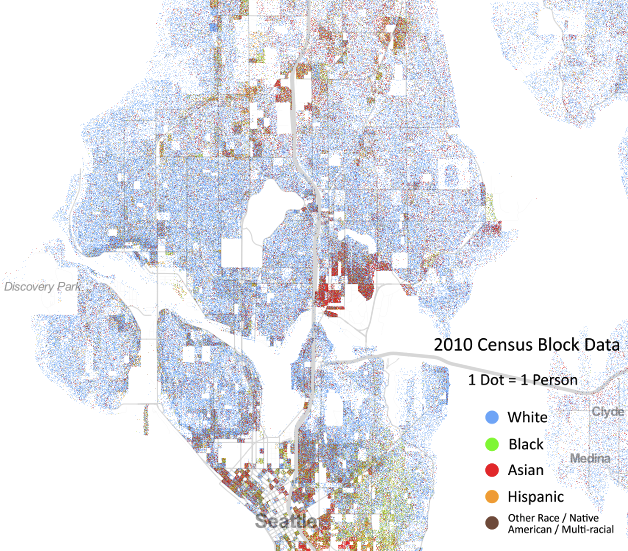
At this smaller scale there’s a lot more clumping by race, with black and Hispanic people living at the top and bottom of the map. Oh, and that odd-shaped spot in the middle? That’s the University of Washington, so those are university students.
(via Luis Apiolaza on Twitter)
Today Stuff tells us that talcum powder, dogs, barbecues, fish oil, oral sex, and air travel cause cancer. The statistic on dogs is especially bizarre
Analysis of breast cancer cases by researchers at the University of Munich showed that 79.7 per cent of all breast cancer patients had regular contact with dogs before diagnosis. Only 4.4 per cent of the patients did not have pets at any time, compared to 57.3 per cent of a healthy control group. According to researchers, that’s a 29-fold increased risk for pet owners.
Given that the lifetime risk of breast cancer is roughly 10%, a 29-fold increase seems a bit improbable. That’s more than the increase in lung cancer risk caused by smoking, for example.
It’s interesting to track this one down. An obvious place to start is the “Kill or Cure?” website that collects Daily Mail stories about cancer. Back in 2007, the Mail reported what looks like the same story
Both dogs and humans carry the same virus that can induce cancer
Analysis of breast cancer cases by researchers at the University of Munich showed that patients with this type of cancer were significantly more likely to have kept a dog than a cat.
In fact, 79.7 per cent of all patients had intensive contact with dogs before they were diagnosed.
Only 4.4 per cent of the patients did not have pets at any time compared to 57.3 per cent of a healthy control group ? so there was a 29-fold increased risk for pet owners.
They didn’t link either, but the story looks like it comes from this publication (and if you can get to the full-text article you find that the numbers match).
The first thing to note is that the journal is Medical Hypotheses, notoriously “intended as a forum for unconventional ideas without the traditional filter of scientific peer review,
The second thing to note is the relative risk given in the abstract: 3.5, not 29. The number ’29’ does appear later in the paper, but even the authors aren’t prepared to defend it much.
The third thing to notice is what comparison was actually done
It became apparent that patients with breast carcinoma (N=69) owned significantly more often dogs but not cats compared to age matched female controls. We compared the frequencies of dog and pet ownership with data from public available statistics on women (N=1320) of the same age group in Bavaria.
That is, they asked a small number of patients with breast cancer about close contact with dogs, but used public statistics on pet ownership for the controls. Using different methods of obtaining information in cases and controls is a notorious way to come up with spurious results.
The theory was that dogs and humans shared a virus that caused breast cancer. There have been some reports of finding genetic material that looks like this virus in breast tumours, but other reports that did not, including an Australian research paper that looked very carefully.
The famous London Transport map showed that a train map didn’t have to represent where the trains went, just how they related to each other. A new example from New York uses concentric circles. The designer says
“These circles maps score poorly for simplicity: the line trajectories have lots of twists and turns, but score well for coherence: the city is forced into an unprecedented level of organization
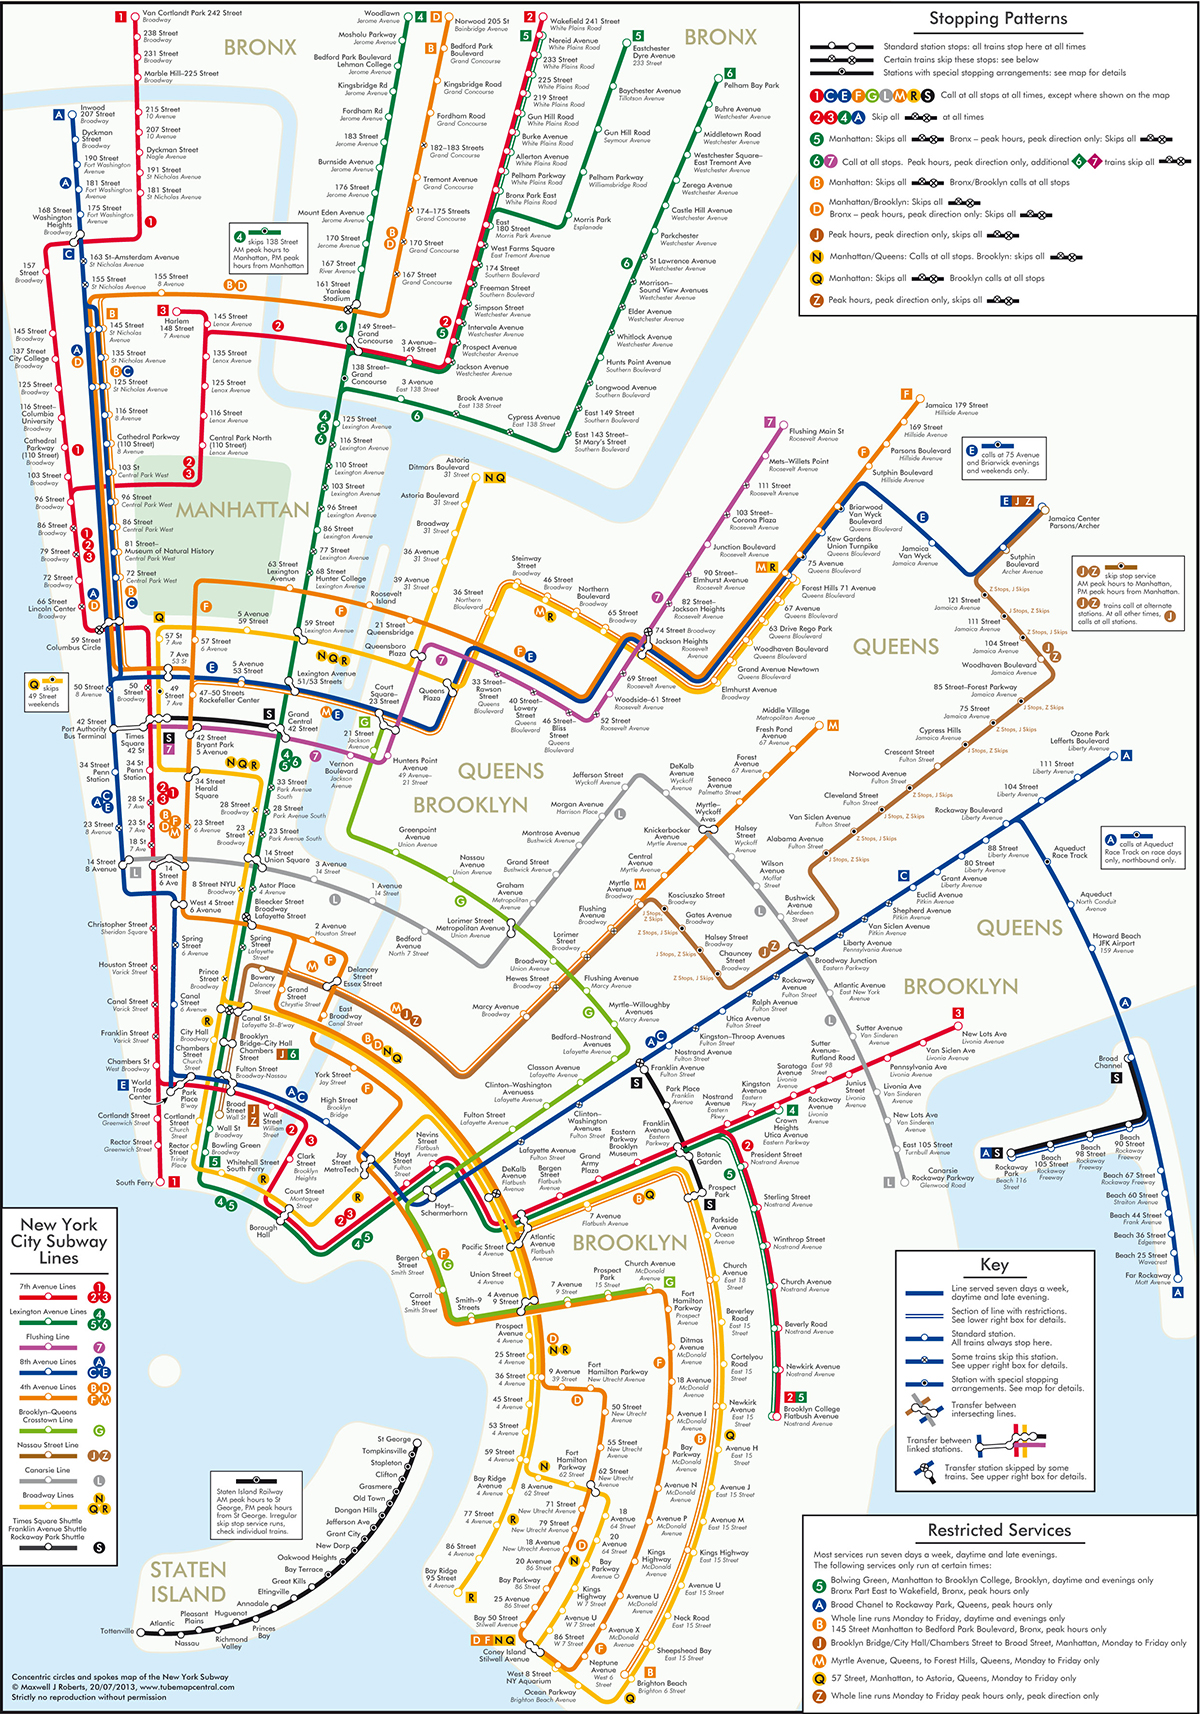
(via @juhasaarinen)
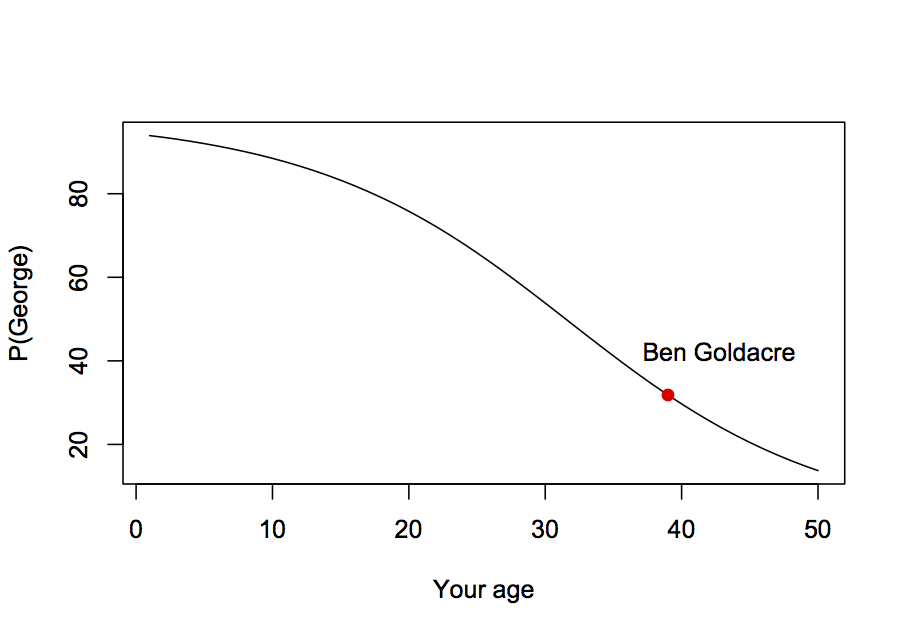
In yesterday’s coronation lifetables post, it turned out that a 39-yr old UK male had about a 32% chance of outliving a 31-yr old UK male. That’s because there is quite a lot of variation around the mean life expectancy.
One might try estimating Ben Goldacre’s chance of seeing King George by working out Prince William’s life expectancy and then seeing how likely Ben is to be alive at that expected date. The calculation ignores the uncertainty in Prince William’s lifespan, and it ends up with a serious underestimate of 20%. If Ben Goldacre is still alive at baby George’s coronation, it is could well be because the coronation happens earlier than expected, and just using the mean life expectancy ignores this possibility.
The same issue arises in some of the tweets reacting to the StatsChat post, eg from James Shield “For me, about 70%, which seems high. My guess is I’ll be 86.” The 70% probability is so high precisely because the event could happen before he is 86.
Ben Goldacre asked on Twitter
I’m 39, Prince William is 31, what are the odds of me seeing King George on the throne? Taking current projected mortality trends, that is.
— ben goldacre (@bengoldacre) July 24, 2013
As he suggests, we’re going to have to make some oversimplifications. Both Prince William (who comes from a wealthy, long-lived family) and Ben Goldacre (who is a skinny, hyperactive medical doctor) are likely to live longer than the typical UK male, and we will ignore this. We will also ignore the possibilities that Baby George dies before his father, or that William dies before his father or grandmother, and the possibility that there won’t be a throne for King George.
Now we need to get life tables for UK males, which give the current risk of death at each age. For each year into the future, we multiply the chance of Prince William dying in that year by the chance that Dr Goldacre is still alive, and add these up, to get a little over 30%
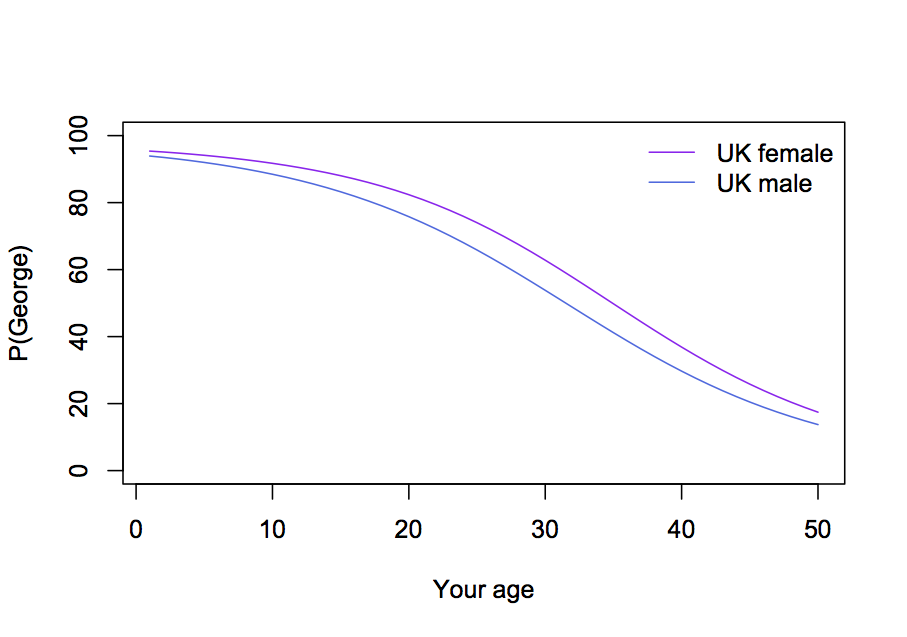
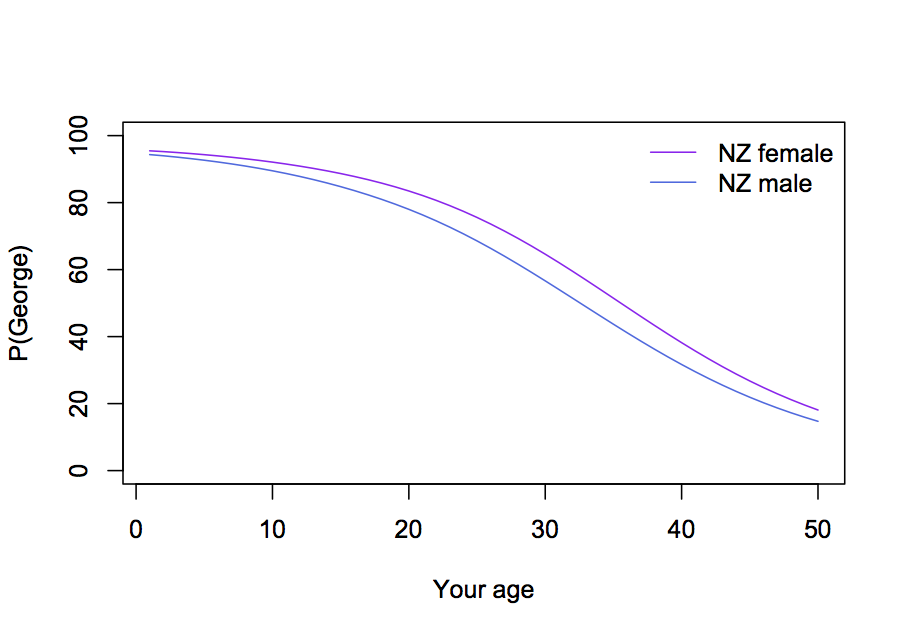
We can do the same thing for UK females and (with NZ life tables) for NZ males and females
From Scoop, in a press release on the legal-highs bill by Manurewa Local Board member Toa Greening
Ireland led the way by prohibiting all non-prescribed psychoactive substances back in 2010. This resulted in an immediate reduction in related psychoactive substance health issues and crime.
Irish data on recorded crimes is available throught the Ireland Official Statistics portal, Statcentral.ie. This graph shows quarterly data since 2004 for the main crime categories (the heavy blue line is drug offenses, and the vertical line is when the ban came into force)
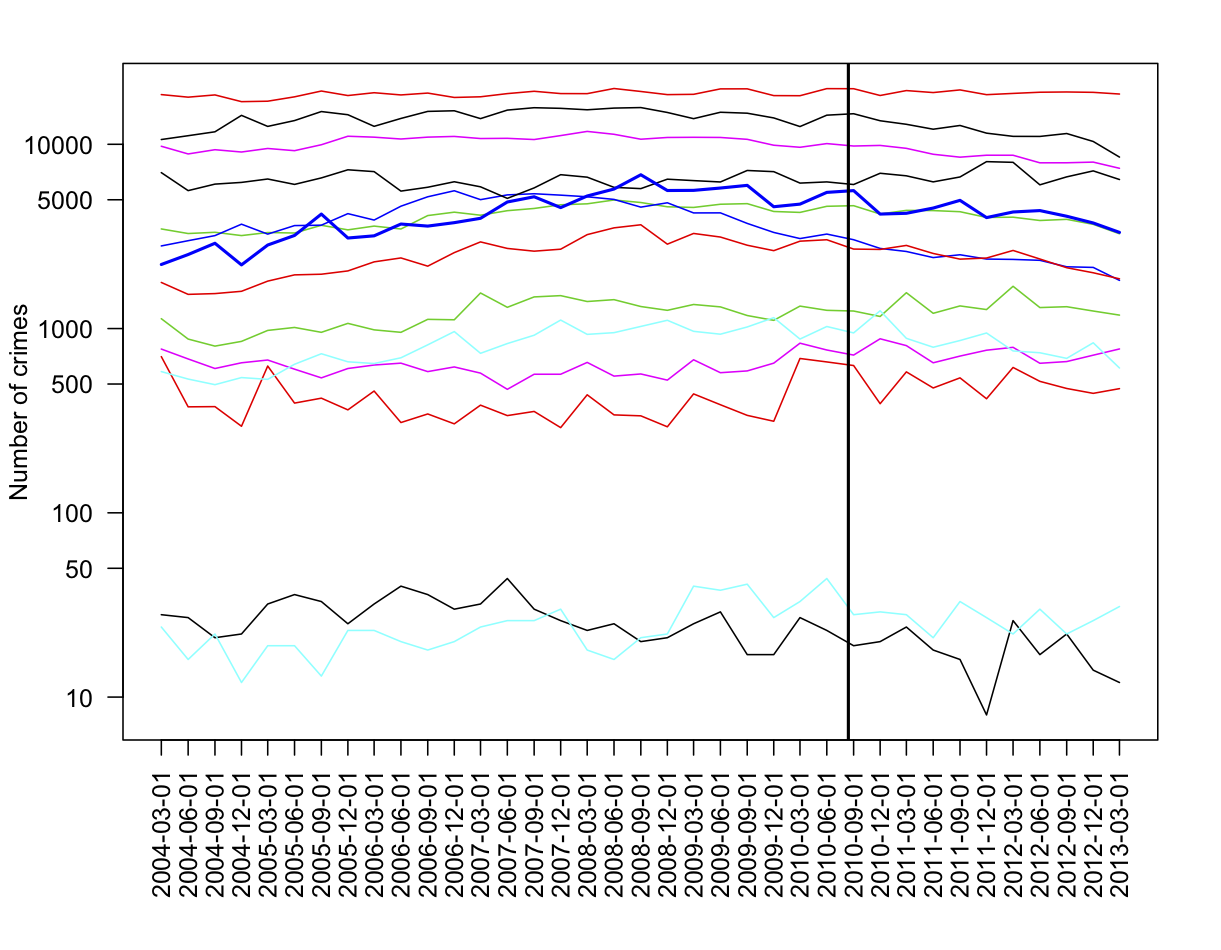
I don’t see any dramatic effects of the ban on any category of crime.
We have seen before on StatsChat that, worldwide, there’s no relationship between the position of the moon and the risk of earthquakes. Suppose, for the sake of argument, that there was some relationship in New Zealand. Imagine that in Wellington, 100% of big earthquakes happened in the 24-hour period centered on the moon’s closest approach to the earth. The real figure is more like 0%, since Sunday’s earthquake missed the window by a few hours (perigee was 8:28am Monday) and the 1855 Wairarapa quake and the 1848 Marlborough quake missed by days, but we’re running a thought experiment here. Would this level of prediction be useful?
At one or two big quakes per century, even if they all happened on a predictable day of the lunar month, that’s a risk of between 0.075% and 0.15% per month. At one extreme, you couldn’t evacuate Wellington every month to get around the risk (and even if you did, it would probably cause more injuries each month than happened in Sunday’s quake). At the other extreme, you could make sure you had a few days supply of water and food, and a plan for communicating with friends and relatives, but that’s a good idea even in the real world where earthquakes are unpredictable. The only thing I could think of is that you wouldn’t schedule major single-day tourist events (World Cup games, royal visits) or the most delicate pieces of construction work for that day.
[If you want to look up lunar distances, there’s a convenient online calculator. Note that the times are in UTC, so the NZ standard time is 12 hours later than given]