Posts filed under Graphics (394)

April 23, 2014

Visualising income inequality

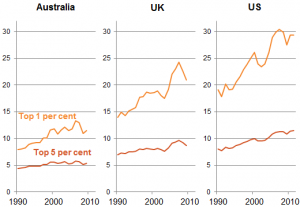
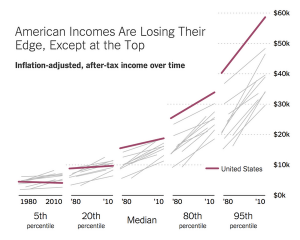
From the New York Times, a set of slope graphs comparing countries over a 30-year period at five points in the distribution.

Bl3go3_IUAApnRj


The headline is a bit exaggerated — the US seems to be retaining its lead at the 80th percentile — but the graph is good.


From Jim Savage (on Twitter), income of top 1% or top 5% as multiple of income for bottom 90%

BG5uZwMCUAAVCYV


Looking into the top few percent is tricky because the definition of ‘income’ becomes flexible.  As Matt Nolan pointed out a few years ago, there was a big increase in the 1%’s share of US income in 1986, which is due at least in part to the Tax Reform Act making tax evasion less advantageous and so increasing reported taxable income.

April 17, 2014

This is not a map

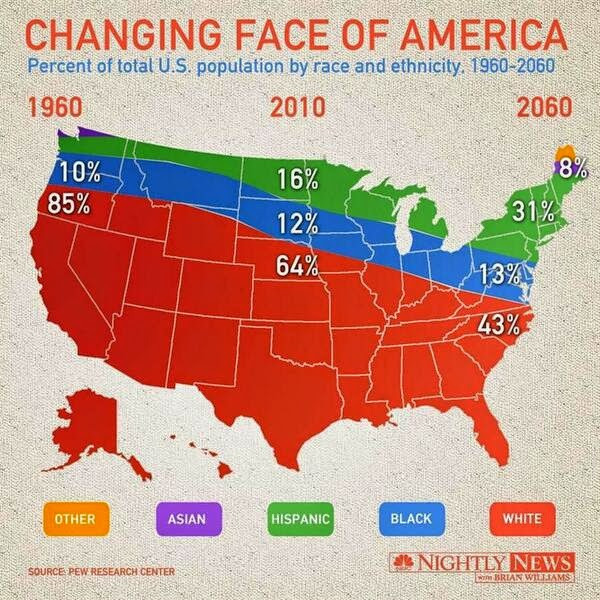
Changing-face


This is not a map. The Asian population of the US is not confined to Maine and northern Washington, and residents of the Dakotas are not primarily Black and Hispanic. It’s a stacked line plot, which has been cut out to fit the map outline, just like you might do in kindergarten. (via Flowing Data)

Here’s the real thing, from Pew Research.

map

April 14, 2014

What do we learn from the Global Drug Use Survey?

drug


That’s the online summary at Stuff.  When you point at one of the bubbles it jumps out at you and tells you what drug it is. The bubbles make it relatively hard to compare non-adjacent numbers, especially as you can only see the name of one at a time. It’s not even that easy to compare adjacent bubbles, eg, the two at the lower right, which differ by more than two percentage points.

More importantly, this is the least useful data from the survey.  Because it’s a voluntary, self-selected online sample, we’d expect the crude proportions to be biased, probably with more drug use in the sample than the population. To the extent that we can tell, this seems to have happened: the proportion of past-year smokers is 33.5% compared to the Census estimate of 15% active smokers.  It’s logically possible for both of these to be correct, but I don’t really believe it.  The reports of cannabis use are much higher than the (admittedly out of date) NZ Alcohol and Drug Use Survey.  For this sort of data, the forthcoming drug-use section of the NZ Health Survey is likely to be more representative.

Where the Global Drug Use Survey will be valuable is in detail about things like side-effects, attempts to quit, strategies people use for harm reduction. That sort of information isn’t captured by the NZ Health Survey, and presumably it is still being processed and analysed.  Some of the relative information might be useful, too: for example, synthetic cannabis is much less popular than the real thing, with past-year use nearly five times lower.

April 9, 2014

Busable Wellington

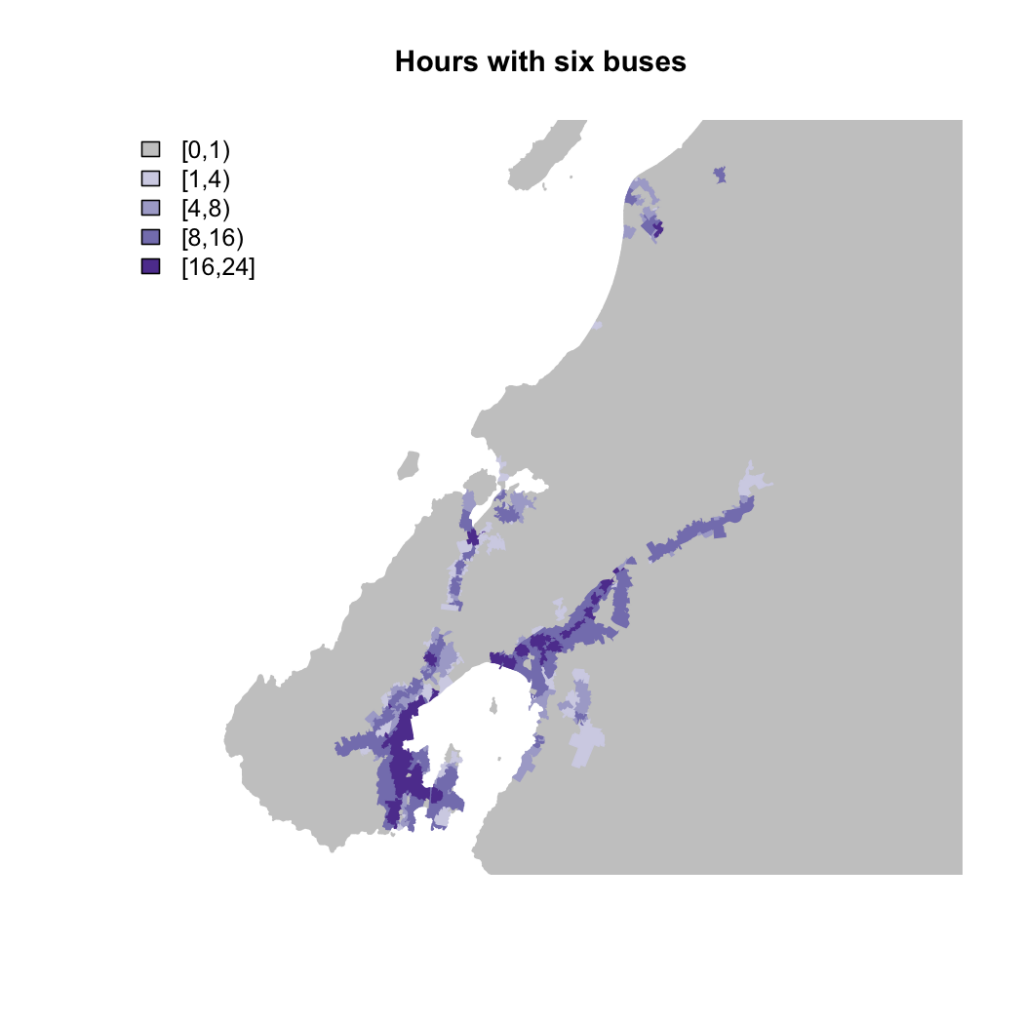
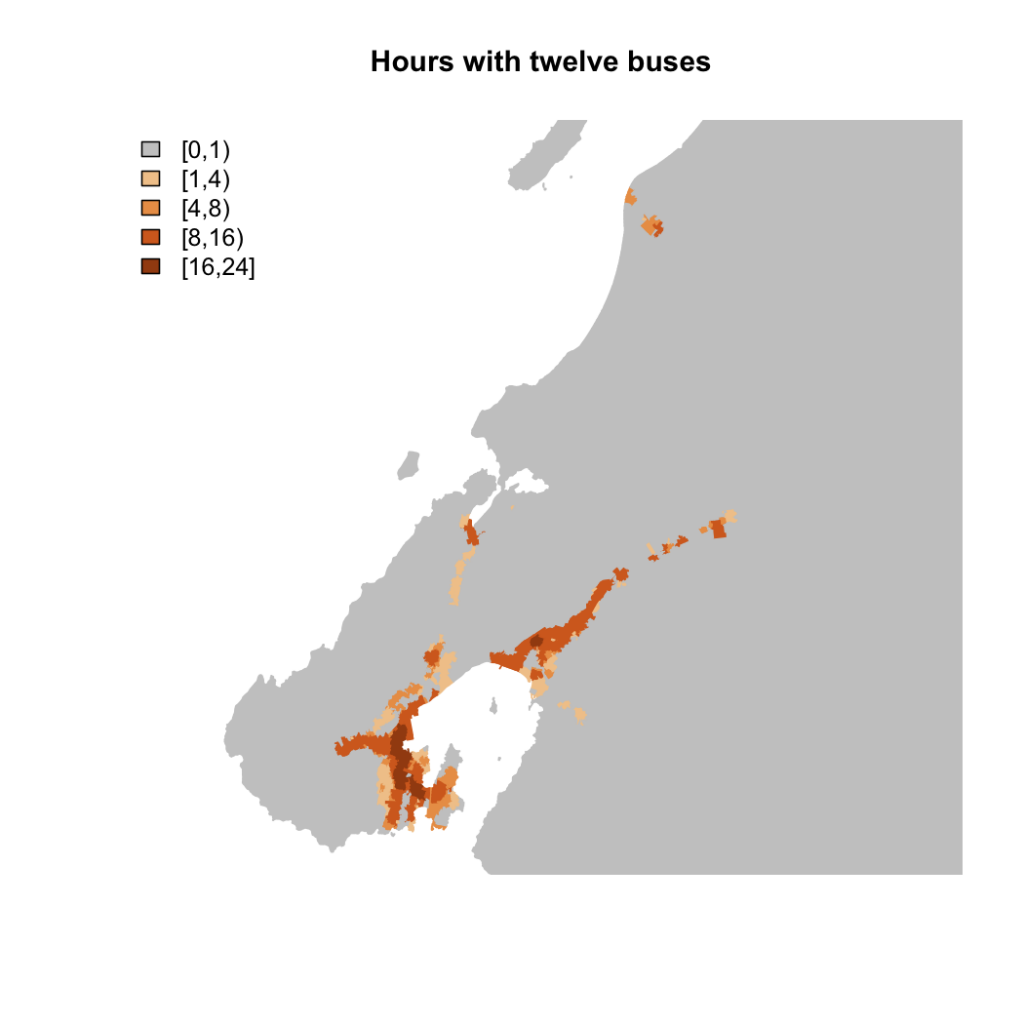
In response to a reader request, here are the same bus service maps as for Auckland. Again, click for big PDF files so you can zoom in.  I think these include non-bus transit, but I’m not completely sure.

Hours per day with at least six transit trips within 500m

wellybus6png


Hours per day with at least 12 transit trips within 500m

wellybus12png


In the Wellington region it seems that people who have any bus service have a useful amount.

The region as a whole has a smaller proportion of people with good public transport than Auckland region (7% in the top category, 60% in the bottom), but if we restrict to Wellington City there are 17% in the top category, 26% in the next, and only 30% in the lowest.


[Update: Here’s a version with a 1km distance instead of 500m]


April 8, 2014

Busable Auckland

Bus commuter services can be very useful in reducing traffic and parking congestion in the city center, but reducing the average number of cars per household requires buses that are available all the time. I used the Auckland Transport bus schedule data and the new StatsNZ meshblock data and boundary files

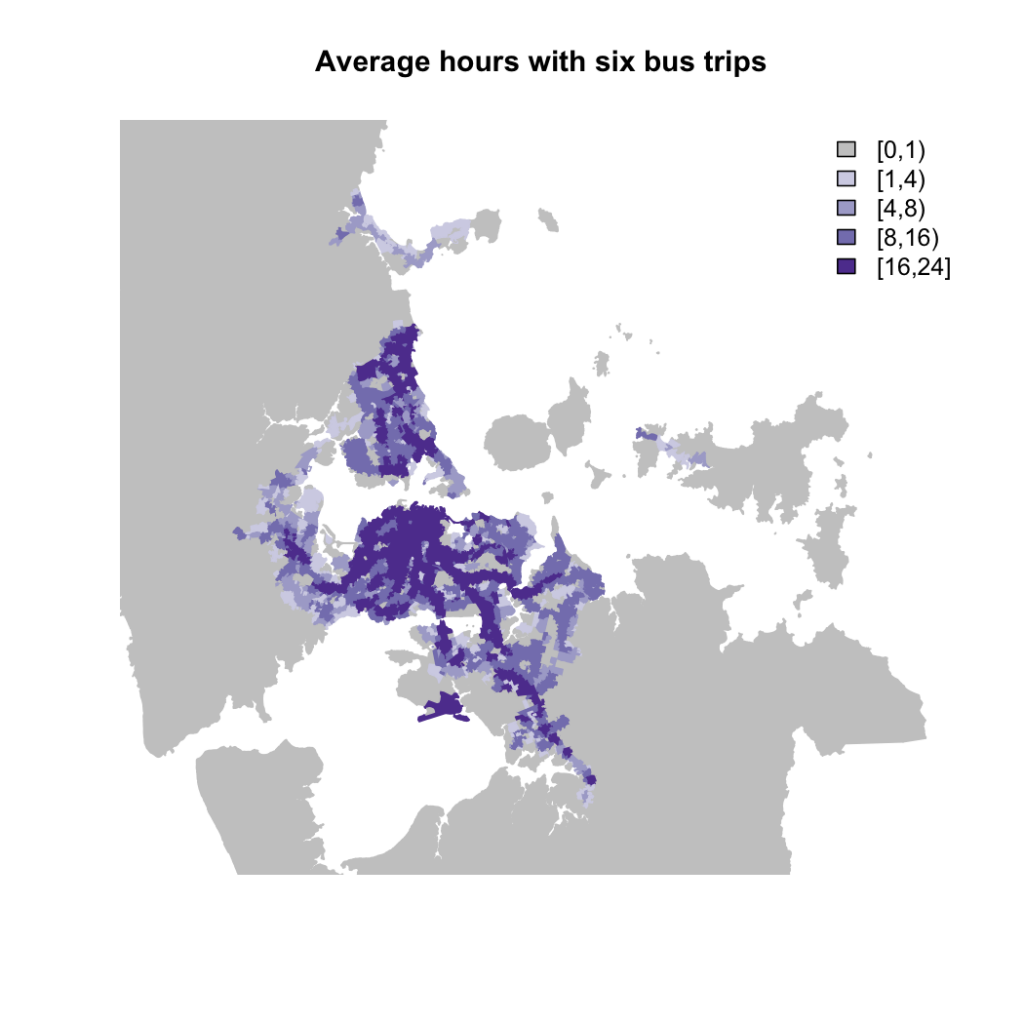
Here’s a map of Auckland showing how many hours per day (on average) there are at least six bus trips per hour stopping within 500m of each meshblock (actually, within 500m of the ‘label point’ for the meshblock).

On a single road, six trips per hour is one trip in each direction every twenty minutes. The dark purple area has this level of service at least 16 hours a day on average. (Click for the honking great PDF version.)

bus6png

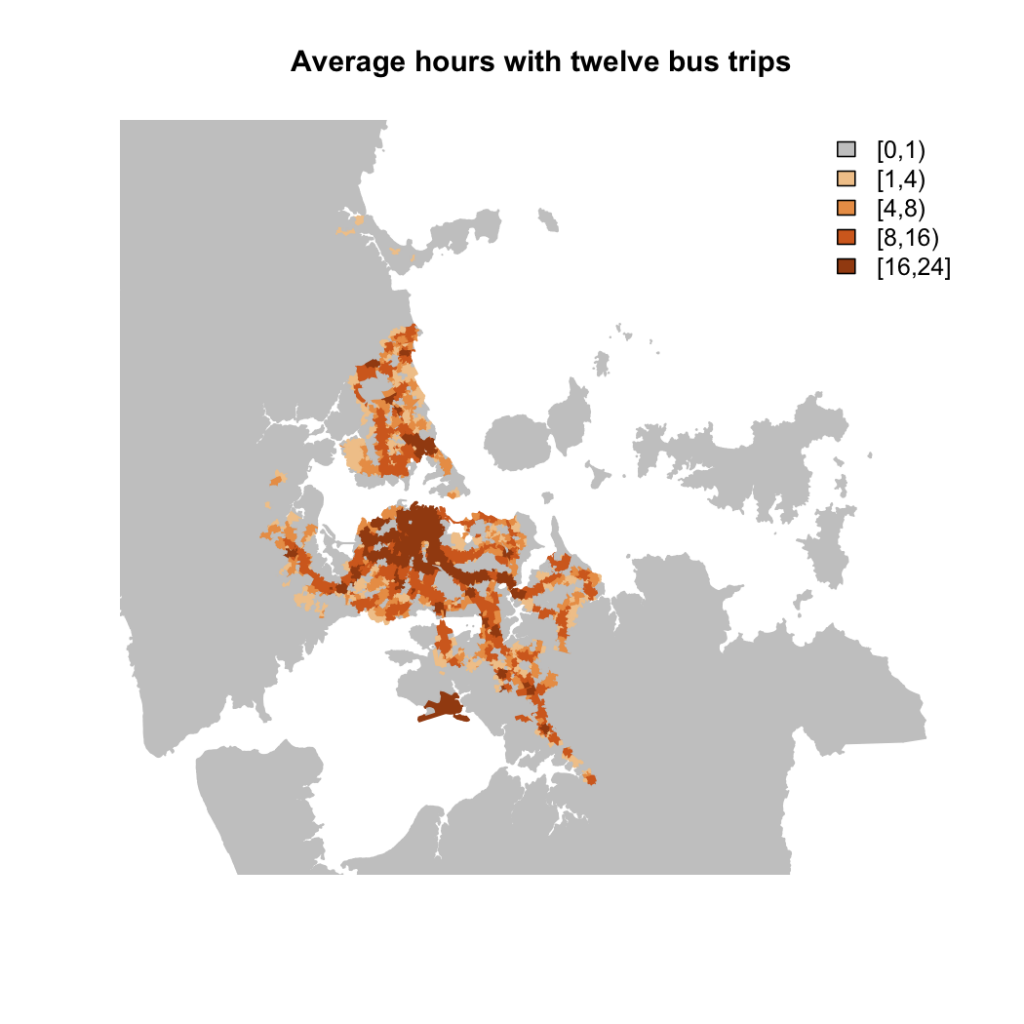
For twelve trips per hour (eg, one every twenty minutes on two different routes) the area shrinks a lot

bus12png

The reason for using meshblocks in the map is that we can merge the bus files with the census files. For example, for Auckland as a whole, 50% of the population is in the grey busless emptiness, 17% in the 8-16 hour tolerable zone, and 12% in the pretty reasonable 16+ hour zone.   People of Maori descent are more likely to be unbused (60%) and less likely to be well bused (8%), as are people over 65 (60% in the lowest category, 9% in the highest).

Recent (<10 years) migrants like transit: 18% of us are in the good bus category and only 40% in the busless category.

April 4, 2014

Thomas Lumley’s latest Listener column

…”One of the problems in developing drugs is detecting serious side effects. People who need medication tend to be unwell, so it’s hard to find a reliable comparison. That’s why the roughly threefold increase in heart-attack risk among Vioxx users took so long to be detected …”

Read his column, Faulty Powers, here.

April 2, 2014

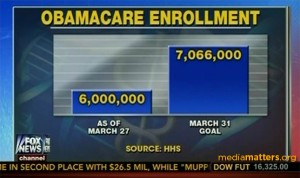
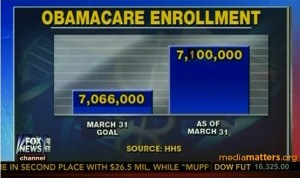
Why barcharts must start at zero

From Fox News last week (via)

obamacareenrollment-fncchart

My edit based on what ended up happening

Slide1


If the magnitudes don’t matter, the graph can’t be worth the pixels it’s printed on.


March 31, 2014

Election poll averaging

The DimPost posted a new poll average and trend, which gives an opportunity to talk about some of the issues in interpretation (you should also listen to Sunday’s Mediawatch episode)

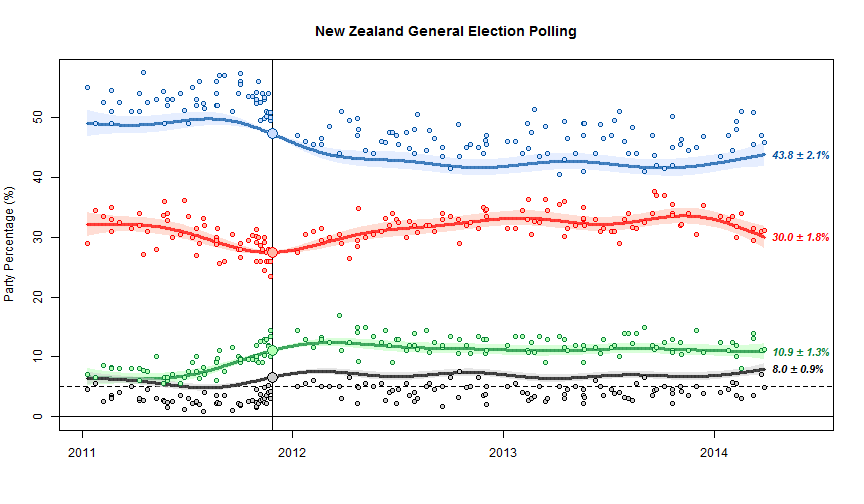
The basic chart looks like this
nzpolls20140330bc1

The scatter of points around the trend line shows the sampling uncertainty.  The fact that the blue dots are above the line and the black dots are below the line is important, and is one of the limitations of NZ polls.  At the last election, NZ First did better, and National did worse, than in the polling just before the election. The trend estimates basically assume that this discrepancy will keep going in the future.  The alternative, since we’ve basically got just one election to work with, is to assume it was just a one-off fluke and tells us nothing.

We can’t distinguish these options empirically just from the poll results, but we can think about various possible explanations, some of which could be disproved by additional evidence.  One possibility is that there was a spike in NZ First popularity at the expense of National right at the election, because of Winston Peters’s reaction to the teapot affair.  Another possibility is that landline telephone polls systematically undersample NZ First voters. Another is that people are less likely to tell the truth about being NZ First voters (perhaps because of media bias against Winston or something).  In the US there are so many elections and so many polls that it’s possible to estimate differences between elections and polls, separately for different polling companies, and see how fast they change over time. It’s harder here. (update: Danyl Mclauchlan points me to this useful post by Gavin White)

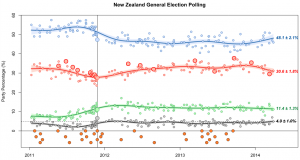
You can see some things about different polling companies. For example, in the graph below, the large red circles are the Herald-Digipoll results. These seem a bit more variable than the others (they do have a slightly smaller sample size) but they don’t seem biased relative to the other polls.  If you click on the image you’ll get the interactive version. This is the trend without bias correction, so the points scatter symmetrically around the trend lines but the trend misses the election result for National and NZ First.
poll-digipoll

March 29, 2014

Where do people come from?

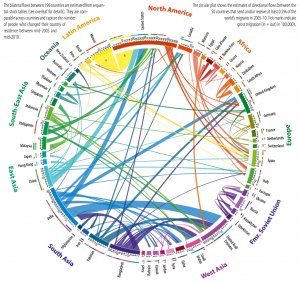
An analysis of global migration flows,  published in Science, via Quartzvid_global_migration_datasheet_web-gimp3


The first thing that Kiwis will note is the graph says no-one migrates to New Zealand. That’s even though the proportion of foreign-born residents in New Zealand is almost twice that in the USA and more than twice that in the UK.

As usual, the issue is denominators: the graphic shows the largest migration flows, and in New Zealand the flow of migrants to Australia is about equal to all the inflows put together. None of the other flows of migrants are large enough to show up.

March 26, 2014

Graphic lie factor: sports edition

via Alberto Cairo, this gem from Malaprensa, a Spanish mediawatch site, originally from Marca.

futbol


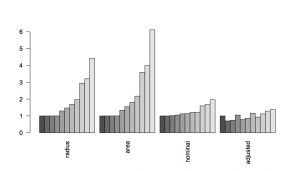
This isn’t actually a pie chart, it’s a bar chart that has been horribly warped around a circle.  It shows top transfer fees in football (ie, soccer). One Neymar da Silva Santos Júnior has allegedly ended up with a transfer fee estimated at 111 million euros, through complicated arrangements. This would be a record; the originally announced figure was a mere 57 million euros, which would put Neymar in tenth place alongside Hernan Crespo

Malaprensa points out that the figures aren’t inflation-adjusted, and that they aren’t including comparable sets of payments for all the players. They don’t point out how bad the display is: compare the heights for 57 and 111 million euro, and then think about what the area comparison would be.

I’ve redrawn the bars in a sensible coordinate system,  showing the apparent differences based on the height, area, nominal euro amount, and euro amount adjusted for inflation (the last is from Malaprensa), with Crespo’s transfer fee scaled to 1 in each case

adjusted-futbol

It’s much less impressive when it’s shown accurately.