Posts filed under Evidence (90)

August 20, 2016

The statistical significance filter

Attention conservation notice: long and nerdy, but does have pictures.

You may have noticed that I often say about newsy research studies that they are are barely statistically significant or they found only weak evidence, but that I don’t say that about large-scale clinical trials. This isn’t (just) personal prejudice. There are two good reasons why any given evidence threshold is more likely to be met in lower-quality research — and while I’ll be talking in terms of p-values here, getting rid of them doesn’t solve this problem (it might solve other problems).  I’ll also be talking in terms of an effect being “real” or not, which is again an oversimplification but one that I don’t think affects the point I’m making.  Think of a “real” effect as one big enough to write a news story about.

evidence01

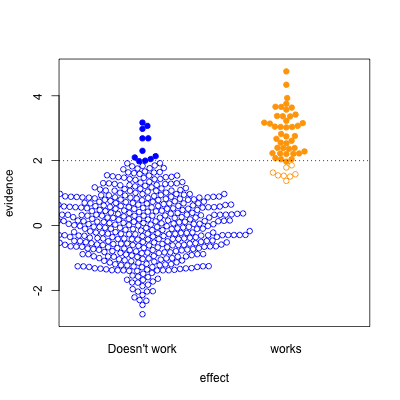
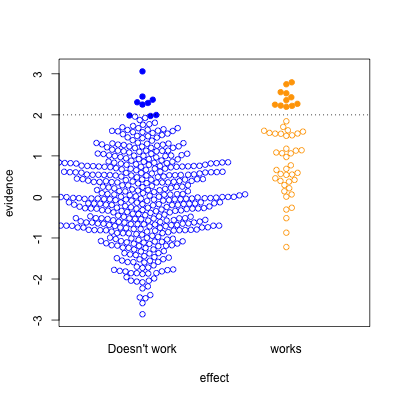
This graph shows possible results in statistical tests, for research where the effect of the thing you’re studying is real (orange) or not real (blue).  The solid circles are results that pass your statistical evidence threshold, in the direction you wanted to see — they’re press-releasable as well as publishable.

Only about half the ‘statistically significant’ results are real; the rest are false positives.

I’ve assumed the proportion of “real” effects is about 10%. That makes sense in a lot of medical and psychological research — arguably, it’s too optimistic.  I’ve also assumed the sample size is too small to reliably pick up plausible differences between blue and yellow — sadly, this is also realistic.

evidence02

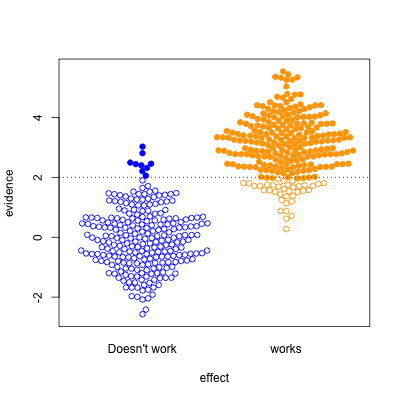
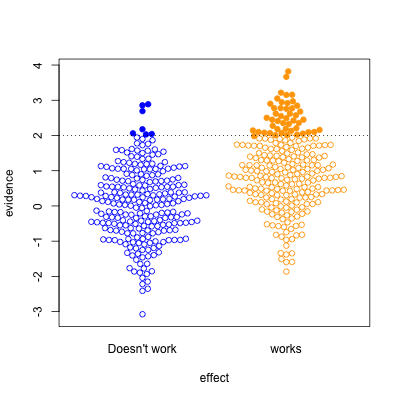
In the second graph, we’re looking at a setting where half the effects are real and half aren’t. Now, of the effects that pass the threshold, most are real.  On the other hand, there’s a lot of real effects that get missed.  This was the setting for a lot of clinical trials in the old days, when they were done in single hospitals or small groups.

evidence03

The third case is relatively implausible hypotheses — 10% true — but well-designed studies.  There are still the same number of false positives, but many more true positives.  A better-designed study means that positive results are more likely to be correct.

evidence04

Finally, the setting of well-conducted clinical trials intended to be definitive, the sort of studies done to get new drugs approved. About half the candidate treatments work as intended, and when they do, the results are likely to be positive.   For a well-designed test such as this, statistical significance is a reasonable guide to whether the effect is real.

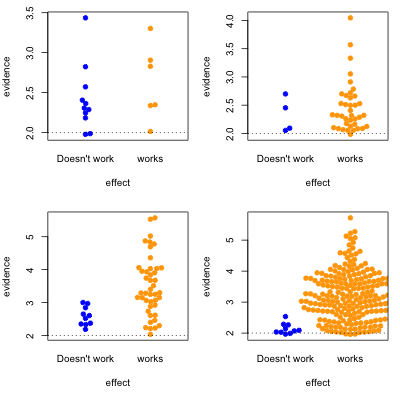
The problem is that the media only show a subset of the (exciting) solid circles, and typically don’t show the (boring) empty circles. So, what you see is

evidence05

where the columns are 10% and 50% proportion of studies having a true effect, and the top and bottom rows are under-sized and well-design studies.


Knowing the threshold for evidence isn’t enough: the prior plausibility matters, and the ability of the study to demonstrate effects matters. Apparent effects seen in small or poorly-designed studies are less likely to be true.
April 9, 2016

Movie stars broken down by age and sex

The folks at Polygraph have a lovely set of interactive graphics of number of speaking lines in 2000 movie screenplays, with IMDB look-ups of actor age and gender.  If you haven’t been living in a cave on Mars, the basic conclusion won’t be surprising, but the extent of the differences might. Frozen, for example, gave more than half the lines to male characters.

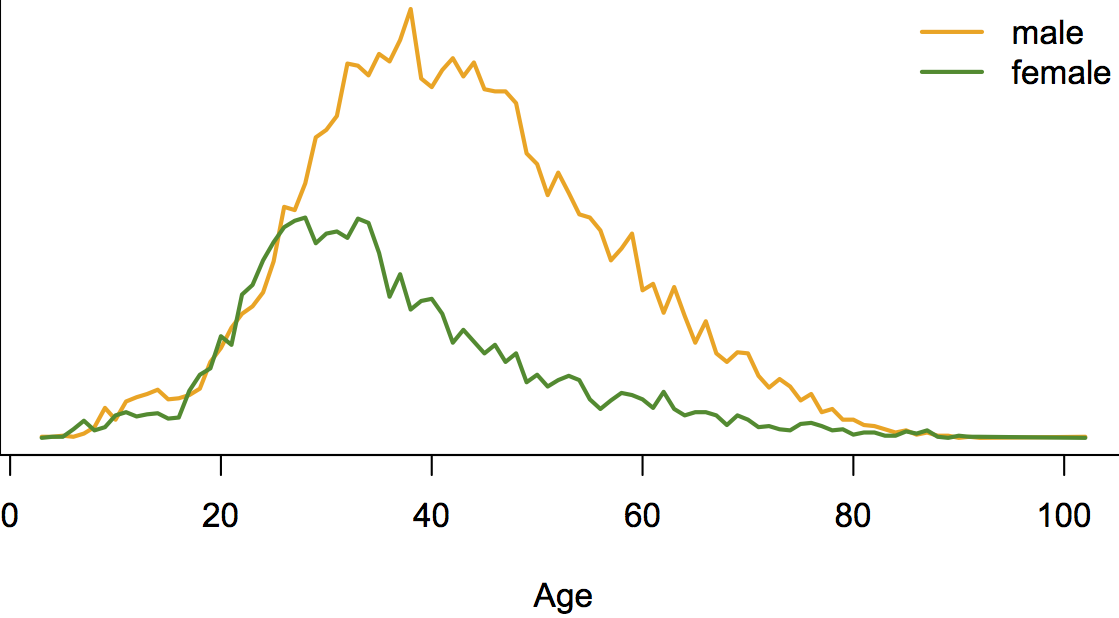
They’ve also made a lot of data available on Github for other people to use. Here’s a graph combining the age and gender data in a different way than they did: total number of speaking lines by age and gender

hollywood

Men and women have similar number of speaking lines up to about age 30, but after that there’s a huge separation and much less opportunity for female actors.  We can all think of exceptions: Judi “M” Dench, Maggie “Minerva” Smith, Joanna “Absolutely no relation” Lumley, but they are exceptions.

March 24, 2016

Two cheers for evidence-based policy

Daniel Davies has a post at the Long and Short and a follow-up post at Crooked Timber about the implications for evidence-based policy of non-replicability in science.

Two quotes:

 So the real ‘reproducibility crisis’ for evidence-based policy making would be: if you’re serious about basing policy on evidence, how much are you prepared to spend on research, and how long are you prepared to wait for the answers?

and

“We’ve got to do something“. Well, do we? And equally importantly, do we have to do something right now, rather than waiting quite a long time to get some reproducible evidence? I’ve written at length, several times, in the past, about the regrettable tendency of policymakers and their advisors to underestimate a number of costs; the physical deadweight cost of reorganisation, the stress placed on any organisation by radical change, and the option value of waiting. 

February 13, 2016

Just one more…

NPR’s Planet Money ran an interesting podcast in mid-January of this year. I recommend you take the time to listen to it.

The show discussed the idea that there are problems in the way that we do science — in this case that our continual reliance on hypothesis testing (or statistical significance) is leading to many scientifically spurious results. As a Bayesian, that comes as no surprise. One section of the show, however, piqued my pedagogical curiosity:

STEVE LINDSAY: OK. Let’s start now. We test 20 people and say, well, it’s not quite significant, but it’s looking promising. Let’s test another 12 people. And the notion was, of course, you’re just moving towards truth. You test more people. You’re moving towards truth. But in fact – and I just didn’t really understand this properly – if you do that, you increase the likelihood that you will get a, quote, “significant effect” by chance alone.

KESTENBAUM: There are lots of ways you can trick yourself like this, just subtle ways you change the rules in the middle of an experiment.

You can think about situations like this in terms of coin tossing. If we conduct a single experiment where there are only two possible outcomes, let us say “success” and “failure”, and if there is genuinely nothing affecting the outcomes, then any “success” we observe will be due to random chance alone. If we have a hypothetical fair coin — I say hypothetical because physical processes can make coin tossing anything but fair — we say the probability of a head coming up on a coin toss is equal to the probability of a tail coming up and therefore must be 1/2 = 0.5. The podcast describes the following experiment:

KESTENBAUM: In one experiment, he says, people were told to stare at this computer screen, and they were told that an image was going to appear on either the right site or the left side. And they were asked to guess which side. Like, look into the future. Which side do you think the image is going to appear on?

If we do not believe in the ability of people to predict the future, then we think the experimental subjects should have an equal chance of getting the right answer or the wrong answer.

The binomial distribution allows us to answer questions about multiple trials. For example, “If I toss the coin 10 times, then what is the probability I get heads more than seven times?”, or, “If the subject does the prognostication experiment described 50 times (and has no prognostic ability), what is the chance she gets the right answer more than 30 times?”

When we teach students about the binomial distribution we tell them that the number of trials (coin tosses) must be fixed before the experiment is conducted, otherwise the theory does not apply. However, if you take the example from Steve Lindsay, “..I did 20 experiments, how about I add 12 more,” then it can be hard to see what is wrong in doing so. I think the counterintuitive nature of this relates to general misunderstanding of conditional probability. When we encounter a problem like this, our response is “Well I can’t see the difference between 10 out of 20, versus 16 out of 32.” What we are missing here is that the results of the first 20 experiments are already known. That is, there is no longer any probability attached to the outcomes of these experiments. What we need to calculate is the probability of a certain number of successes, say x given that we have already observed y successes.

Let us take the numbers given by Professor Lindsay of 20 experiments followed a further 12. Further to this we are going to describe “almost significant” in 20 experiments as 12, 13, or 14 successes, and “significant” as 23 or more successes out of 32. I have chosen these numbers because (if we believe in hypothesis testing) we would observe 15 or more “heads” out of 20 tosses of a fair coin fewer than 21 times in 1,000 (on average). That is, observing 15 or more heads in 20 coin tosses is fairly unlikely if the coin is fair. Similarly, we would observe 23 or more heads out of 32 coin tosses about 10 times in 1,000 (on average).

So if we have 12 successes in the first 20 experiments, we need another 11 or 12 successes in the second set of experiments to reach or exceed our threshold of 23. This is fairly unlikely. If successes happen by random chance alone, then we will get 11 or 12 with probability 0.0032 (about 3 times in 1,000). If we have 13 successes in the first 20 experiments, then we need 10 or more successes in our second set to reach or exceed our threshold. This will happen by random chance alone with probability 0.019 (about 19 times in 1,000). Although it is an additively huge difference, 0.01 vs 0.019, the probability of exceeding our threshold has almost doubled. And it gets worse. If we had 14 successes, then the probability “jumps” to 0.073 — over seven times higher. It is tempting to think that this occurs because the second set of trials is smaller than the first. However, the phenomenon exists then as well.

The issue exists because the probability distribution for all of the results of experiments considered together is not the same as the probability distribution for results of the second set of experiments given we know the results of the first set of experiment. You might think about this as being like a horse race where you are allowed to make your bet after the horses have reached the half way mark — you already have some information (which might be totally spurious) but most people will bet differently, using the information they have, than they would at the start of the race.

January 21, 2016

Meet Statistics summer scholar David Chan

David ChanEvery summer, the Department of Statistics offers scholarships to a number of students so they can work with staff on real-world projects. David, right, is working on the New Zealand General Social Survey 2014 with Professor Thomas Lumley and Associate Professor Brian McArdle of Statistics, and  Senior Research Fellow Roy Lay-Yee and Professor Peter Davis from COMPASS, the Centre of Methods and Policy Application in the Social Sciences. David explains:
“My project involves exploring the social network data collected by the New Zealand General Social Survey 2014, which measures well-being and is the country’s biggest social survey outside the five-yearly census. I am essentially profiling each respondent’s social network, and then I’ll investigate the relationships between a person’s social network and their well-being.

“Measurements of well-being include socio-economic status, emotional and physical health, and overall life satisfaction. I intend to explore whether there is a link between social networks and well-being. I’ll then identify what kinds of people make a social network successful and how they influence a respondent’s well-being.

“I have just completed a conjoint Bachelor of Music and Bachelor of Science, majoring in composition and statistics respectively.  When I started my conjoint, I wasn’t too sure why statistics appealed to me. But I know now – statistics appeals to me because of its analytical nature to solving both theoretical and real-life problems.

“This summer, I’m planning to hang out with my friends and family. I’m planning to work on a small music project as well.”


January 18, 2016

The buck needs to stop somewhere

From Vox:

Academic press offices are known to overhype their own research. But the University of Maryland recently took this to appalling new heights — trumpeting an incredibly shoddy study on chocolate milk and concussions that happened to benefit a corporate partner.

Press offices get targeted when this sort of thing happens because they are a necessary link in the chain of hype.  On the other hand, unlike journalists and researchers, their job description doesn’t involve being skeptical about research.

For those who haven’t kept up with the story: the research is looking at chocolate milk produced by a sponsor of the study, compared to other sports drinks. The press release is based on preliminary unpublished data. The drink is fat-free, but contains as much sugar as Coca-Cola. And the press release also says

“There is nothing more important than protecting our student-athletes,” said Clayton Wilcox, superintendent of Washington County Public Schools. “Now that we understand the findings of this study, we are determined to provide Fifth Quarter Fresh to all of our athletes.”

which seems to have got ahead of the evidence rather.

This is exactly the sort of story that’s very unlikely to be the press office’s fault. Either the researchers or someone in management at the university must have decided to put out a press release on preliminary data and to push the product to the local school district. Presumably it was the same people who decided to do a press release on preliminary data from an earlier study in May — data that are still unpublished.

In this example the journalists have done fairly well: Google News shows that coverage of the chocolate milk brand is almost entirely negative.  More generally, though, there’s the problem that academics aren’t always responsible for how their research is spun, and as a result they always have an excuse.

A step in the right direction would be to have all research press releases explicitly endorsed by someone. If that person is a responsible member of the research team, you know who to blame. If it’s just a publicist, well, that tells you something too.

November 13, 2015

Blood pressure experiments

The two major US medical journals each published  a report this week about an experiment on healthy humans involving blood pressure.

One of these was a serious multi-year, multi-million-dollar clinical trial in over 9000 people, trying to refine the treatment of high blood pressure. The other looks like a borderline-ethical publicity stunt.  Guess which one ended up in Stuff.

In the experiment, 25 people were given an energy drink

We hypothesized that drinking a commercially available energy drink compared with a placebo drink increases blood pressure and heart rate in healthy adults at rest and in response to mental and physical stress (primary outcomes). Furthermore, we hypothesized that these hemodynamic changes are associated with sympathetic activation, which could predispose to increased cardiovascular risk (secondary outcomes).

The result was that consuming caffeine made blood pressure and heart rate go up for a short period,  and that levels of the hormone norepinephrine  in the blood also went up. Oh, and that consuming caffeine led to more caffeine in the bloodstream than consuming no caffeine.

The findings about blood pressure, heart rate, and norepinephrine are about as surprising as the finding about caffeine in the blood. If you do a Google search on “caffeine blood pressure”, the recommendation box at the top of the results is advice from the Mayo Clinic. It begins

Caffeine can cause a short, but dramatic increase in your blood pressure, even if you don’t have high blood pressure.

The Mayo Clinic, incidentally, is where the new experiment was done.

I looked at the PubMed research database for research on caffeine and blood pressure.  The oldest paper in English for which I could get full text was from 1981. It begins

Acute caffeine in subjects who do not normally ingest methylxanthines leads to increases in blood pressure, heart rate, plasma epinephrine, plasma norepinephrine, plasma renin activity, and urinary catecholamines.

This wasn’t news already in 1981.

Now, I don’t actually like energy drinks; I prefer my caffeine hot and bitter.  Since many energy drinks have as much caffeine as good coffee and some have almost as much sugar as apple juice, there’s probably some unsafe level of consumption, especially for kids.

What I don’t like is dressing this up as new science. The acute effects of caffeine on the cardiovascular system have been known for a long time. It seems strange to do a new human experiment just to demonstrate them again. In particular, it seems ethically dubious if you think these effects are dangerous enough to put out a press release about.


September 30, 2015

Three strikes: some evidence (updated)

Update: the data Graeme Edgeler was given didn’t mean what he (reasonably) thought they meant and this analysis is no longer operative. There isn’t good evidence that the law has any substantial beneficial effect.  See Nikki Macdonald’s story at Stuff and Graeme’s own post at Public Address.

The usual objection to a “three-strikes” law imposing life sentences without parole, in addition to the objections against severe mandatory minimums, is

  • It doesn’t work; or
  • It doesn’t work well enough given the injustice involved; or
  • There isn’t good enough evidence that it works well enough given the potential for injustice involved.

New Zealand’s version of the law is much less bad than the US versions, but there are still both real problems, and theoretical problems (robbery and aggravated burglary both include crimes of a wide range of severity).

Graeme Edgeler (who is not an enthusiast for the law) has a post at Public Address arguing that there is, at least, evidence of a reduction in subsequent offending by people who receive a first-strike warning, based a mixture of published data and OIA requests.

Here’s his data in tabular form, showing second convictions for offences that would qualify under the three-strikes law. The red cell is ‘first strike’ convictions, the other rows did not count as strikes because the law isn’t retrospective.

Offence Conviction Number Second conviction Number
7/05-6/10 7/05-6/10 6809 7/05-6/10 256
Before 7/10 7/10-6/15 2437 7/10-1/15 300
7/10-6/15 7/10-6/15 5422 7/10-6/15 81


The first and last rows are directly comparable five-year periods. Offences that now qualify as ‘strikes’ are down 20% in the last five-year period; second convictions are down a further 62%. Data in the middle row isn’t as comparable, but there is at least no apparent support for a general reduction in reoffending in the last five-year period.

The overall 20% decrease could easily be explained as part of the long-term trends in crime, but the extra decrease in second-strike offences can’t be.  It’s also much larger than could be expected from random variation. The law isn’t keeping violent criminals off the streets, but it does seem to be deterring second offences.

Reasonable people could still oppose the three-strikes law (and Graeme does) but unless we have testable alternative explanations for the large, selective decrease, we should probably be looking at arguments that the law is wrong in principle, not that it’s ineffective.


August 17, 2015

How would you even study that?

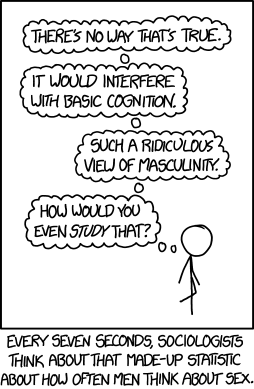
From XKCD

every_seven_seconds

“How would you even study that?” is an excellent question to ask when you see a surprising statistic in the media. Often the answer is “they didn’t,” but sometimes you get to find out about some really clever research technique.

August 5, 2015

What’s in a browser language default?

Ok, so this is from Saturday and I hadn’t seen it until this morning, so perhaps it should just be left in obscurity, but:

Claims foreign buyers are increasingly snapping up Auckland houses have been further debunked, with data indicating only a fraction of visitors to a popular real estate website are Asian.

Figures released by website realestate.co.nz reveal about five per cent of all online traffic viewing Auckland property between January and April were primary speakers of an East Asian language.

Of that five per cent, only 2.8 per cent originated from outside New Zealand meaning almost half were viewing from within the country.

The problem with Labour’s analysis was that it conflated “Chinese ethnicity” and “foreign”, but at least everyone on the list had actually bought a house in Auckland, and they captured about half the purchases over a defined time period. It couldn’t say much about “foreign”, but it was at least fairly reliable on “Chinese ethnicity” and “real-estate buyer”.

This new “debunking” uses data from a real-estate website. There is no information given either about what fraction of house buyers in Auckland used the website, or about what fraction of people who used the website ended up buying a house rather than just browsing, (or about how many people have their browser’s language preferences set up correctly, since that’s what was actually measured).  Even if realestate.co.nz captured the majority of NZ real-estate buyers, it would hardly be surprising if overseas investors who primarily prefer to use non-English websites used something different.  What’s worse, if you read carefully, is they say “online traffic”: these aren’t even counts of actual people.

So far, the follow-up data sets have been even worse than Labour’s original effort. Learning more would require knowing actual residence for actual buyers of actual Auckland houses: either a large fraction over some time period or a representative sample.  Otherwise, if you have a dataset lying around that could be analysed to say something vaguely connected to the number of overseas Chinese real-estate buyers in Auckland, you might consider keeping it to yourself.