Posts filed under Estimation (34)

October 10, 2013

Innovation and indexes

The 2013 Global Innovation Index is out, with writeups in Scientific American and the NZ internets, but not this year in the NZ press. Stuff, instead, tells us “Low worker engagement holds NZ back”, quoting Gallup’s ’employee engagement’ figure of 23% for NZ, without much attempt to compare to other countries.

The two international rankings are very different: of the 16 countries above us in the Global Innovation Index, 13 have significantly lower employee engagement ratings, one (Denmark) is about the same, and one (USA) is higher (one, Hong Kong, is missing because Gallup lumps it in with the rest of the PRC).  It’s also important to consider what is behind these ratings. If you search on  “Gallup employee engagement”, you get results mostly focused on Gallup’s consulting services — getting you to worry about employee engagement is one of the ways they make money.  The Global Innovation Index, on the other hand, came from a business school and was initially sponsored by the Confederation of Indian Industry  and has now expanded with wider sponsorship and academic involvement: it’s not biased in any way that’s obviously relevant to New Zealand.

With any complicated scoring system, different countries will do well on different components of the score.  If you believe, with the authors of Why Nations Fail,  that quality of institutions is the most important factor, you might focus on the “Institutions” component of the innovation index, where New Zealand is in third place. If you’re AMP econonomist Bevan Graham you might think the ‘business sophistication’ component is more important and note that NZ falls to 28th.

If you want NZ innovation to improve, the reverse approach might be more helpful: look at where NZ ranks poorly, and see if these are things we want to change (innovation isn’t everything) and how we might change them.


October 9, 2013

Prediction is hard

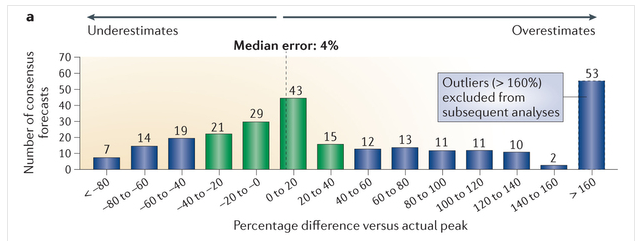
How good are sales predictions for newly approved drugs?

Not very (via Derek Lowe at  In the Pipeline)

Forecasts

There’s a wide spread around the true value. There’s less than a 50:50 chance of being within 40%, and a substantial chance of being insanely overoptimistic. Derek Lowe continues

Now, those numbers are all derived from forecasts in the year before the drugs launched. But surely things get better once the products got out into the market? Well, there was a trend for lower errors, certainly, but the forecasts were still (for example) off by 40% five years after the launch. The authors also say that forecasts for later drugs in a particular class were no more accurate than the ones for the first-in-class compounds. All of this really, really makes a person want to ask if all that time and effort that goes into this process is doing anyone any good at all.


August 16, 2013

Collateral damage

There’s a long tradition in law and ethics of thinking about how much harm to the innocent should be permitted in judicial procedures, and at what cost. The decision involves both uncertainty, since any judicial process will make mistakes, and consideration of what the tradeoffs would be in the absence of uncertainty. An old example of the latter is the story of Abraham bargaining with God over how many righteous people there would have to be in the notorious city of Sodom to save it from destruction, from a starting point of 50 down to a final offer of 10.

With the proposed new child protection laws, though, the arguments have mostly been about the uncertainty.  The bills have not been released yet, but Paula Bennett says they will provide for protection orders keeping people away from children, to be imposed by judges not only on those convicted of child abuse but also ‘on the balance of probabilities’ for some people suspected of being a serious risk.

We’ve had two stat-of-the-week nominations for a blog post about this topic (arguably not ‘in the NZ media’, but we’ll leave that for the competition moderator). The question at issue is how many innocent people would end up under child protection orders if 80 orders were imposed each year.

The ‘balance of probabilities’ standard theoretically says that an order can be imposed (?must be imposed) if the probability of being a serious risk is more than 50%.  The probability could be much higher than 50% — for example, if you were asked to decide on the balance of probabilities which of your friends are male, you will usually also be certain beyond reasonable doubt for most of them.  On the other hand, there wouldn’t be any point to the legislation unless it is applied mostly to people for whom the evidence isn’t good enough even to attempt prosecution under current law, so the typical probabilities shouldn’t be that high.

Even if we knew the distribution of probabilities, we still don’t have enough information to know how many innocent people will be subject to orders. The probability threshold here is the personal partly-subjective uncertainty of the judge, so even if we had an exact probability we’d only know how many innocent people the judge thought would be affected, and there’s no guarantee that judges have well-calibrated subjective probabilities on this topic.

In fact, the judicial system usually rules out statistical prior information about how likely different broad groups of people are to be guilty, so the judge may well be using a probability distribution that is deliberately mis-calibrated.  In particular, the judicial system is (for very good but non-statistical reasons) very resistant to using as evidence the fact that someone has been charged, even though people who have been charged are statistically much more likely to be guilty than random members of the population.

At one extreme, if the police were always right when they suspected people, everyone who turned up in court with any significant evidence against them would be guilty.  Even if the evidence was only up to the balance of probabilities standard, it would then turn out that no innocent people would be subject to the orders. That’s the impression that Ms Bennett seems to be trying to give — that it’s just the rules of evidence, not any real doubt about guilt.  At the other extreme, if the police were just hauling in random people off the street, nearly everyone who looked guilty on the balance of probabilities might actually just be a victim of coincidence and circumstance.

So, there really isn’t an a priori mathematical answer to the question of how many innocent people will be affected, and there isn’t going to be a good way to estimate it afterwards either. It will be somewhere between 0% and 100% of the orders that are imposed, and reasonable people with different beliefs about the police and the courts can have different expectations.
July 31, 2013

It depends on how you look at it

Collapsing lots of variables into a single ‘goodness’ score always involves choices about how to weight different information; there isn’t a well-defined and objective answer to questions like “what’s the best rugby team in the world?” or “what’s the best university in the world?”.  And if you put together a ranking of rugby teams and ended up with Samoa at the top and the All Blacks well down the list, you might want to reconsider your scoring system.

On the other hand, it’s not a good look if you make a big deal of holding failing schools accountable and then reorder your scoring system to move a school from “C” to “A”. Especially when it’s a charter school founded by a major donor to the governing political party.

Emails obtained by The Associated Press show Bennett and his staff scrambled last fall to ensure influential donor Christel DeHaan’s school received an “A,” despite poor test scores in algebra that initially earned it a “C.”

“They need to understand that anything less than an A for Christel House compromises all of our accountability work,” Bennett wrote in a Sept. 12 email to then-chief of staff Heather Neal, who is now Gov. Mike Pence’s chief lobbyist.


July 13, 2013

Visualising the Bechdel test

The Bechdel Test classifies movies according to whether they have two female characters, who at some point talk to each other, about something other than a man.

It’s not that all movies should pass the test — for example, a movie with a tight first-person viewpoint is unlikely to pass the test if the viewpoint character is male, and no-one’s saying such movies should not exist.  The point of the test is that surprisingly few movies pass it.

At Ten Chocolate Sundaes there’s an interesting statistical analysis of movies over time and by genre, looking at the proportion that pass the test.  The proportion seems to have gone down over time, though it’s been pretty stable in recent years.

June 9, 2013

What the NSA can’t do by data mining

In the Herald, in late May, there was a commentary on the importance of freeing-up the GCSB to do more surveillance. Aaron Lim wrote

The recent bombings at the Boston Marathon are a vivid example of the fragmented nature of modern warfare, and changes to the GCSB legislation are a necessary safeguard against a similar incident in New Zealand.

 …

Ceding a measure of privacy to our intelligence agencies is a small price to pay for safe-guarding the country against a low-probability but high-impact domestic incident.

Unfortunately for him, it took only a couple of weeks for this to be proved wrong: in the US, vastly more information was being routinely collected, and it did nothing to prevent the Boston bombing.  Why not?  The NSA and FBI have huge resources and talented and dedicated staff, and have managed to hook into a vast array of internet sites. Why couldn’t they stop the Tsarnaevs, or the Undabomber, or other threats?

The statistical problem is that terrorism is very rare.  The IRD can catch tax evaders, because their accounts look like the accounts of many known tax evaders, and because even a moderate rate of detection will help deter evasion.  The banks can catch credit-card fraud, because the patterns of card use look like the patterns of card use in many known fraud cases, and because even a moderate rate of detection will help deter fraud.  Doctors can predict heart disease, because the patterns of risk factors and biochemical meausurements match those of many known heart attacks, and because even a moderate level of accuracy allows for useful gains in public health.

The NSA just doesn’t have that large a sample of terrorists to work with.  As the FBI pointed out after the Boston bombing, lots of people don’t like the United States, and there’s nothing illegal about that.  Very few of them end up attempting to kill lots of people, and it is so rare that there aren’t good patterns to match against.   It’s quite likely that the NSA can do some useful things with the information, but it clearly can’t stop `low-probability, high-impact domestic incidents’, because it doesn’t.  The GCSB is even more limited, because it’s unlikely to be able to convince major US internet firms to hand over data or the private keys needed to break https security.

Aaron Lim’s piece ended with the typical surveillance cliche

And if you have nothing to hide from the GCSB, then you have nothing to fear

Computer security expert Bruce Schneier has written about this one extensively, so I’ll just add that if you believe that, you can easily deduce Kristofferson’s Corollary

Freedom’s just another word for nothing left to lose.

May 16, 2013

Back to my favourite topic – beer

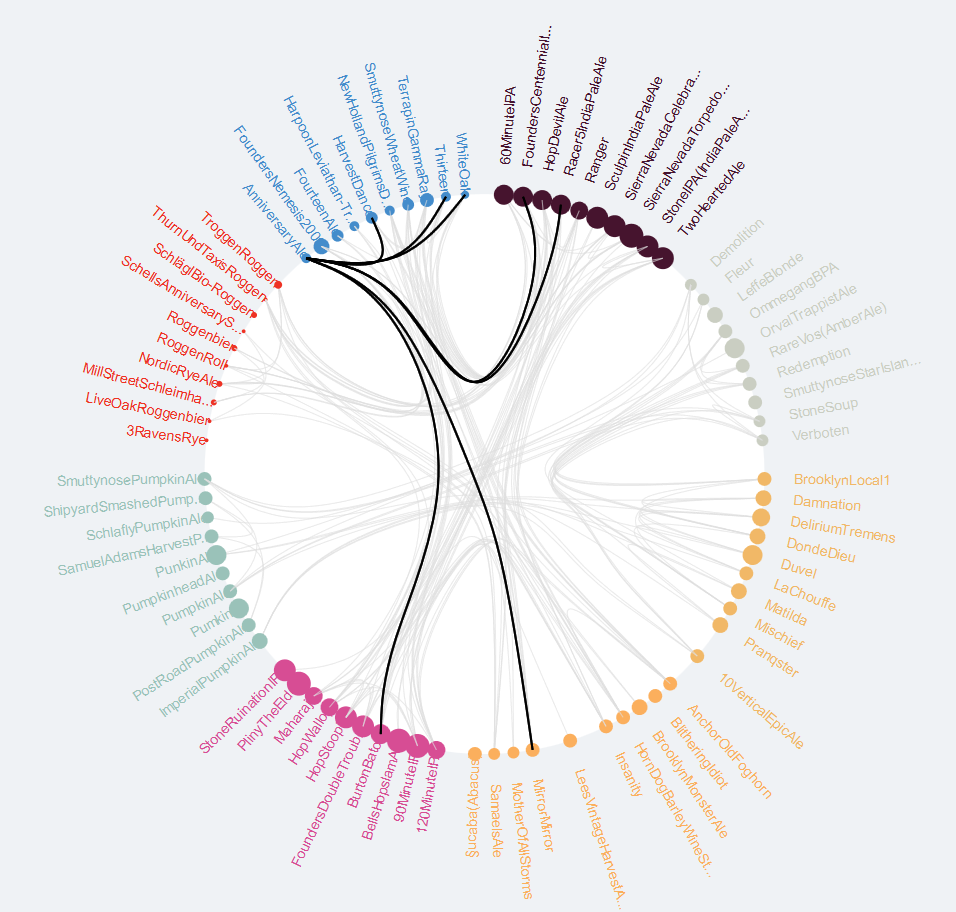
BeerVis Graph

Here is a site to show with a flourish when your friends tell you at the pub that studying Statistics is no use. LifeHacker reports that BeerViz attempts to use historical data collected by BeerAdvocate, and presumably a statistical model, to suggest new beers to you based on what you already like. If they’re not using a statistical model then there is a great challenge for you loyal readers!

April 8, 2013

Briefly

  • Interesting post on how extreme income inequality is. The distribution is compared to a specific probability model, a ‘power law’, with the distribution of earthquake sizes given as another example. Unfortunately, although the ‘long tail’ point is valid, the ‘power law’ explanation is more dubious.   Earthquake sizes and wealth are two of the large number of empirical examples studied by Aaron Clauset, Cosma Shalizi, and Mark Newman, who find the power law completely fails to fit the distribution of wealth, and is not all that persuasive for earthquake sizes. As Cosma writes

If you use sensible, heavy-tailed alternative distributions, like the log-normal or the Weibull (stretched exponential), you will find that it is often very, very hard to rule them out. In the two dozen data sets we looked at, all chosen because people had claimed they followed power laws, the log-normal’s fit was almost always competitive with the power law, usually insignificantly better and sometimes substantially better. (To repeat a joke: Gauss is not mocked.)


April 1, 2013

Briefly

Despite the date, this is not in any way an April Fools post

  • “Data is not killing creativity, it’s just changing how we tell stories”, from Techcrunch
  • Turning free-form text into journalism: Jacob Harris writes about an investigation into food recalls (nested HTML tables are not an open data format either)
  • Green labels look healthier than red labels, from the Washington Post. When I see this sort of research I imagine the marketing experts thinking “how cute, they figured that one out after only four years”
  • Frances Woolley debunks the recent stories about how Facebook likes reveal your sexual orientation (with comments from me).  It’s amazing how little you get from the quoted 88% accuracy, even if you pretend the input data are meaningful.  There are some measures of accuracy that you shouldn’t be allowed to use in press releases.
March 29, 2013

Unclear on the concept: average time to event

One of our current Stat of the Week nominations is a story on Stuff claiming that criminals sentenced to preventive detention are being freed after an average of ‘only’ 11 years.

There’s a widely-linked story in the Guardian claiming that the average time until Google kills new services is 1459 days, based on services that have been cancelled in the past.  The story even goes on to say that more recent services have been cancelled more quickly.

As far as I know, no-one has yet produced a headline saying that the average life expectancy  for people born in the 21st century is only about 5 years, but the error in reasoning would be the same.

In all three cases, we’re interested in the average time until some event happens, but our data are incomplete, because the event hasn’t happened for everyone.  Some Google services are still running; some preventive-detention cases are still in prison; some people born this century are still alive.  A little thought reveals that the events which have occurred are a biased sample: they are likely to be the earliest events.   The 21st century kids who will live to 90 are still alive; those who have already died are not representative.

In medical statistics, the proper handling of times to death, to recurrence, or to recovery is a routine problem.  It’s still not possible to learn as much as you’d like without assumptions that are often unreasonable. The most powerful assumption you can make is that the rate of events is constant over time, in which case the life expectancy is the total observed time divided by the total number of events — you need to count all the observed time, even for the events that haven’t happened yet.  That is, to estimate the survival time for Google services, you add up all the time that all the Google services have operated, and divide by the number that have been cancelled.  People in the cricket-playing world will recognise this as the computation used for batting averages: total number of runs scored, divided by total number of times out.

The simple estimator is often biased, since the risk of an event may increase or decrease with time.  A new Google service might be more at risk than an established one; a prisoner detained for many years might be less likely to be released than a more recent convict.  Even so, using it distinguishes people who have paid some attention to the survivors from those who haven’t.

I can’t be bothered chasing down the history of all the Google services, but if we add in search (from 1997),  Adwords (from 2000), image search (2001), news (2002),  Maps, Analytics, Scholar, Talk, and Transit (2005), and count Gmail only from when it became open to all in 2007, we increase the estimated life expectancy for a Google service from the 4 years quoted in the Guardian to about 6.5 years.  Adding in other still-live services can only increase this number.

For a serious question such as the distribution of time in preventive detention you would need to consider trends over time, and differences between criminals, and the simple constant-rate model would not be appropriate.  You’d need a bit more data, unless what you wanted was just a headline.