Posts filed under Education (86)

October 5, 2012

What happened when MPs took a maths exam

This just in from the BBC:

Could it be that Labour leader Ed Miliband’s demand that all school pupils must study maths until they are 18 has been prompted by new evidence that his own MPs struggle with numbers?

The man in charge of the party’s policy review, Jon Cruddas, admitted this weekend that he is “barely numerate”. And when the Royal Statistical Society (RSS) recently tested the ability of honourable members to answer a relatively simple mathematical question, only a quarter of Labour MPs got it right.

Read the rest of the yarn here.

October 1, 2012

Worthless degrees

The Herald, overcoming its dislike of education league tables,  says that NZ degrees are the most worthless in the developed world

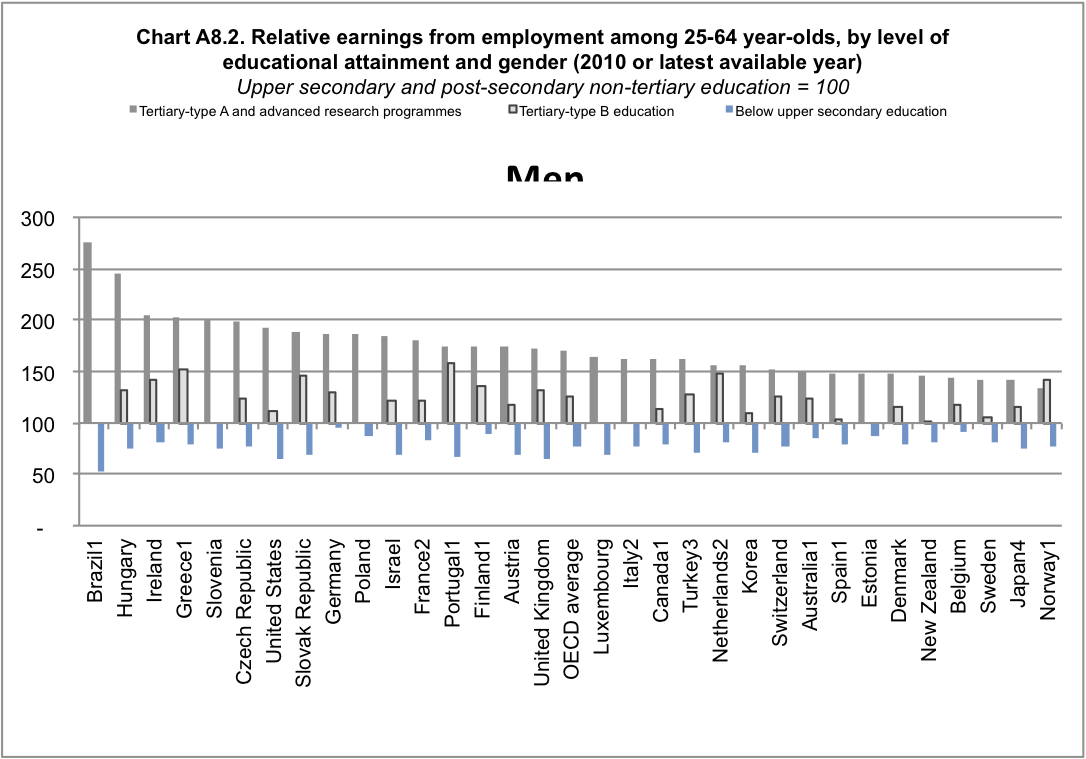
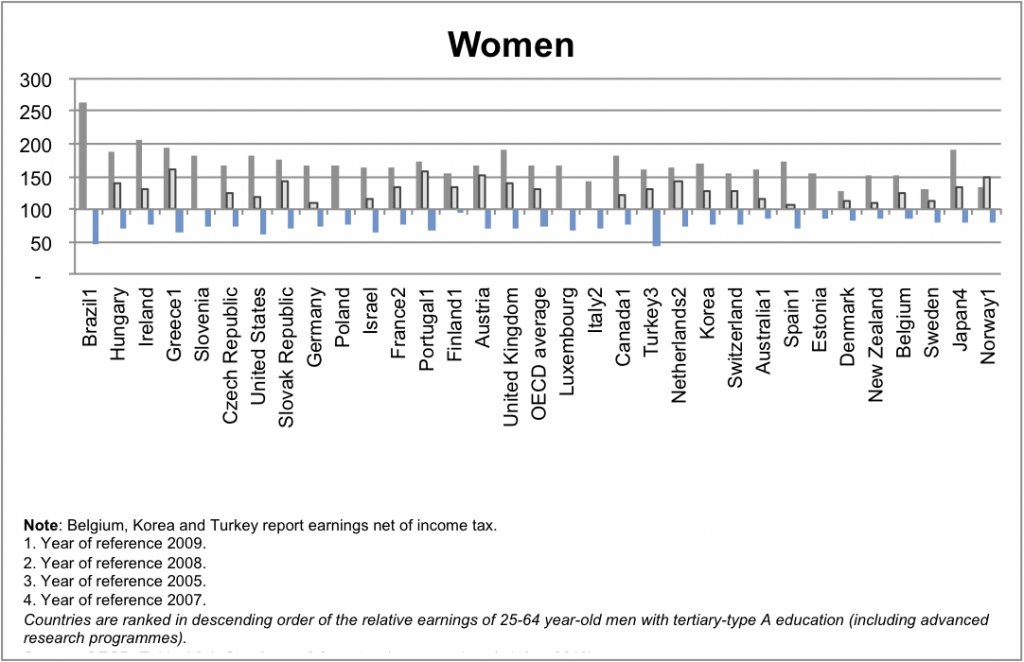
New Zealand is at the bottom of the global league tables. The net value of a man’s tertiary education is just $63,000 over his working life, compared with $395,000 in the US. For a Kiwi woman, it’s $38,000 over her working life.

They don’t actually say what OECD report they looked at, but if you go to the OECD Directorate for Education and look at the most recent report, you can get these graphs (click to embiggen)


From the graphs, it’s fairly clear that for ‘Tertiary type-A and advanced research” degrees, NZ is not in fact at the bottom, but people with “Tertiary B-type” degrees do not seem to have any difference in income from those without degrees.  So what are these types: Type A is

Largely theory-based programmes designed to provide sufficient qualifications for entry to advanced research programmes and professions with high skill requirements, such as medicine, dentistry or architecture. Duration at least three years full-time, though usually four or more years

and Type B is

Programmes are typically shorter than those of tertiary-type A and focus on practical, technical or occupational skills for direct entry into the labour market, although some theoretical foundations may be covered in the respective programmes. They have a minimum duration of two years full-time equivalent at the tertiary level.

So, people with traditional university degrees do earn more in NZ, but people with other tertiary qualifications may well not.  It’s also important to remember that these are people in NZ with these degrees: the earnings of Kiwis who migrate overseas are not counted, but the degrees of migrants to NZ are counted even if they aren’t really recognised here.


The other interesting thing about the graph is who else is at the low end: Norway is at the bottom, Sweden and Denmark are both low.  It’s useful to think about the reasons that people with university degree might have higher incomes

  • Specific training: your degree gives you skills and knowledge that are helpful in your specific occupation
  • General training: a degree gives you transferable skills that are helpful in many occupations
  • Signalling: completing a degree shows employers that you can complete a degree
  • Stratification: higher education is a way for the wealthy to perpetuate their advantages through hiring ‘people like us’ for good  jobs

The first two of these are beneficial to the individual and to society as a whole.  The third may be beneficial to the individual, but not to society as a whole, and the fourth is actively harmful.  Among developed countries, those with low social mobility (such as the UK and the USA) have larger differences in income between those with and without degrees than those with higher social mobility (such as the Scandinavian countries).

This context sheds a different light on one of the comments quoted by the Herald

Employers and Manufacturers Association boss Kim Campbell agreed. People at the top in business weren’t paid anything near what counterparts overseas were getting because we didn’t have the big companies that paid top dollar.

A top-level executive in New Zealand would be lucky to get 10 times the entry-level pay rate, he said. In the US, it was not uncommon to get 200 times that level.

You don’t have to be a raving lefty to be dubious about this as an argument in favour of the US system.
September 28, 2012

DIY statistics

From a Herald editorial

There is much intolerance of any use of this “ropey” information. A high priesthood of data analysis bemoans news media interest, however hedged with caveats, as betraying the apple in favour of the orange. Yet the combined “wisdom of the crowd” of thousands of schools and teachers, warts and all, does suggest, for example, fewer children meet standards in writing nationally than reading or mathematics.

I, like many people, was against the use of the data for league tables, though I thought it was probably inevitable.  But if the high priesthood of data analysis has issued any edicts on analysis of the data, they forgot to copy me on the email. Perhaps it’s because I wasn’t wearing the high priestly hat.

At StatsChat we’re in favour of more people doing DIY statistics, which is why we keep linking to data sources when newspapers don’t provide them.  As with any form of DIY, though, the results will be better if you have the right materials for the job at hand.

For any given set of data there are some questions that obviously can be answered (do fewer kids meet the writing standards?), and some that obviously can’t (are the writing standards just harder?).   There are also many questions where the results will be unclear because it’s not possible to reliably separate out the huge socioeconomic effects.  For example, it looks as though Maori children perform worse than non-minority children even within the same decile, but ‘within the same decile’ is a pretty broad range of schools, and the conclusion has to be pretty weak.

September 26, 2012

Teaching statistics

I haven’t had the time or energy to do any analyses of the National Standards data, but other statistical bloggers haven’t had the same problem.

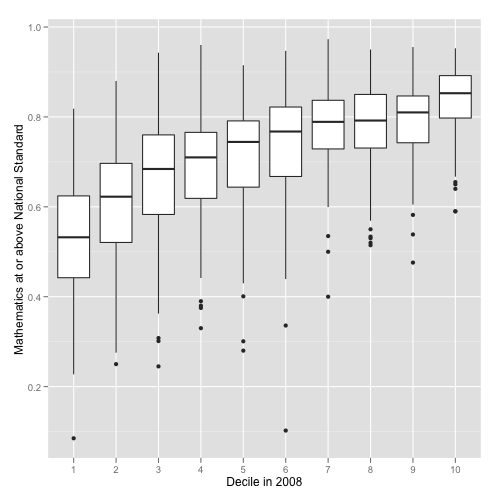
Luis Apiolaza has some dramatic graphics, such as this one showing the distribution of proportion achieving at or above the maths standard, by decile.  The top decile 1 school is below the median for deciles 9 and 10, and the upper quartile for decile 1 is about the same as the lower quartile for decile 4.

Eric Crampton has been doing regression modelling. He’s using Stata rather than R and has fewer pictures, because he’s an economist (but we like him anyway).

Eric comments on the strong decile differences, and notes that these make it hard to be confident about ethnic differences (schools with more Maori and Pacific students do worse, but on reading and perhaps on writing so do schools with more Asian students).  He also notes that there’s a lot of variation between schools that isn’t explained by the available socioeconomic data.  I’d be interested to know how much of this is random variation based on the limited number of students per school and how much is real variation that could be explained but isn’t.

Both Eric and Luis have put their data files and code where anyone else can easily get them, and they have left the data in much better shape than they found them, for the benefit of anyone else who might want to do some analysis.

August 23, 2012

Stat-related startups

At Simply Statistics, a set of stat/data related startups.

One that looks interesting for teaching and for data journalism purposes is Statwing, which is building a web-based pointy-clicky data analysis system, aiming to have good graphics and good text descriptions of the results.  This is the sort of project where the details will matter a lot — poking around at their demo there were a few things I was slightly unhappy about, but nothing devastatingly bad, so there is potential.

July 13, 2012

Our new robot overlords

Since I regularly complain about the lack of randomised trials in education, I really have to mention a recent US study.  At six public universities in the US, introductory statistics students who consented were randomised between the usual sort of teaching by real live instructors or a format with one hour per week of face-to-face instruction augmented by independent computer-guided instruction.  Within each campus, the students were assessed in the same way regardless of their instruction method, and across all campuses they also took a standardised test of statistics competence.   Statistics is a good target for this sort of experiment, because it is a widely required course, and the median introductory statistics course is not very good.

The results were interesting.  The students using the hybrid computer-guided approach found the course less interesting than those with live instructors, but their performance in the course and in the standardised tests was the same.   If you ignore the cost of developing the software (which in this case already existed), the computer-guided approach would allow more students to be taught by the same number of instructors, saving money in the long run.

This doesn’t mean instructors are obsolete — people like face-to-face classes, and we do actually care if students end up interested in statistics –but it does mean that we need to think about the most efficient ways to use class contact time.  There’s an old joke about lectures as a method of transferring information from the lecturer’s notes into the students’ notebooks without it passing through the brains of either.  We’ve got the internet for that, now.

June 21, 2012

If it’s not worth doing, it’s not worth doing well?

League tables work well in sports.  The way the competition is defined means that ‘games won’ really is the dominant factor in ordering teams,  it matters who is at the top, and people don’t try to use the table for inappropriate purposes such as deciding which team to support.  For schools and hospitals, not so much.

The main problems with league tables for schools (as proposed in NZ) or hospitals (as implemented in the UK) are, first, that a ranking requires you to choose a way of collapsing multidimensional information into a rank, and second, that there is usually massive uncertainty in the ranking, which is hard to convey.   There doesn’t have to be one school in NZ that is better than all the others, but there does have to be one school at the top of the table.  None of this is new: we have looked at the problems of collapsing multidimensional information before, with rankings of US law schools, and the uncertainty problem with rates of bowel cancer across UK local government areas.

This isn’t to say that school performance data shouldn’t be used.  Reporting back to schools how they are doing, and how it compares to other similar schools, is valuable.  My first professional software development project (for my mother) was writing a program (in BASIC, driving an Epson dot-matrix printer) to automate the reports to hospitals from the Victorian Perinatal Data Collection Unit.  The idea was to give each hospital the statewide box plots of risk factors (teenagers, no ante-natal care), adverse outcomes (deaths, preterm births, malformations), and interventions (induction of labor, caesarean section), with their own data highlighted by a line.   Many of the adverse outcomes were not the hospital’s fault, and many of the interventions could be either positive or negative depending on the circumstances, so collapsing to a single ‘hospital quality’ score would be silly, but it was still useful for hospitals to know how they compare.  In that case the data was sent only to the hospital, but for school data there’s a good argument for making it public.

While it’s easy to see why teachers might be suspicious of the government’s intentions, the rationale given by John Key for exploring some form of official league table is sensible.  It’s definitely better not to have a simple ranking, and it might arguably be better not to have a set of official comparative reports, but the data are available under the Official Information Act.  The media may currently be shocked and appalled at the idea of league tables, but does anyone really believe this would stop a plague of incomplete, badly-analyzed, sensationally-reported exposés of “New Zealand’s Worst Schools!!”?  It would be much better for the Department of Education to produce useful summaries, preferably not including a league-table ranking, as a prophylactic measure.

May 6, 2012

Ranking universities

With the PBRF research assessments happening this year, there is sure to be another round next year of universities using the results in creative ways to make themselves look good.  When you have a large number of variables to take into account, it’s easy to come up with apparently-reasonable weightings that make one institution look better than another.

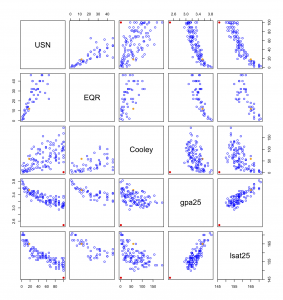
A dramatic example of this is ratings of US law schools.  The most widely-known rankings are from US News, and there’s another popular set from Brian Leiter, a professor at University of Texas, which aims to focus only on quality of education.  A third set is published by the slightly unusual Thomas J. Cooley School of Law.    There is definitely correlation in the top rankings: for example, Harvard tops the Cooley rankings and is second for the other two.   The graph below (click to embiggen) shows the three rankings and the lower quartile of GPA and LSAT results for some top colleges (I got the data from here, and added the Cooley rankings by hand)

You were wondering perhaps about the two colored dots?

The orange dot is University of Texas, Prof. Leiter’s employer.  His ranking for his own school is between the other two rankings.  The red dot is Thomas J. Cooley law school.  The US News rankings don’t  include them in the top 100 (they don’t quantify past the first 100), but their own ranking makes them second in the US, behind only Harvard.


April 9, 2012

The future needs statisticians

The current issue of the journal Science has an editorial on the importance of statistics, and on the increased demand for statisticians in the `Big Data’ future.  The writers, Marie Davidian and Tom Louis, call out the need for increased funding in graduate programs — it hasn’t kept up with inflation, let alone with demand.

They also note

The future demands that scientists, policy-makers, and the public be able to interpret increasingly complex information and recognize both the benefi ts and pitfalls of statistical analysis. It is a good sign that the new U.S. Common Core K-12 Mathematics Standards introduce statistics as a key component in precollege education, requiring that students be skilled in describing data, developing statistical models,making inferences, and evaluating the consequences of decisions.

Here, at least, New Zealand is ahead of the game.

February 20, 2012

Stats crimes – we need your help

What do you think are the biggest media/public misunderstandings around statistics? We know that some statistical concepts can be quite hard to understand (and a bit of a challenge to teach); we’d like to compile a list of the top stats misunderstandings so we can accurately focus some media education projects we are planning ….

Some examples that have already been raised:

  • Misunderstanding correlation and causality: All too often causality will be assigned where a study has merely shown a link between two variables.
  • Abuse/misuse of the term “potentially fatal”: While many activities/diseases could possibly result in death, the odds should be considered in the context of a developed country with reasonable health-care.
  • How to know when something is statistically significant and when not.
  •  How to know when you are looking at  “junk” statistics …

Please share your ideas below …