Posts filed under Education (86)

May 12, 2014

Resources in education

Attention conservation notice: I have to write this post because I’ve spent too much time on it otherwise. You don’t have to read it.

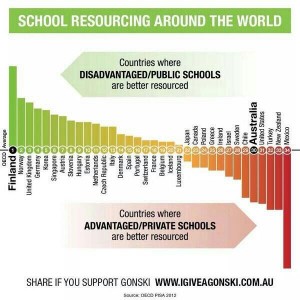
There was an episode of “Yes, Prime Minister” where the term “Human Resource Rich Countries” was being posed as a replacement for “Less Developed Countries”, meaning “poor”. “Resources” is a word that can mean lots of different things, which is why I spent more time than was strictly sensible investigating the following graph

Bm2xm_8CcAAAcK1


The graph appeared in my Twitter feed last Monday. It’s originally from a campaign to give Australia a school funding model a bit more like NZ’s decile system, as recommended by a national review panel, so it is disturbing to see New Zealand almost at the bottom of the world.

(more…)

May 3, 2014

White House report: ‘Big Data’

There’s a new report “Big Data: Seizing Opportunities, Preserving Values” from the Office of the President (of the USA).  Here’s part of the conclusion (there are detailed recommendations as well)

Big data tools offer astonishing and powerful opportunities to unlock previously inaccessible insights from new and existing data sets. Big data can fuel developments and discoveries in health care and education, in agriculture and energy use, and in how businesses organize their supply chains and monitor their equipment. Big data holds the potential to streamline the provision of public services, increase the efficient use of taxpayer dollars at every level of government, and substantially strengthen national security. The promise of big data requires government data be viewed as a national resource and be responsibly made available to those who can derive social value from it. It also presents the opportunity to shape the next generation of computational tools and technologies that will in turn drive further innovation.

Big data also introduces many quandaries. By their very nature, many of the sensor technologies deployed on our phones and in our homes, offices, and on lampposts and rooftops across our cities are collecting more and more information. Continuing advances in analytics provide incentives to collect as much data as possible not only for today’s uses but also for potential later uses. Technologically speaking, this is driving data collection to become functionally ubiquitous and permanent, allowing the digital traces we leave behind to be collected, analyzed, and assembled to reveal a surprising number of things about ourselves and our lives. These developments challenge longstanding notions of privacy and raise questions about the “notice and consent” framework, by which a user gives initial permission for their data to be collected. But these trends need not prevent creating ways for people to participate in the treatment and management of their information.

You can also read comments on the report by danah boyd, and the conference report and videos from her conference’The Social, Cultural & Ethical Dimensions of “Big Data”‘ are now online.

April 4, 2014

Thomas Lumley’s latest Listener column

…”One of the problems in developing drugs is detecting serious side effects. People who need medication tend to be unwell, so it’s hard to find a reliable comparison. That’s why the roughly threefold increase in heart-attack risk among Vioxx users took so long to be detected …”

Read his column, Faulty Powers, here.

February 22, 2014

Internal and external

There’s an interesting story in the Herald with interactive graphics comparing internal and external NCEA assessments for different subjects, levels, and decile of schools, over time.  The main thing I might change about the graphic is to display over deciles rather than over years, since that’s where the action is.

The general picture is fairly consistent: in low-decile schools, the students get substantially better grades on internal assessment than external. The difference is progressively smaller as you move up the decile scale, in some cases vanishing.  Interpreting the results is more difficult.

The lead says that students do better away from the pressure of exams, which is one explanation. Another, given by Professor Carnegie from VUW, is that the internal assessment is not very reliable. There are many alternatives views given in the story, and even some who says the differences over decile are reasonable and appropriate.


February 21, 2014

Most generous in the world

From Stuff

But Tertiary Education Minister Steven Joyce has made it clear they are not going to get any more in this year’s Budget, and says students already have “one of the most generous support systems in the world”.

This is sufficiently vague that you can probably find a sense in which it’s true, and so could Mr Joyce’s counterparts in most other countries. For example, the Hong Kong system provides slightly larger loans and similar tuition subsidy, but charges (low) interest on the loans from day 1.  The US system allows much larger student loans and significant means-tested non-loan support, but provides much less public subsidy for tuition.  The UK system is more generous for students in low-income households but less generous for students in high-income households. It must be hard to find criteria where the NZ system is more generous than Germany or some other Western European countries, though.

What’s a bit more surprising is that the story treats inflation as basically a matter of opinion

From January 1999 to December 2008, they could borrow up to $150 a week. The limit has risen slowly since, and now stands at $173.56, which Mr Joyce says is in line with the rise in inflation.

vs

But Victoria University third-year student Annabelle Nichols said she and many of her friends were left in the red at the end of each week, and disagreed with Mr Joyce that living costs had kept pace with inflation.

If you look at the RBNZ online inflation calculator, you find that $150 in the first quarter of 1999 translates to $212.06 in the first quarter of 2014 using overall CPI, $217.38 using the food category, $346.62 using the housing category, $221.11 in the transport category, and $155.72 in the clothing category. Unless students are expected to spend the majority of their money on clothing, this seems inconsistent with Mr Joyce’s claim.

It’s possible that the Treasury has done specific living-cost modelling for students and that they do face lower effective inflation rates than the rest of the population, but given the location of many universities in places with expensive housing, that’s a bit surprising and would have been worth mentioning explicitly.

[Update: Mr Joyce was talking about just the period since 2008 ,when the loan limit stopped declining in real terms. That doesn’t affect my main point, which is that reporters shouldn’t treat inflation adjustment as a matter of opinion — they should check. Also, while 2008 is a relevant starting point for Mr Joyce, it’s not clear that it is for anyone else]

January 10, 2014

Meet Mengdan Yu, Statistics summer scholar

Every year, the Department of Statistics offers summer scholarships to a number of students so they can work with our staff on real-world projects. We’ll be profiling them on Stats Chat.

Mengdan (below) is working with Jessica McLay on a project titled The simario R package. She explains:

Mengdan Yu

“The simario R package is a collection of R functions for performing dynamic microsimulation developed by  COMPASS (the Centre of Methods and Policy Application in the Social Sciences at the University of Auckland). Dynamic microsimulation is used to test ‘what if?’ situations.  The starting point of the simulation is a set of attributes for each unit (usually individual) and the attributes (variables) are simulated or updated in annual steps.  User-specified modifications can be made on the variables at the start or any point during simulation in order to see the effects on output attributes of interest.

“A simple demonstration microsimulation model (demo model) using the simario R functions was created two years ago, but the focus since then has been on developing a complicated microsimulation model called Modelling the Early Life Course (MELC).  Compared to the demo model, the MELC model uses newer versions of the simario functions and has had a lot of additional functionality built in.

“What I’m doing for my summer project is ensuring that the newer versions of the simario functions  work properly with the demo model and extend the demo microsimulation model.  The extension includes adding more variables to the system, showcasing the different ways variables can be simulated over time and including more of the functionality that is currently in MELC but not in the demo model.  I will also be checking the documentation for all the functions in the simario package to make it ready to publish as an official R package.

“This is useful research as dynamic microsimulation is increasingly used, especially in government, to help in making policy decisions.  There are a number of programming languages used to create microsimulation models, including those based on C++, C#, SAS, and Java.  However, given the prominence of the R language, a package for microsimulation in R could prove useful and helpful to analysts attempting microsimulation.  The demo model in conjunction with an article (to be written later by COMPASS) will show how to put the functions together to create a working microsimulation model.

“This is my third year of a Bachelor of Science majoring in Statistics and Computer Science.  Initially, I chose statistics because I’m into calculating probabilities, and have been since I was a child. As I learned more about stats, especially analysing data by using software, I appreciated even more how useful the subject is in many areas. Studying statistics has improved my logic thinking and my ability to solve real-life problems with stats techniques.

“For the rest of the summer, I’d like to do something relaxing: hang out with my friends, sleep at home and watch dramas so I can be positive and energetic for next semester.”


December 27, 2013

Meet Tania Tian, Statistics Summer Scholar 2013-2014

Every year, the Department of Statistics at the University of Auckland offers summer scholarships to a number of students so they can work with our staff on real-world projects. We’ll be profiling the 2013-2014 summer scholars on Stats Chat. Tania is working with Dr Stephanie Budgett on a project titled First-time mums: Can we make a difference?

Tania (right) explains:Tania Tian

“This project is based on the ongoing levator ani study (LA, commonly known as the pelvic floor muscles) from the Pelvic Floor Research Group at the Auckland Bioengineering Institute (ABI), which looks at how the pelvic floor muscles change after first-time mums give birth.

“The aim is to see whether age, ethnicity, delivery conditions and other related factors are associated with the tearing of the muscle. Interestingly, the stiffness of the muscle at rest has been identified as a key factor and is being measured by a specially designed device, an elastometer, that was built by engineers at the ABI.

“Pelvic-floor muscle injury following a vaginal delivery can increase the risks for prolapse where pelvic organs, such as the uterus, small bowl, bladder and rectum, descend and herniate. Furthermore, the muscle trauma may also promote or intensify urinary and/or bowel incontinence.

“Not only do these pelvic- floor disorders cause discomfort and distress, and reduce the mother’s quality of life, and, if left untreated, may lead to major health concerns later in life. Therefore, a statistical model based on key factors elucidated from the study may aid health professionals in deciding the best strategy for delivering a woman’s baby and whether certain interventions are needed.

“I have recently completed my third year of a Bachelor of Science majoring in Statistics and Pharmacology and intend to pursue postgraduate studies. I hope to integrate my knowledge of medical sciences and statistics and specialise in medical statistics.

“Statistics appeals to me because it is a useful field with direct practical applications in almost every industry. I had initially taken the stage one paper as a standalone in order to broaden my knowledge, but eventually realised that I really liked the subject and that it could complement whichever career I have. That’s when I decided to major in statistics, and I’m very glad that I did.

“Over this summer, aside from the project, I am hoping to spend more time with friends and family – especially with my new baby brother! I am also looking forward to visiting the South Island during the Christmas break.”
 

December 23, 2013

Meet Callum Gray, Statistics Summer Scholar 2013-2014

Every year, the Department of Statistics at the University of Auckland offers summer scholarships to a number of students so they can work with our staff on real-world projects. We’ll be profiling the 2013-2014 summer scholars on Stats Chat. Callum is working with Dr Ian Tuck on a project titled Probability of encountering a bus.  

Callum (right) explains:

“If you encounter a bus on a journey, you are likely to be exposed to higher levels of pollution. I am trying to find the probability of encountering a bus and how many you will encounter when you travel from place A to place B, taking into account variables such as the time of day and mode of transport.

???????????????????????????????

“This research is useful because it will give us more of an understanding about the impact that buses have on our daily exposure to pollution. we can use this information to plan journeys and learn more about an issue that is becoming more and more apparent.

“I was born in Auckland and have lived here my whole life. I just finished my third year of a Bachelor of Commerce/Bachelor of Science conjoint majoring in Accounting, Finance, and Statistics, which I will finish at
the end of 2014.

“Statistics appeals to me because it is used everyday in conjunction with many other areas. It is very useful to know in a lot of workplaces, and it is interesting because it has a lot of real-life applications.

“I am going to Napier for Christmas and Rhythm and Vines for New Year. In the rest of my spare time, I will be playing cricket and golf, as well as hanging out with friends.”


December 12, 2013

Stats abuse in The Press, Dom Post smacked by Press Council

The New Zealand media is self-regulating – that is, it governs its own, and the Press Council is the port of call for public complaints about print media. Two complaints that have been upheld recently focused on the use/abuse of statistical information. I’m posting about these  not to take a dig at my esteemed colleagues, but to point out how we can avoid falling into a hole and/or creating a damaging, discriminatory or dangerous urban myth.

The first complaint concerns the The Press (Weekend) newspaper, which published an article on Saturday October 12, 2013, about health data from the Canterbury District Health Board concerning the increase in the sexually-transmitted infection chlamydia in the region since 2011. The headline of the article was Luck of the Irish has downside in sex-disease stats. The intro read “Irish workers helping with the rebuild are sharing the love but it seems they may also be helping to spread sexual disease.”

The Press Council noted there was no statistical information given to support the statements linking the Irish to the chlamydia. The link between the Irish nationals and the chlamydia statistics was of the newspaper’s making and not supported by any reported information, making the report inaccurate and discriminatory.  Read the full decision here.

The second complaint concerns the Dominion Post. On August 12, 2013, under the headline Boys slip further in school’s co-ed class, the paper published a story and table about achievement rates in 2012 for NCEA level 3 students in its circulation area, with the table reporting on highest and lowest achieving schools. The table gave pass rates for the highest achieving schools, but failure rates for the lowest achieving schools. Under the heading “Lowest Achieving Hawke’s Bay Schools” the table listed Wairoa High School 43.8% not achieved; Dannevirke High School: 40%; Taradale High School: 36.2%. The school complained that this conveyed a misleading impression that only 36.2% of its students had passed. In fact, 63.8% had.

It turns out that the original NZQA figures showed the number of year 13 students who had NOT passed NCEA level 3. The newspaper said that it had decided to turn the figures around to assist readers and also show how well most schools and students had performed.  In upholding the complaint, the Press Council said “A table provides readers with a quick and ready means of assessing data. But when a comparison is being made it is important that the data is presented in such a way as to make the comparison valid. The use of two differing measures of data in the same table was therefore confusing and misleading.” The editor said, ” … I do accept that we would have been better advised to have used only one measure throughout. I am happy to give an undertaking that we will not be using that format again.” Read the full decision here.


December 6, 2013

If New Zealand were a village of 100 people ….

… according to the 2013 Census figures,

  • 51 would be female, 49 male.
  • 70 would be European, 14 Maori and 11 Asian.
  • 24 would have been born overseas
  • 21 would have a tertiary qualification
  • 4 would be unemployed.
  • 4 would earn over $100,000

Statistics New Zealand has done a nice graphic of the above, too. Full 2013 Census info available here.