Posts filed under Education (86)

February 13, 2016

Just one more…

NPR’s Planet Money ran an interesting podcast in mid-January of this year. I recommend you take the time to listen to it.

The show discussed the idea that there are problems in the way that we do science — in this case that our continual reliance on hypothesis testing (or statistical significance) is leading to many scientifically spurious results. As a Bayesian, that comes as no surprise. One section of the show, however, piqued my pedagogical curiosity:

STEVE LINDSAY: OK. Let’s start now. We test 20 people and say, well, it’s not quite significant, but it’s looking promising. Let’s test another 12 people. And the notion was, of course, you’re just moving towards truth. You test more people. You’re moving towards truth. But in fact – and I just didn’t really understand this properly – if you do that, you increase the likelihood that you will get a, quote, “significant effect” by chance alone.

KESTENBAUM: There are lots of ways you can trick yourself like this, just subtle ways you change the rules in the middle of an experiment.

You can think about situations like this in terms of coin tossing. If we conduct a single experiment where there are only two possible outcomes, let us say “success” and “failure”, and if there is genuinely nothing affecting the outcomes, then any “success” we observe will be due to random chance alone. If we have a hypothetical fair coin — I say hypothetical because physical processes can make coin tossing anything but fair — we say the probability of a head coming up on a coin toss is equal to the probability of a tail coming up and therefore must be 1/2 = 0.5. The podcast describes the following experiment:

KESTENBAUM: In one experiment, he says, people were told to stare at this computer screen, and they were told that an image was going to appear on either the right site or the left side. And they were asked to guess which side. Like, look into the future. Which side do you think the image is going to appear on?

If we do not believe in the ability of people to predict the future, then we think the experimental subjects should have an equal chance of getting the right answer or the wrong answer.

The binomial distribution allows us to answer questions about multiple trials. For example, “If I toss the coin 10 times, then what is the probability I get heads more than seven times?”, or, “If the subject does the prognostication experiment described 50 times (and has no prognostic ability), what is the chance she gets the right answer more than 30 times?”

When we teach students about the binomial distribution we tell them that the number of trials (coin tosses) must be fixed before the experiment is conducted, otherwise the theory does not apply. However, if you take the example from Steve Lindsay, “..I did 20 experiments, how about I add 12 more,” then it can be hard to see what is wrong in doing so. I think the counterintuitive nature of this relates to general misunderstanding of conditional probability. When we encounter a problem like this, our response is “Well I can’t see the difference between 10 out of 20, versus 16 out of 32.” What we are missing here is that the results of the first 20 experiments are already known. That is, there is no longer any probability attached to the outcomes of these experiments. What we need to calculate is the probability of a certain number of successes, say x given that we have already observed y successes.

Let us take the numbers given by Professor Lindsay of 20 experiments followed a further 12. Further to this we are going to describe “almost significant” in 20 experiments as 12, 13, or 14 successes, and “significant” as 23 or more successes out of 32. I have chosen these numbers because (if we believe in hypothesis testing) we would observe 15 or more “heads” out of 20 tosses of a fair coin fewer than 21 times in 1,000 (on average). That is, observing 15 or more heads in 20 coin tosses is fairly unlikely if the coin is fair. Similarly, we would observe 23 or more heads out of 32 coin tosses about 10 times in 1,000 (on average).

So if we have 12 successes in the first 20 experiments, we need another 11 or 12 successes in the second set of experiments to reach or exceed our threshold of 23. This is fairly unlikely. If successes happen by random chance alone, then we will get 11 or 12 with probability 0.0032 (about 3 times in 1,000). If we have 13 successes in the first 20 experiments, then we need 10 or more successes in our second set to reach or exceed our threshold. This will happen by random chance alone with probability 0.019 (about 19 times in 1,000). Although it is an additively huge difference, 0.01 vs 0.019, the probability of exceeding our threshold has almost doubled. And it gets worse. If we had 14 successes, then the probability “jumps” to 0.073 — over seven times higher. It is tempting to think that this occurs because the second set of trials is smaller than the first. However, the phenomenon exists then as well.

The issue exists because the probability distribution for all of the results of experiments considered together is not the same as the probability distribution for results of the second set of experiments given we know the results of the first set of experiment. You might think about this as being like a horse race where you are allowed to make your bet after the horses have reached the half way mark — you already have some information (which might be totally spurious) but most people will bet differently, using the information they have, than they would at the start of the race.

January 25, 2016

Meet Statistics summer scholar Eva Brammen

photo_brammenEvery summer, the Department of Statistics offers scholarships to a number of students so they can work with staff on real-world projects. Eva, right, is working on a sociolinguistic study with Dr Steffen Klaere. Eva, right,  explains:

“How often do you recognise the dialect of a neighbour and start classifying them into a certain category? Sociolinguistics studies patterns and structures in spoken language to identify some of the traits that enable us to do this kind of classification.

“Linguists have known for a long time that this involves recognising relevant signals in speech, and using those signals to differentiate some speakers and group others. Specific theories of language predict that some signals will cluster together, but there are remarkably few studies that seriously explore the patterns that might emerge across a number of signals.

“The study I am working on was carried out on Bequia Island in the Eastern Caribbean. The residents of three villages, Mount Pleasant, Paget Farm and Hamilton, say that they can identify which village people come from by their spoken language. The aim of this study was to detect signals in speech that tied the speaker to a location.

“One major result from this project was that the data are sometimes insufficient to answer the researchers’ questions satisfactorily. So we are tapping into the theory of experimental design to develop sampling protocols for sociolinguistic studies that permit researchers to answer their questions satisfactorily.

“I am 22 and come from Xanten in Germany. I studied Biomathematics at the Ernst-Moritz-Arndt-University in Greifswald, and have just finished my bachelor degree.

“What I like most about statistics is its connection with mathematical theory and its application to many different areas. You can work with people who aren’t necessarily statisticians.

“This is my first time in New Zealand, so with my time off I am looking forward to travelling around the country. During my holidays I will explore Northland and the Bay of Islands. After I have finished my project, I want to travel from Auckland to the far south and back again.”

January 21, 2016

Meet Statistics summer scholar David Chan

David ChanEvery summer, the Department of Statistics offers scholarships to a number of students so they can work with staff on real-world projects. David, right, is working on the New Zealand General Social Survey 2014 with Professor Thomas Lumley and Associate Professor Brian McArdle of Statistics, and  Senior Research Fellow Roy Lay-Yee and Professor Peter Davis from COMPASS, the Centre of Methods and Policy Application in the Social Sciences. David explains:

“My project involves exploring the social network data collected by the New Zealand General Social Survey 2014, which measures well-being and is the country’s biggest social survey outside the five-yearly census. I am essentially profiling each respondent’s social network, and then I’ll investigate the relationships between a person’s social network and their well-being.

“Measurements of well-being include socio-economic status, emotional and physical health, and overall life satisfaction. I intend to explore whether there is a link between social networks and well-being. I’ll then identify what kinds of people make a social network successful and how they influence a respondent’s well-being.

“I have just completed a conjoint Bachelor of Music and Bachelor of Science, majoring in composition and statistics respectively.  When I started my conjoint, I wasn’t too sure why statistics appealed to me. But I know now – statistics appeals to me because of its analytical nature to solving both theoretical and real-life problems.

“This summer, I’m planning to hang out with my friends and family. I’m planning to work on a small music project as well.”


January 15, 2016

Who got the numbers, how, and why?

The Dominion Post has what I’m told is a front page story about school costs, with some numbers:

For children starting state school this year, the total cost, including fees, extracurricular activities, other necessities, transport and computers, by the time they finish year 13 in 2028 is estimated at $35,064 by education-focused savings trust Australian Scholarship Group.

That increases to $95,918 for a child at a state-integrated school, and $279,807 for private school.

Given that the figures involve extrapolation of both real cost increases and inflation thirteen years into the future, I’m not convinced that a whole-education total is all that useful. I would have thought estimates for a single year would be more easily interpreted.  However, that’s not the main issue.

ASG do this routinely. They don’t have the 2016 numbers on their website yet, but they do have last year’s version. Important things to note about the numbers, from that link:

ASG conducted an online education costs survey among its members during October 2013. The surveys covered primary and secondary school. In all, ASG received more than 1000 survey responses.

So, it’s a non-random, unweighted survey, probably with a low response rate, among people signed up for an education-savings programme. You’d expect it to overestimate, but it’s not clear how much. Also

Figures have been rounded and represent the upper ranges that parents can reasonably expect to pay

‘Rounded’ is good, even though they don’t actually show much sign of having been rounded. ‘Represent the upper ranges’ is a bit more worrying when there’s no indication of how this was done — and when the Dom Post didn’t include this caveat in their story.


Meet Statistics summer scholar Hubert Liang

Every summer, the Department of Statistics offers scholarships to a number of students so they can work with staff on real-world projects. Hubert, right, is working on ways to graphically represent community conservation effHubert Liangorts with Associate Professor Rachel Fewster. Hubert explains:

“Conservation efforts are needed to protect the natural flora and fauna of our beautiful country. This exciting project involves preparing and analysing data collected from volunteers involved in conservation efforts against pests such as rats.

“The data is analysed and uploaded to a website called CatchIT, which is an interactive website that allows the bait and trap information to be presented in graphic form to volunteers, which provides feedback on their pest-control efforts. The data comes to life on the screen, and this engages current and future volunteers in tracking the success of their pest-control projects.

“I am in the final year of my Bachelor of Science majoring in Statistics and Biological Science, having previously finished a Bachelor of Pharmacy (Hons). Statistics has a wide applicability to a wide range of disciplines, and appeals to me because I am passionate about the simple process of getting the most from raw data. It is a very rewarding process knowing that you can make the data more appealing and important to the end user.

“This summer, besides doing this studentship, I’ll be enjoying the sunshine, and relaxing on the beach with family and friends.”


January 11, 2016

Meet Statistics summer scholar Christopher Nottingham

Chris NottinghamEvery summer, the Department of Statistics offers scholarships to a number of students so they can work with staff on real-world projects. Christopher, right, is working with Associate Professor David Scott on All Blacks-related data. Christopher explains:

“My project is aimed at predicting the career lengths of current and future All Blacks based on data from all of the past All Blacks. This project will be useful as it will aid the planning within the All Blacks camp.

“This coming year, I will be studying a research-based MSc in Statistics. My thesis is in the area of quantitative fisheries science and will involve translating ADMB code into STAN code.

“Statistics appeals to me because of its diversity. For example, one day you could be analysing fisheries data, and the next, data relating to the All Blacks.

“In my spare time I enjoying walks along the beach, sailing and cycling around the waterfront with my wife.”


January 6, 2016

Meet Statistics summer scholar Katie Fahy

Every summer, the Department of Statistics offers scholarships to a number of students so they can work with staff on real-world projects. Katie, right, is working on the New Zealand Socio-Economic Index with Dr Barry Milne of COMPASS (Katie FahyCentre of Methods and Policy Application in the Social Sciences) and Professor Alan Lee from the Department of Statistics. Katie explains:

“The New Zealand Socio-Economic Index (NZSEI) assigns occupations a score that enables us to measure the socio-economic status of people in that occupation. It’s calculated using the average age, income and education level of people with each job. For example, doctors would have a very high socio-economic index, because they’re typically high-earning and well-educated people.

“The NZSEI has been created from Census data since the 90s, but has not yet been updated for the most recent Census in 2013. In this project, my job is to update the NZSEI using path analysis, and check that this updated version is appropriate for all people in New Zealand. A couple of examples include assessing that the index is valid for all ethnicities, and valid for workers in both urban and rural regions.

“The index is important to measure any changes to New Zealand over time, as it is updated with each Census. As well as this, the NZSEI uses a similar methodology to international scales, so international comparisons are possible.

“I am currently in my third year of studying Mathematics and Statistics at the University of Sheffield in England, and I’m halfway through my year here in Auckland as an exchange student. I’ve always been interested in Statistics and studying it at university level has shown me how applicable it is in a variety of fields, from finance to biology.

“Over the summer, I’m looking forward to exploring New Zealand more.”


August 19, 2015

World Statistics Day – October 20, 2015

What are you doing on October 20? Statisticians all over the world will be showcasing the value of their work under the theme ‘Better data, better lives’. Quite. Here is the logo for this year, downloadable from the UNStats site here.

WSD_Logo_Final_Languages_Outline


The World Statistics Day was proclaimed by the United Nations General Assembly in 2010 – so, fairly recently – to recognise the importance of statistics in shaping our societies. National and regional statistical days already existed in more than 100 countries, but the General Assembly’s adoption of this international day as 20 October brought extra momentum. That first World Statistics Day in October 2010 was marked in more than 130 countries and areas.

According to UNStats, this year marks an important cornerstone for official statistics, with the conclusion of the Millennium Development Goals (see how countries have fared here), the post-2015 development agenda, the data revolution (see what the Data Revolution Group set up by UN Secretary-General Ban Ki-Moon has to say here), the preparations for the 2020 World Population and Housing Census Programme and the likes.

Statschat hasn’t heard a lot about what might be happening in New Zealand and elsewhere – it might yet be a bit too early for announcements – but if you are running an event or know of one, please let us know. In the meantime, one cute initiative of UNStats is to translate the English logo into many of the languages of the world. We couldn’t miss the opportunity to have UNStats do ours in the first language of this country, te reo Māori. Te tino kē hoki o te moko nā! (Nice logo!)


WorldStatsDay_Logo_Maori-01

June 15, 2015

Verbal abuse the biggest bullying problem at school: Students

StatsChat is involved with the biennial CensusAtSchool / TataurangaKiTeKura, a national statistics education project for primary and secondary school students. Supervised by teachers, students aged between 9 and 18 (Year 5 to Year 13) answer 35 questions in English or te reo Māori about their lives, then analyse the results in class. Already, more than 18,392 students from 391 schools all over New Zealand have taken part.

This year, for the first time, CAS asked students about bullying, a persistent problem in New Zealand schools.

School students think verbal mistreatment is the biggest bullying issue in schools – higher than cyberbullying, social or relational bullying such as social exclusion and spreading gossip, or physical bullying.

Students were asked how much they agreed or disagreed with statements about each type of bullying.  A total of 36% strongly agreed or agreed that verbal bullying was a problem among students at their school, followed by cyberbullying (31% agreed or strongly agreed), social or relational bullying (25% agreed or strongly agreed) and physical bullying (19% agreed or strongly agreed).

Read the rest of the press release here.


February 25, 2015

Wiki New Zealand site revamped

We’ve written before about Wiki New Zealand, which aims to ‘democractise data’. WNZ has revamped its website to make things clearer and cleaner, and you can browse here.

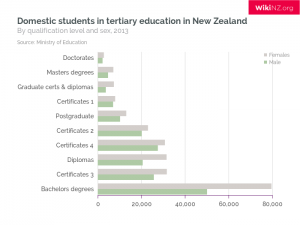
As I’m a postgraduate scarfie this year, the table on domestic students in tertiary education interested me – it shows that women (grey) are enrolled in greater numbers than men at every single level. Click the graph to embiggen.

Founder Lillian Grace talks about the genesis of Wiki New Zealand here, and for those who love the techy  side, here’s a video about the backend.


png