Posts filed under Design of experiments (23)

April 17, 2016

Evil within?

The headlineSex and violence ‘normal’ for boys who kill women in video games: study. That’s a pretty strong statement, and the claim quotes imply we’re going to find out who made it. We don’t.

The (much-weaker) take-home message:

The researchers’ conclusion: Sexist games may shrink boys’ empathy for female victims.

The detail:

The researchers then showed each student a photo of a bruised girl who, they said, had been beaten by a boy. They asked: On a scale of one to seven, how much sympathy do you have for her?

The male students who had just played Grand Theft Auto – and also related to the protagonist – felt least bad for her. with an empathy mean score of 3. Those who had played the other games, however, exhibited more compassion. And female students who played the same rounds of Grand Theft Auto had a mean empathy score of 5.3.

The important part is between the dashes: male students who related more to the protagonist in Grand Theft Auto had less empathy for a female victim.  There’s no evidence given that this was a result of playing Grand Theft Auto, since the researchers (obviously) didn’t ask about how people who didn’t play that game related to its protagonist.

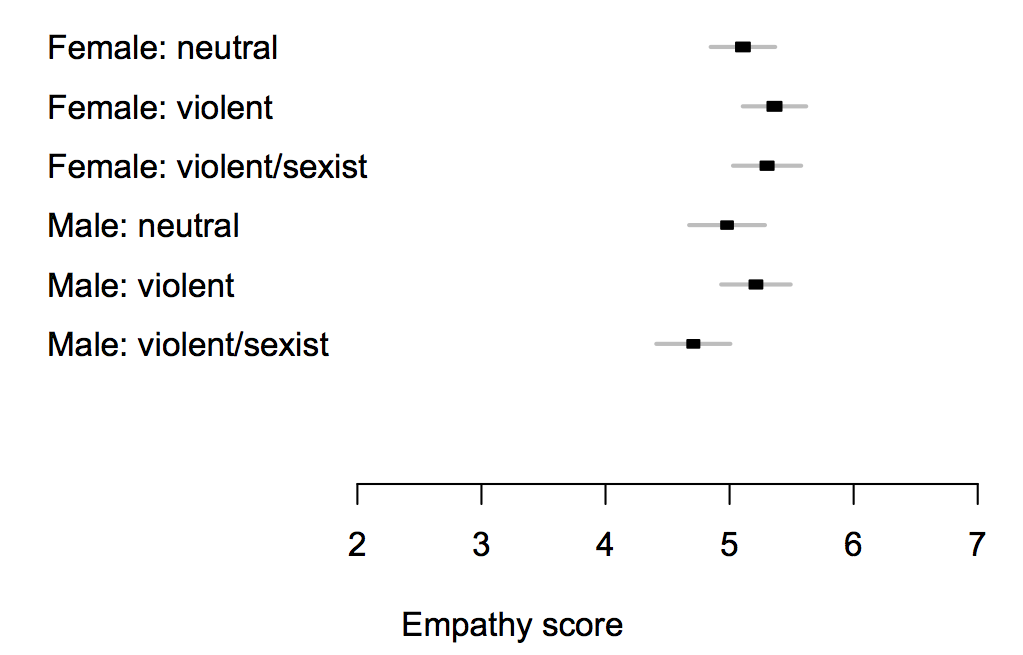
What I wanted to know was how the empathy scores compared by which game the students played, separately by gender. The research paper didn’t report the analysis I wanted, but thanks to the wonders of Open Science, their data are available.

If you just compare which game the students were assigned to (and their gender), here are the means; the intervals are set up so there’s a statistically significant difference between two groups when their intervals don’t overlap.

gtamean

The difference between different games is too small to pick out reliably at this sample size, but is less than half a point on the scale — and while the ‘violent/sexist’ games might reduce empathy, there’s just as much evidence (ie, not very much) that the ‘violent’ ones increase it.

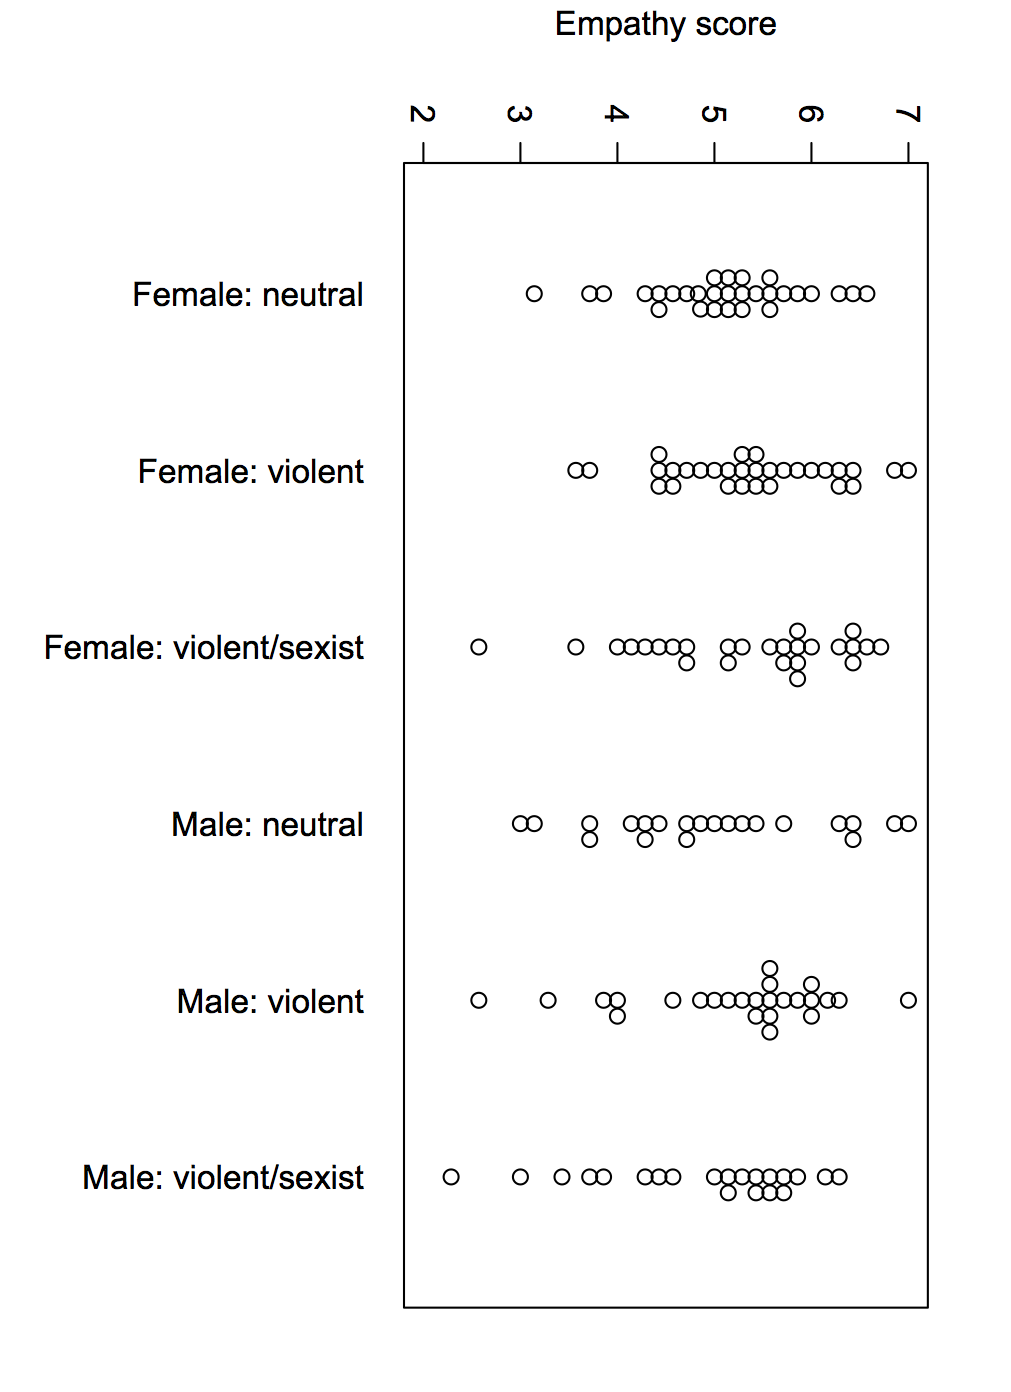
Here’s the complete data, because means can be misleading

gtaswarm

The data are consistent with a small overall impact of the game, or no real impact. They’re consistent with a moderately large impact on a subset of susceptible men, but equally consistent with some men just being horrible people.

If this is an issue you’ve considered in the past, this study shouldn’t be enough to alter your views much, and if it isn’t an issue you’ve considered in the past, it wouldn’t be the place to start.
October 2, 2015

Stay alert for overselling.

From the Daily Mail (via the Herald) “Need a boost? Try orange juice, not coffee“,  reports on a study comparing high-pulp orange juice not to coffee but to orange-flavoured water. The story says

After the real juice they did better on tests of speed and attention and still felt very alert six hours later, the European Journal of Nutrition reports.

The research paper is here (open access, no link).  There were ten tests of speed and attention and mood, each done at two times after the orange juice.   If you chose the most-impressive of the twenty comparisons and pretended it was the only one that mattered, you’d get some reasonable evidence that orange juice gave a slight improvement over fake orange juice. If you take into account the changes in all the measurements it looks much less convincing.  A combined analysis of all the measurements “approached significance,” as people say when they don’t get the hoped-for results.

And “felt very alert six hours later“? That’s a 6% difference between fake and real orange juice on a “how alert do you feel?” scale, plus or minus about 6.4%.

It’s a pity that Pepsi, who sponsored the study and sell the juice, didn’t make it a bit bigger so that any real effects would be convincing and chance fundings would be more clearly too small to worry about.


June 8, 2015

Meddling kids confirm mānuka honey isn’t panacea

The Sunday Star-Times has a story about a small, short-term, unpublished randomised trial of mānuka honey for preventing minor illness. There are two reasons this is potentially worth writing about: it was done by primary school kids, and it appears to be the largest controlled trial in humans for prevention of illness.

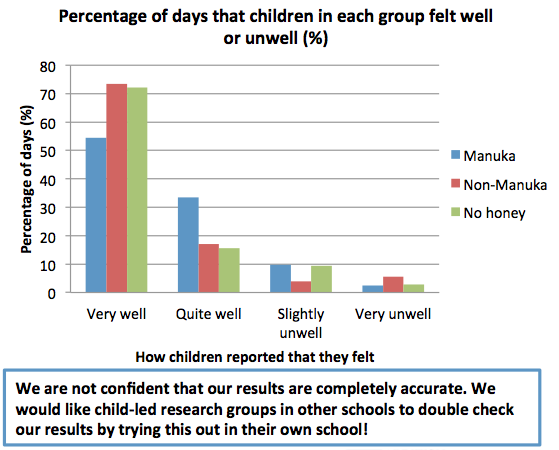
Here are the results (which I found from the Twitter account of the school’s lab, run by Carole Kenrick, who is  named in the story)CGuGbSiWoAACzbe

The kids didn’t find any benefit of mānuka honey over either ordinary honey or no honey. Realistically, that just means they managed to design and carry out the study well enough to avoid major biases. The reason there aren’t any controlled prevention trials in humans is that there’s no plausible mechanism for mānuka honey to help with anything except wound healing. To its credit, the SST story quotes a mānuka producer saying exactly this:

But Bray advises consumers to “follow the science”.

“The only science that’s viable for mānuka honey is for topical applications – yet it’s all sold and promoted for ingestion.”

You might, at a stretch, say mānuka honey could affect bacteria in the gut, but that’s actually been tested, and any effects are pretty small. Even in wound healing, it’s quite likely that any benefit is due to the honey content rather than the magic of mānuka — and the trials don’t typically have a normal-honey control.

As a primary-school science project, this is very well done. The most obvious procedural weakness is that mānuka honey’s distinctive flavour might well break their attempts to blind the treatment groups. It’s also a bit small, but we need to look more closely to see how that matters.

When you don’t find a difference between groups, it’s crucial to have some idea of what effect sizes have been ruled out.  We don’t have the data, but measuring off the graphs and multiplying by 10 weeks and 10 kids per group, the number of person-days of unwellness looks to be in the high 80s. If the reported unwellness is similar for different kids, so that the 700 days for each treatment behave like 700 independent observations, a 95% confidence interval would be 0±2%.  At the other extreme, if 0ne kid had 70 days unwell, a second kid had 19, and the other eight had none, the confidence interval would be 0±4.5%.

In other words, the study data are still consistent with manūka honey preventing about one day a month of feeling “slightly or very unwell”, in a population of Islington primary-school science nerds. At three 5g servings per day that would be about 500g honey for each extra day of slightly improved health, at a cost of $70-$100, so the study basically rules out manūka honey being cost-effective for preventing minor unwellness in this population. The study is too small to look at benefits or risks for moderate to serious illness, which remain as plausible as they were before. That is, not very.

Fortunately for the mānuka honey export industry, their primary market isn’t people who care about empirical evidence.

February 27, 2015

What are you trying to do?


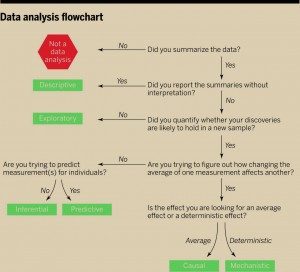
There’s a new ‘perspectives’ piece (paywall) in the journal Science, by Jeff Leek and Roger Peng (of Simply Statistics), arguing that the most common mistake in data analysis is misunderstanding the type of question. Here’s their flowchart

F1.large

The reason this is relevant to StatsChat is that you can use the flowchart on stories in the media. If there’s enough information in the story to follow the flowchart you can see how the claims match up to the type of analysis. If there isn’t enough information in the story, well, you know that.


February 20, 2015

Why we have controlled trials


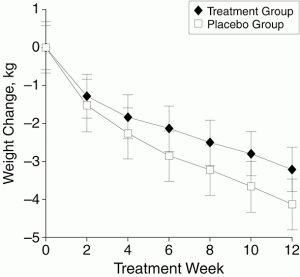
joc80747f2

The graph is from a study — a randomised, placebo-controlled trial published in a top medical journal — of a plant-based weight loss treatment, an extract from Garcinia cambogia, as seen on Dr Oz. People taking the real Garcinia cambogia lost weight, an average of 3kg over 12 weeks. That would be at least a little impressive, except that people getting pretend Garcinia cambogia lost an average of more than 4kg over the same time period.  It’s a larger-than-usual placebo response, but it does happen. If just being in a study where there’s 50:50 chance of getting a herbal treatment can lead to 4kg weight loss, being in a study where you know you’re getting it could produce even greater ‘placebo’ benefits.

If you had some other, new, potentially-wonderful natural plant extract that was going to help with weight loss, you might start off with a small safety study. Then you’d go to a short-term, perhaps uncontrolled, study in maybe 100 people over a few weeks to see if there was any sign of weight loss and to see what the common side effects were. Finally, you’d want to do a randomised controlled trial over at least six months to see if people really lost weight and kept it off.

If, after an uncontrolled eight-week study, you report results for only 52 of 100 people enrolled and announce you’ve found “an exciting answer to one of the world’s greatest and fastest growing problems” you perhaps shouldn’t undermine it by also saying “The world is clearly looking for weight-loss products which are proven to work.”


[Update: see comments]

January 31, 2015

Big buts for factoid about lying

At StatsChat, we like big buts, and an easy way to find them is unsourced round numbers in news stories. From the Herald (reprinted from the Telegraph, last November)

But it’s surprising to see the stark figure that we lie, on average, 10 times a week.

It seems that this number comes from an online panel survey in the UK last year (Telegraph, Mail) — it wasn’t based on any sort of diary or other record-keeping, people were just asked to come up with a number. Nearly 10% of them said they had never lied in their entire lives; this wasn’t checked with their mothers.  A similar poll in 2009 came up with much higher numbers: 6/day for men, 3/day for women.

Another study, in the US, came up with an estimate of 11 lies per week: people were randomised to trying not to lie for ten weeks, and the 11/week figure was from the control group.  In this case people really were trying to keep track of how often they lied, but they were a quite non-representative group. The randomised comparison will be fair, but the actual frequency of lying won’t be generalisable.

The averages are almost certainly misleading, because there’s a lot of variation between people. So when the Telegraph says

The average Briton tells more than 10 lies a week,

or the Mail says

the average Briton tells more than ten lies every week,

they probably mean the average number of self-reported lies was more than 10/week, with the median being much lower. The typical person lies much less often than the average.

These figures are all based on self-reported remembered lies, and all broadly agree, but another study, also from the US, shows that things are more complicated

Participants were unaware that the session was being videotaped through a hidden camera. At the end of the session, participants were told they had been videotaped and consent was obtained to use the video-recordings for research.

The students were then asked to watch the video of themselves and identify any inaccuracies in what they had said during the conversation. They were encouraged to identify all lies, no matter how big or small.

The study… found that 60 percent of people lied at least once during a 10-minute conversation and told an average of two to three lies.


April 25, 2014

Sham vs controlled studies: Thomas Lumley’s latest Listener column

How can a sham medical procedure provide huge benefits? And why do we still do them in a world of randomised, blinded trials? Thomas Lumley explores the issue in his latest New Zealand Listener column. Click here.

December 27, 2013

Meet Tania Tian, Statistics Summer Scholar 2013-2014

Every year, the Department of Statistics at the University of Auckland offers summer scholarships to a number of students so they can work with our staff on real-world projects. We’ll be profiling the 2013-2014 summer scholars on Stats Chat. Tania is working with Dr Stephanie Budgett on a project titled First-time mums: Can we make a difference?

Tania (right) explains:Tania Tian

“This project is based on the ongoing levator ani study (LA, commonly known as the pelvic floor muscles) from the Pelvic Floor Research Group at the Auckland Bioengineering Institute (ABI), which looks at how the pelvic floor muscles change after first-time mums give birth.

“The aim is to see whether age, ethnicity, delivery conditions and other related factors are associated with the tearing of the muscle. Interestingly, the stiffness of the muscle at rest has been identified as a key factor and is being measured by a specially designed device, an elastometer, that was built by engineers at the ABI.

“Pelvic-floor muscle injury following a vaginal delivery can increase the risks for prolapse where pelvic organs, such as the uterus, small bowl, bladder and rectum, descend and herniate. Furthermore, the muscle trauma may also promote or intensify urinary and/or bowel incontinence.

“Not only do these pelvic- floor disorders cause discomfort and distress, and reduce the mother’s quality of life, and, if left untreated, may lead to major health concerns later in life. Therefore, a statistical model based on key factors elucidated from the study may aid health professionals in deciding the best strategy for delivering a woman’s baby and whether certain interventions are needed.

“I have recently completed my third year of a Bachelor of Science majoring in Statistics and Pharmacology and intend to pursue postgraduate studies. I hope to integrate my knowledge of medical sciences and statistics and specialise in medical statistics.

“Statistics appeals to me because it is a useful field with direct practical applications in almost every industry. I had initially taken the stage one paper as a standalone in order to broaden my knowledge, but eventually realised that I really liked the subject and that it could complement whichever career I have. That’s when I decided to major in statistics, and I’m very glad that I did.

“Over this summer, aside from the project, I am hoping to spend more time with friends and family – especially with my new baby brother! I am also looking forward to visiting the South Island during the Christmas break.”


October 22, 2013

Cookies not as addictive as cocaine

Sometimes a scientific claim is obviously unreasonable, like when a physicist tells you “No, really, the same electron goes through both slots in this barrier”. You’re all “Wut? No. Can’t be.” They show you the interference pattern. “But did you think of…?” “Yes”. “Couldn’t it be..” “No, we tried that.” “But…”  “And that.”  “Still, what about…?” “That too.” Eventually you give up and accept that the universe is weird. An electron really can go through two holes at once.

On the other hand, sometimes the claim isn’t backed up that well, like when Stuff tells us “Cookies as addictive as cocaine”. For example, while some rats were given Oreo cookies and others were given cocaine, there weren’t any rates who were offered both, so there wasn’t any direct evaluation of preference, let alone of addiction. The cookies weren’t even compared to the same control as the cocaine — cookies were compared to rice cakes, and cocaine-laced water to plain water.

There’s a more detailed take-down on the Guardian site, by an addiction researcher.

August 23, 2013

Just making it easier to understand?

From the Journal of Nutritional Science

Young adult males (n 35) were supplemented with either half or two kiwifruit/d for 6 weeks. Profile of Mood States questionnaires were completed at baseline and following the intervention. No effect on overall mood was observed in the half a kiwifruit/d group; however, a 35 % (P = 0·06) trend towards a decrease in total mood disturbance and a 32 % (P = 0·063) trend towards a decrease in depression were observed in the two kiwifruit/d group. Subgroup analysis indicated that participants with higher baseline mood disturbance exhibited a significant 38 % (P = 0·029) decrease in total mood disturbance, as well as a 38 % (P = 0·048) decrease in fatigue, 31 % (P = 0·024) increase in vigour and a 34 % (P = 0·075) trend towards a decrease in depression, following supplementation with two kiwifruit/d. There was no effect of two kiwifruit/d on the mood scores of participants with lower baseline mood disturbance

From the Otago press release

Eating two kiwifruit a day can improve a person’s mood and give them extra energy, new research from the University of Otago, Christchurch (UOC) shows.

Over a six-week period, normally-healthy young men either ate two kiwifruit a day or half a kiwifruit daily as part of a research study into the potential mood-enhancing effects of the fruit.

Researchers found those eating two kiwifruit daily experienced significantly less fatigue and depression than the other group. They also felt they had more energy. These changes appeared to be related to the optimising of vitamin C intake with the two kiwifruit dose

From the Herald

Eating two kiwifruit a day can improve mood and energy levels, a new University of Otago study shows.

Those eating two kiwifruit were found to experience significantly less fatigue and depression than the others. They also felt they had more energy.

I’m not criticizing the research, which was a perfectly reasonable designed experiment, but if the findings are newsworthy, they are also worth presenting accurately.