Posts filed under Denominator? (87)

January 26, 2013

Think of a number and multiply by 3120

The Herald has a story about a new app called TalkTo. Rather than you calling a business and waiting around for a possibly unhelpful response, you can text TalkTo and wait for them to call the business, ask your question and pass on the unhelpful response. Or, at least, you can if the business is in the USA or Canada — they currently wouldn’t handle Novapay or Qantas, the two examples in the story. The app obviously wouldn’t help for issues that require a dialogue, which includes essentially all the time I spend on hold.

Anyway, the statistics angle is that we apparently spend 43 days on hold during our lives.  As a basic numeracy challenge: is this more than you expect or less?

The number comes from 20 minutes per week for 60 years, so it doesn’t apply to any actually existing people — 60 years ago, we didn’t have the same level of on-hold, and 60 years in the future there’s at least some hope that a larger fraction of businesses will figure out how to make a useful web page (or whatever the next communication technology but seven turns out to be).

January 23, 2013

Where denominators don’t help

There’s a report saying that NZ smartphone users are the 7th most at risk for attacks by cybercriminals.  We could ask the usual questions about whether this survey is worth the paper it’s not written on, but this time those are left as an exercise for the reader [as is often the case, the last sentence of the Herald’s story is especially informative].

An unusual problem with the ranking is

The ranking was based on the percentage of Android apps rated as high-risk over the total number of apps scanned per country.

The use of a percentage rather than a total here seems to make no sense.  If you have a high-risk app on your phone, it doesn’t become low-risk just because you also have lots of other apps.

January 17, 2013

Think of a number and multiply by four.

The ACC gives people money, and so has to balance the risks of fraud, rejection of valid claims, and red tape.  We get a lot of stories claiming that ACC isn’t paying people it should pay, but today’s story is about the cost of fraud.

The cost is variously described as

  • $10 million (over four years)
  • $1.8 million-$3.5 million (per year)
  • $35.9 million (actuarial cost)
  • $131 million (total future cost if it isn’t stopped)

The $131 million and $10 million numbers don’t have much going for them.  There’s no particular reason to give a total over four years; an average of $2.5 million/year would have been more helpful.  The $131 million includes costs into the indefinite future, but makes them look as if they are just like costs incurred now.  That’s the point of the actuarial estimate, to say something sensible about the current equivalent value of future expenses.

By an interesting coincidence, the $131 million figure exceeds the actuarial estimate by about the same ratio as the headline total exceeds the annual average.

January 14, 2013

20% of what?

The stories about the 20% cut in prices for international bandwidth from Southern Cross would be a lot more informative if they included some idea of how much it costs before and after, or, even better, roughly what fraction of the consumer price goes to international bandwidth.  Even to the nearest 20% would be nice.

Otherwise we’re not getting much value added over the press release.

January 7, 2013

Think of a number, then multiply by 2.6

The Herald has a story about police being arrested: 67 over 2 2/3 years.  That’s about 25 per year. The rate this year so far is a bit lower than in the previous two years, but well within the margin of error.

The Police Association says this proves we don’t need an independent complaints process, since the police already do a good job in catching their own when they stray. Of course, the figures don’t show anything of the sort, unless there is some independent reason to believe that 25/year is the number that should be arrested.   The Police Association also says that many of the arrests would have ‘not guilty’ results. This could be true, and it’s a pity that neither the Herald nor the Police Association provided any actual information on convictions.

The Herald also quotes a survey from October, purporting to show that confidence in police has fallen.  I covered this at the time. It doesn’t.

The arrest counts are not evidence one way or the other on how well the police are policed.  They are easier to obtain than relevant evidence would be, but that’s not much consolation.

January 6, 2013

Shocking comparisons

Stuff (The Sunday Star-Times) has a story about taser use statistics that illustrates the importance of the question ‘compared to what?’.

The paper tells us that nearly 1/3 of taser discharges have been at people considered by police to have mental health issues. Is that a lot? What proportion would you expect? If they know, they should be telling us, and if they don’t know, the statistic is pretty meaningless.   We aren’t even told how the proportion is changing over time. We do know that these uses were explicitly contemplated when NZ Police did their 2006 trial of the taser “The taser can be used by Police when dealing with: unarmed (or lightly armed) but highly aggressive people, individuals displaying irrational or bizarre behaviour, and people under the influence of mind altering substances, solvents or alcohol.”

Later on we get more useful (though not new) information from analysis of the pilot period of Taser use, where the weapons were more likely to be discharged when police attended a mental health emergency (27% chance) than when they made a criminal arrest (10% chance).  This is at least answering a meaningful and relevant question, and shows a large difference, though it’s still not clear how big a difference you would expect. Mental health emergencies get police involvement because they are emergencies; many criminal arrests are much more boring and routine.

The story quotes Judi Clements of the Mental Health Foundation as saying “Once you start giving that sort of weapon to police it’s highly likely it’s going to be used”. That’s a reasonable concern, but the numbers in the story, to the extent that you can interpret them, don’t really support it.   There have been 212 taser discharges over two years, from between 600 and 900 tasers, or less than one discharge per five years per taser.  We aren’t told anything about what rate of use would be appropriate, but 0.2 uses per taser-year doesn’t seem all that ‘highly likely’.

Finally,

Further statistics released to the Sunday Star-Times under the Official Information Act show there are serious reliability issues around the weapons.

That’s based on lots of them needing repairs, not on failing to work, since

Despite the problems, only one weapon had failed to fire and administer a shock since they had been rolled out.

that is, 99.5% reliability in use.

It’s important for society to keep tabs on the use of tasers by law enforcement, especially because of the potential for misuse, but reporting of free-floating numbers doesn’t qualify.
December 20, 2012

Proper use of denominators

The Herald, and the Ministry of Transport, are reporting rates for motor vehicle crashes and casualties, not just totals:

Statistically, Dunedin is New Zealand’s worst city for motor vehicle crashes and casualties but authorities say the numbers are dropping.

Last year the city recorded 364 injury crashes. Auckland had 2903, and Christchurch 715.

However, Dunedin had the highest number of crashes per 10,000 population (29), ahead of Palmerston North (24) and Napier (23).

Population is not the ideal way to standardise road crashes (especially in high-tourism areas), but it’s a lot better than not doing anything.  When we looked at crashes at intersections, back in March, it didn’t make a lot of difference whether we standardised by population, number of registered vehicles, or vehicle-miles travelled.

December 19, 2012

Slightly more dead

The Herald’s story  (via Medical Daily) about a report in the BMJ slightly misses the point. The lead says

A new report, published in the British Medical Journal, claims activities like having a couple of drinks, smoking, eating red meat and sitting in front of the TV can cut at least 30 minutes off a person’s life for every day that do it.

None of this is new. What’s new, and the point of the report, is the idea of quoting all these risks in terms of expected life lost, denominated in ‘microlives‘.   David Spiegelhalter, who is Professor for the Public Understanding of Risk, writes in the report:

We are bombarded by advice about the benefit and harms of our behaviours, but how do we decide what is important? I suggest a simple way of communicating the impact of a lifestyle or environmental risk factor, based on the associated daily pro rata effect on expected length of life. A daily loss or gain of 30 minutes can be termed a microlife, because 1 000 000 half hours (57 years) roughly corresponds to a lifetime of adult exposure. From recent epidemiological studies of long term habits the loss of a microlife can be associated, for example, with smoking two cigarettes, taking two extra alcoholic drinks, eating a portion of red meat, being 5 kg overweight, or watching two hours of television a day. Gains are associated with taking a statin daily (1 microlife), taking just one alcoholic drink a day (1 microlife), 20 minutes of moderate exercise daily (2 microlives), and a diet including fresh fruit and vegetables daily (4 microlives). Demographic associations can also be expressed in these units—for example, being female rather than male (4 microlives a day), being Swedish rather than Russian (21 a day for men) and living in 2010 rather than 1910 (15 a day). This form of communication allows a general, non-academic audience to make rough but fair comparisons between the sizes of chronic risks, and is based on a metaphor of “speed of ageing,” which has been effective in encouraging cessation of smoking.

There was a BBC documentary on this subject back in October (a 5-minute clip is available).

December 11, 2012

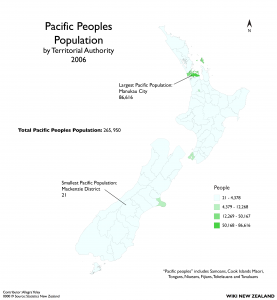
NZ data/graphics site

Wiki New Zealand bills itself as “A collaborative website making data about New Zealand accessible for everyone.”

They have lots of graphics of comparative data on New Zealand, with comparisons within the country, over time, and compared to other countries.

Two quibbles: it would be nice if the data source links gave a bit more information on how to find the data than just, eg, pointing to StatsNZ Infoshare.  Also, the thematic maps are currently all of total population counts, without any denominators.

December 3, 2012

Stat of the Week Winner: November 24 – 30 2012

Congratulations to Eva Laurenson for her excellent nomination of the NZ Herald’s article entitled “Manukau ‘luckiest’ place for Lotto”:

What does ‘luckiest’ in this title mean? Well to the average person ( I asked a few) they interpreted that title as ” I would have a higher chance of winning Lotto if I bought my ticket from a Manukau store compared to another store from a different suburb in Auckland.” Is this really the case? I doubt it. The article ranks Manukau ‘luckiest’ because it is the suburb with the highest total paid out first division amount. However no where did they take into account the total sales of Lotto tickets in each suburb. I think if you took this into account you’d see that Manukau sells alot more tickets than some of these other suburbs in Auckland. So even though Manukau can boast 55 mil in first division prizes we have no idea whether that is 55 mil out of 100 mill worth of ticket sales or 55 mil out of 1 bill worth of ticket sales. Some of the other suburbs may have a lesser amount of first division payouts compared to Manuaku but could have a greater proportion of first division payouts compared to ticket sales. Hence if that was true, your chance of winning first division given that you bought your ticket in that other suburb would be greater than (the same probability measured for) Manukau. Therefore I think there isn’t sufficient information provided to make this claim.

What I think the article could say is ‘given I won first division, the chances that I bought my ticket in Manukau are ____ times the chance that I bought it somewhere else.’ Something to this effect could be derived from the information presented by the herald article and it makes a bit of sense. Is this what the article wrote though? Not at all. They summarised this finding into “Manukau is the luckiest Lotto suburb in Auckland.” Please! This screams misleading. As discussed above, there simply isn’t enough information to justify labelling Manukau the ‘luckiest’ suburb for Lotto. People have a clear idea of what it means to be lucky and that generally is that they have an increased chance of winning. This is not the conclusion you can draw from the information they provided and in this case I believe the herald got it wrong.

I also think, although probably not the authors intentions, labelling Manukau as the ‘luckiest’ suburb has the danger of enticing people to spend more on Lotto. This article published earlier in the year by the NZ herald noted that “Many South Auckland suburbs featured among those which gambled away the most money. Mangere Bridge, Flat Bush, Manukau and Manurewa were in the top dozen suburbs.”
Even though the article was talking about the pokies, Lotto is just another form of gambling. We shouldn’t be condemming one and sending a rosy message about another, especially to communities who are struggling as it is.

Overall I think this should be the Stat of the week because using ‘lucky’ was a nice little pun but in effect mislead people regarding their chances of winning first division depending on where they bought their ticket.

Secondly it seems wrong to label a suburb ‘luckiest’ and potentially encourage a community to spend more on Lotto there when it is known that it is a compartively poorer area than other Auckland suburbs and spends alot of money on gambling as it is.

Thomas expanded on this, saying:

This looks as if it’s claiming that tickets bought in Manukau have been more likely to win. If this was true, it would still be useless, because future lotto draws are independent of past ones.

It’s even more useless because there is no denominator: not tickets sold, not people in the suburb, not even number of Lotto outlets in the suburb.

What the statistic, and the accompanying infographic, really identifies is the suburbs that lose the most money on Lotto. That’s why Manukau and Otara are ‘lucky’ and Mt Eden and Remuera are ‘unlucky’, the sort of willfully perverse misrepresentation of the role of chance that you more usually see in right-wing US outlets.