Posts filed under Correlation vs Causation (68)

December 31, 2011

Student multitasking

Another seasonal phenomenon at this time of year is the end of US college football. For those who haven’t encountered the game, American football is not entirely unlike rugby, only with less actual kicking and more ad breaks.

Some economists in Oregon have looked at the relationship between the average male:female GPA difference  at the University of Oregon and the performance of the Ducks, the University’s football team.

So what did the economists find? While the average GPA for male students was always lower than for female students, there was a definite pattern with a larger gap in years when the Ducks did well and a smaller gap when the team did poorly. (more…)

December 26, 2011

Compared to what?

From Sonia Pollak’s winning Stat of the Week

Now, if we look at the number of people who lodged a claim on Christmas day: this was 3040.
In the 07/08 financial year there was 1.8 million claims, an average of around 5000 a day.

Telling people to look out over the Christmas period and take care is good, but from this, it would appear that actually, Christmas day has less, if not accidents, claims than the average day.

Another famous example in journalism is by Eric Meyer, (via Robert Niles)

My personal favorite was a habit we use to have years ago, when I was working in Milwaukee. Whenever it snowed heavily, we’d call the sheriff’s office, which was responsible for patrolling the freeways, and ask how many fender-benders had been reported that day. Inevitably, we’d have a lede that said something like, “A fierce winter storm dumped 8 inches of snow on Milwaukee, snarled rush-hour traffic and caused 28 fender-benders on county freeways” — until one day I dared to ask the sheriff’s department how many fender-benders were reported on clear, sunny days. The answer — 48 — made me wonder whether in the future we’d run stories saying, “A fierce winter snowstorm prevented 20 fender-benders on county freeways today.” There may or may not have been more accidents per mile traveled in the snow, but clearly there were fewer accidents when it snowed than when it did not. (more…)

December 21, 2011

Airbourne cocaine levels cause cancer

That got your attention didn’t it? The article Are You Inhaling Secondhand Coke? certainly got my attention when I read it on Slashdot but more in the kind of “correlation being misinterpreted as causation” way.

To be fair to the scientists in the study, they do actually say this, but the journalist who wrote it up did not find it necessary to include that information until the reader is about three quarters of the way through the article.

Somebody should nominate this for Stat of the Week.

December 11, 2011

Need to prove something you already believe?

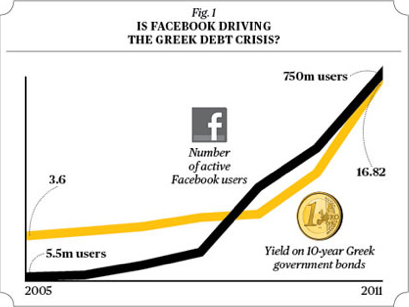
Statistics are easy: All you need are two graphs and a leading question:

More correlation versus causation examples at Business Week.

November 30, 2011

Half of what?

The sesquipedalian accounting company PwC has a new business fraud report, claiming that half of all NZ businesses have been victims. This is from a survey with 93 Kiwi respondents, including some businesses with even fewer than 200 employees.

The obvious problem is that large businesses have many more employees and are much more likely to have at least one case of fraud.  Small businesses, of which there are many, are vastly under-represented.  A more dramatic example from a few months back was the claim by the US National Retail Federation that 10% of companies it polled had been victims of a ‘flash mob’ attack.   That’s not 10% of stores, that’s 10% of a sample of 106 companies including BP, Sears, and North Face.

The claim that fraud is on the rise could still be supported by the data, as long as the same methodology was used now as in the past, but the reported change from 42% to 49.5% would be well within the margin of error if the 2009 survey was the same size as the new one.

PwC’s Alex Tan explains the rise as “We’re a relatively low-wage economy but we like high-wage living.”  This certainly isn’t a result of the poll — they didn’t poll the perpetrators to ask why they did it — and it sounds rather like the classic fallacy of explaining a variable by a constant.   New Zealand is a relatively low wage country, but we were a relatively low wage country in 2009 as well, and even before that.  Baches are expensive now, but they were expensive in 2009, and even before that.   If low wages and expensive tastes are overcoming Kiwis’ moral fibre this year, how did they resist two years ago?

November 17, 2011

Blaming road deaths on mum

Over-protective mothers are now being blamed for road deaths among teenage boys.  I suppose it’s a change from saying that overprotective mothers make boys gay, as Freud famously imagined.

We’ve written before about the problem of seeing and trying to explain a trend when there’s really nothing there but random variation.  That isn’t what’s happening here.  In this case the trend is real. It’s just in the opposite direction to the explanation. (more…)

November 12, 2011

Dietary fibre and cancer

Q: Did you see the BBC news article about dietary fibre and bowel cancer?

A: No, but I’ll go look. [reading noises]

Q: Well?

A: They definitely  get points for linking to the article in the British Medical Journal (and it’s even an open access article that anyone can read).

Q: Haven’t we beaten that issue into the ground yet?

A: Apparently not. (more…)

November 9, 2011

What the frack?

The New Zealand Herald (09-Nov-2011) has a very interesting article about earthquakes in Oklahoma. Scientists from the Oklahoma Geological Survey plan to investigate whether the process of “fracking” has led to an increase in earthquake activity.

Fracking is a controversial fossil fuel recovery method whereby high pressure water is injected into rock, fracturing it, and then send is forced into the cracks allowing the substance of interest, in this case gas, to escape. This process has been known about for quite sometime, but it is the depletion of existing reserves, and the subsequent increase in the price of oil and gas that has made it exceptionally popular in recent times.

In Oklahoma, the principal fracking area is known as the Devonian Woodford Shale. According to Wikipedia, the first gas production was recorded in 1939, and by late 2004, there were only 24 Woodford Shale gas wells. However, by early 2008, there were more than 750 Woodford gas wells. Another site reports that currently over 1,500 wells have already been drilled with many more to come. The wells cost $US2-3 million, and there are more than 35,000 shale gas wells currently in the United States.

One of the nice things about the US Geological Survey, and its state based constituents, is that it is usually relatively easy to get data from them. I say relatively, because it required some searching and programming to speed the process up, but the data is all there for someone willing to spend sometime getting it.

To show fracking is causing an increase in seismic activity would require proper experimentation. However, it may be possible to show correlation at least between the increase in fracking wells and the number of seismic events. I don’t have enough clout, or time, to extract the information about the number of wells, and their location. However it is still interesting just to take a look at the data we can get regarding the number of earthquakes ourselves.

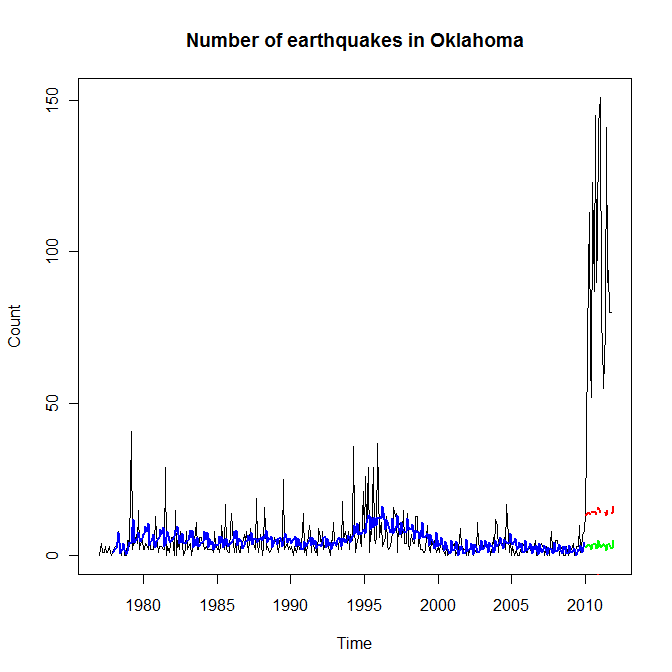
Time series plot of earthquakes in Oklahoma

The black line in time series plot above shows the number of seismic events from January 1977 to October 2011. The rise at the start of 2010 is certainty indisputable. The blue line a form of exponential smoothing called Holt-Winters smoothing (or Holt-Winters triple exponential smoothing). It is a simple statistical technique that attempts to model the trends (among other things) in time series data. The green line is the predicted number of earthquakes using this smoothing model (calculated on the pre-2010 data) for the time period starting January 2010 to October 2011, and the red line is the upper confidence limit on this prediction. This is a very simple modelling attempt, and undoubtedly the “real time-series analysts” could do better (and here is the data for you), but what I would like to think this shows is that the increase in quake count is so far off the charts that it definitely qualifies for further investigation.

Some of you will no doubt be grumbling that I have not accounted for the magnitude, or depth, or location, or in fact many other things, and indeed I have not. However, I do think the data is interesting, and the association with the increase in fracking should be explored further – which is what the Oklahoma Geological Survey plans to do.

I have made the uncleaned raw data available here.

October 21, 2011

Our RWC 2015 team was born in March 1987

Were you born between January and March in 1987? Congratulations – you’re picked for the RWC 2015 New Zealand team!

This rather ridiculous (and untrue) piece of information I just made up was concocted by examining some data and coming to an unsubstantiated conclusion. I was inspired to do this because I read recently in a British tabloid that one should “Give birth in March for a pilot” and “Victoria Beckham’s [daughter] likely to become bricklayer”. Finding the exact source of the study from the Office of National Statistics was troublesome but instead led me to a lot of advice for when to get pregnant so your child could be a dentist.

Without seeing the original study we cannot say what got twisted around between when the UK Census was collected and when the tabloids hit the news stands. The methodological insight that we get from the Daily Mail suggests that the monthly professions-of-choice are those “with the greatest percentage above the monthly average”. Well, pick a bunch of numbers and there will be a biggest one! It doesn’t necessarily condemn your January-born aspiring sheet-metal worker to the life of a GP.

A further concern arises from multiple comparisons. The more things you look for, the more “oddities” or coincidences you’ll find – none of them have to mean anything at all. Compare 19 professions against 12 months and that’s 228 chances to find something a little unusual. You’re sure to go away with a juicy collection of headlines for these pains. Even further, oddities in the statistical sense can be decidedly underwhelming in practical terms, if we are dealing with huge numbers of respondents as in the UK census. It might be statistically all-but-certain that “Spring birth conveys height advantage” but the height advantage in question turns out to be only 6 mm.

One place where we can see a real and well-studied effect from month of birth is sport. Sport is seasonal and, unlike dentistry, has a very clear starting time every year. If sports are organised by age-group and you are among the oldest in the group, you have almost a year’s advantage over the youngest. For children, a year is a big deal in terms of size, physical coordination, and maturity – and this advantage snowballs throughout childhood as you get picked for the best teams, practise more, play against better opponents, and on and on. Ad Dudink examined Dutch and English soccer players in 1994, following in the footsteps of Barnsley and Thompson who examined Canadian hockey players in 1985 and 1988.

As for whether you’ll be a dentist or a bricklayer, it is possible that this can be affected by birth month, because the age differential in the school year affects children’s academic outcomes in a similar (but less drastic) way to sports teams. In the UK, children start school in September, so September-born children have a year’s maturity advantage over their August-born classmates. This is not a temporary effect: studies have shown that the advantage/disadvantage continues to school-leaving exams and university.

In New Zealand our school season begins in February, so don’t expect the same education outcomes to birth month misconnections as the United Kingdom.

But how about them All Blacks?

I extracted the place and date of birth of each of the team members listed for the All Blacks and French teams from the Rugby World Cup 2011 website, which I then ran through sed, R and finally dumped into Excel.

Then I separated the players out into hemisphere of birth, as each hemisphere has a different season start. All the French players were born in the northern hemisphere, and all the All Blacks were born in the southern hemisphere, making my life a bit easier.

I’ve plotted them here. French (blue) above the equator, and All Blacks (black) below:
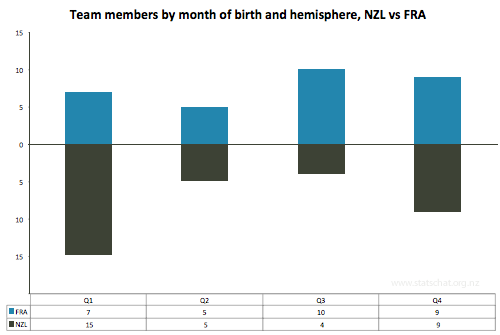
Graph of data

Team members by quarter of birth and hemisphere, NZL vs FRA

Eyeballing that does suggest some stories about when to be born if you want to play for the All Blacks or the French, but being born in January to March isn’t going to get you straight onto the All Black squad. There are many other factors that influence your selection:

Eat a healthy diet, high in Weet-Bix, exercise often, and most importantly, you can increase your chances of being on the squad by starting to play rugby.

A few references and citations for further reading:

^ Jessica Utts (2003). What Educated Citizens Should Know About Statistics and Probability. The American Statistician. May 1, 2003, 57(2): 74-79. doi:10.1198/0003130031630

^ Weber GW, Prossinger H, Seidler H (1998). Height depends on month of birth. Nature, 391(6669), 754-755 doi:10.1038/35781

^ Dudink A (1994). Birth date and sporting success. Nature, 368(6472), 592.

^ Barnsley RH, Thompson AH, Barnsley PE (1985). Hockey success and birth-date: The relative age effect. Journal of the Canadian Association for Health, Physical Education, and Recreation, Nov.-Dec., 23-28.

^ Barnsley RH, Thompson AH (1988). Birthdate and success in minor hockey: The key to the N.H.L.. Canadian Journal of Behavioral Science 20, 167-176.

Wiseman, R (2008). Quirkology: The Curious Science Of Everyday Lives, 28-29 ISBN: 9780330448093

Back in 2008 the All Black squad was also dominated by January – March births: http://rowansimpson.com/­2008/12/07/31-december/

October 3, 2011

Noted for the record

One of the reasons statistics is difficult is the ‘availability heuristic’. That is, we estimate probabilities based on things we can remember, and it’s a lot easier to remember dramatic events than boring ones.  It’s not just that correlation doesn’t imply causation; our perception of correlation doesn’t even imply correlation.

To help with availability, I’d like to make two boring and predictable observations about recent events.

1.  This winter, despite the Icy Polar Blast™, was slightly warmer than the historical average, as forecast.

2. There wasn’t a major earthquake in ChCh in the last week of September, despite the position of the moon or the alignment of Uranus (or anything else round and irrelevant).