Posts filed under Careers (39)

January 21, 2015

Meet Statistics summer scholar Alexander van der Voorn

Alex van der VoornEvery year, the Department of Statistics offers summer scholarships to a number of students so they can work with staff on real-world projects. Alexander, right, is undertaking a statistics education research project with Dr Marie Fitch and Dr Stephanie Budgett. Alexander explains:

“Essentially, what this project involves is looking at how bootstrapping and re-randomisation being added into the university’s introductory statistics course have affected students’ understanding of statistical inference, such as interpreting P-values and confidence intervals, and knowing what can and can’t be justifiably claimed based on those statistical results.

“This mainly consists of classifying test and exam questions into several key categories from before and after bootstrapping and re-randomisation were added to the course, and looking at the change (if any) in the number of students who correctly answer these questions over time, and even if any common misconceptions become more or less prominent in students’ answers as well.

“This sort of project is useful as traditionally, introductory statistics education has had a large focus on the normal distribution and using it to develop ideas and understanding of statistical inference from it. This results in a theoretical and mathematical approach, which means students will often be restricted by the complexity of it and will therefore struggle to be able to use it to make clear inference about the data.

“Bootstrapping and re-randomisation are two techniques that can be used in statistical analysis and were added into the introductory statistics course at the university in 2012. They have been around for some time, but have only become prominent and practically useful recently as they require many repetitions of simulations, which obviously is better-suited to a computer rather than a person. Research on this emphasises how using these techniques allow key statistical ideas to be taught and understood without a lot of fuss, such as complicated assumptions and dealing with probability distributions.

“In 2015, I’ll be completing my third year of a BSc in Statistics and Operations Research, and I’ll be looking at doing postgraduate study after that. I’m not sure why statistics appeals to me, I just found it very interesting and enjoyable at university and wanted to do more of it. I always liked maths at school, so it probably stemmed from that.

“I don’t have any plans to go away anywhere so this summer I’ll just relax, enjoy some time off in the sun and spend time around home. I might also focus on some drumming practice, as well as playing with my two dogs.”

June 5, 2014

Gender, coding, and measurement error

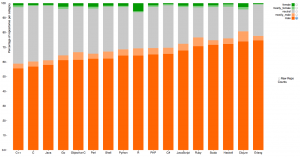
Alyssa Frazee, a PhD student in biostatistics at Johns Hopkins, has an interesting post looking at gender of programmers using the Github code repository. Github users have a profile, which includes a first name, and there programs that attempt to classify first names by gender.

This graph (click to embiggen, as usual) shows the guessed gender distribution for software with at least five ‘stars’ (likes, sort of) across programming languages. Orange is male, green is female, grey is “don’t know”

coder-gender

The main message is obvious. Women either aren’t putting code on Github or are using non-gender-revealing or male-associated names.

The other point is that the language with the most female coders seems to be R, the statistical programming language originally developed in Auckland, which has 5.5%.  Sadly, 3.9% of that is code by the very prolific Hadley Wickham (also originally developed in Auckland), who isn’t female. Measurement error, as I’ve written before, has a much bigger impact on rare categories than common ones.

March 7, 2014

Careers in statistics

From Science Careers

“[The Bureau of Labor Statistics] projects that statistics jobs will grow 27% from 2012 to 2022, putting the profession in the “much faster than the average for all occupations” growth category. The bureau puts statisticians’ median annual salary in 2012 at $75,560.

In addition to having a different quote from Hal Varian than the one you were expecting, they talk to statisticians including Xihong Lin and Montse Fuentes.

December 23, 2013

Meet Callum Gray, Statistics Summer Scholar 2013-2014

Every year, the Department of Statistics at the University of Auckland offers summer scholarships to a number of students so they can work with our staff on real-world projects. We’ll be profiling the 2013-2014 summer scholars on Stats Chat. Callum is working with Dr Ian Tuck on a project titled Probability of encountering a bus.  

Callum (right) explains:

“If you encounter a bus on a journey, you are likely to be exposed to higher levels of pollution. I am trying to find the probability of encountering a bus and how many you will encounter when you travel from place A to place B, taking into account variables such as the time of day and mode of transport.

???????????????????????????????

“This research is useful because it will give us more of an understanding about the impact that buses have on our daily exposure to pollution. we can use this information to plan journeys and learn more about an issue that is becoming more and more apparent.

“I was born in Auckland and have lived here my whole life. I just finished my third year of a Bachelor of Commerce/Bachelor of Science conjoint majoring in Accounting, Finance, and Statistics, which I will finish at
the end of 2014.

“Statistics appeals to me because it is used everyday in conjunction with many other areas. It is very useful to know in a lot of workplaces, and it is interesting because it has a lot of real-life applications.

“I am going to Napier for Christmas and Rhythm and Vines for New Year. In the rest of my spare time, I will be playing cricket and golf, as well as hanging out with friends.”


November 20, 2013

Statistician statistics: gender, race, ethnicity

New data from the American Community Survey on race, ethnicity, and gender balance in science/technology employment.  (more…)

September 22, 2013

Briefly

  • Careers: The number of people getting statistics degrees in the US has doubled in the past five years (and they’re still able to get jobs)
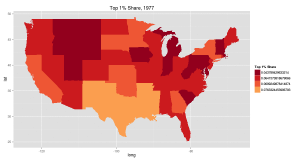
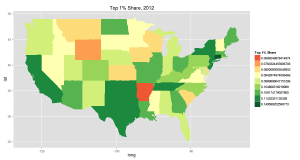
  • Increasing inequality in the US from 1977 to 2012 (it happens in other places too): top 1% share of income.  The colour choice is a bit unfortunate (red: more equal, green:less equal). There are animated pictures and more inequality measures in the original

aqzaxe9-1aqzaxe9

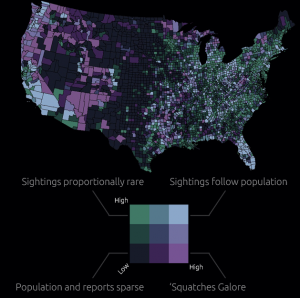
  • Map of sasquatch sightings in the US. The original has all the sightings as well as this map cross-referenced with population density. Remember, just because you can measure it doesn’t mean it exists

sasquatch

  • Software for drawing data-based maps: CartoDB. Has both free and paid versions.  Worth a look if you do maps.
September 19, 2013

Silver Ferns’ secret weapon

From One News NZ, a story about Bobby Wilcox, the team’s performance analyst, who has a PhD in Statistics from our department

She’s been one of the Silver Ferns most integral members for nine years, yet she’s largely anonymous outside…


[the video comes with a very annoying ad, sadly]

September 13, 2013

Briefly

From this morning’s Twitter feed

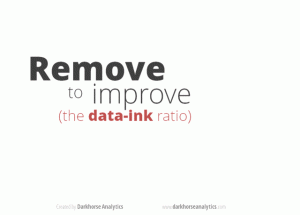
  • An animated GIF (click on it to wake it up) showing how to improve a barchart by removing junk. [from Darkhorse Analytics: Data looks better naked]

data-ink


  • Data journalism: how the data sausage gets made.  Jacob Harris describes how he collected and summarised data on meat recalls in the US
  • The Royal Statistical Society has repeated the simple maths test they gave politicians last year, this time for senior professionals and managers. Less than half of them could give the probability of getting two heads from tossing two coins.
  • However, the same Royal Statistical Society news item ends “The figures have been weighted and are representative of all GB adults (aged 18+)”. This seems to me to fall in the “not even wrong” category. The target group aren’t remotely representative of all British adults, and I’d be surprised if it was even possible to reweight them to the national age distribution.
  • Cathy O’Neill (mathbabe.org) asks why rankings of eg, cars or universities don’t allow the user to change priorities for different attributes (as the OECD Better Life Index does, for example)
September 2, 2013

Evidence-based interviewing?

Two links,

Deciding who to interview: Aline Lerner looked at resumes of 300 candidates interviewed at a Silicon Valley company to see what predicted getting the job. The biggest factor wasn’t grades or degree or experience, it was typos  — and this was among people who got an interview.

Did it work? An interview with a Google exec by the New York Times

We looked at tens of thousands of interviews, and everyone who had done the interviews and what they scored the candidate, and how that person ultimately performed in their job. We found zero relationship. It’s a complete random mess, except for one guy who was highly predictive because he only interviewed people for a very specialized area, where he happened to be the world’s leading expert.

August 2, 2013

The methods behind the statistics do matter

From the US 6th Circuit Court of Appeals (PDF), in a lawsuit alleging false advertising by a US law school, based on a low-quality survey of graduates

For example, the Employment Report for 2010 states that the “average starting salary for all graduates” was $54,796. On its face, the phrase “all graduates” means just that: all Cooley graduates—not just the ones who responded to the survey—made, on average, $54,796. One could assume that, because there were 934 graduates, the average starting salary for all 934 graduates was $54,796. The title of the document containing this statement is “Employment Report and Salary Survey.”  Therefore, it cannot be that the average starting salary of all 2010 graduates was $54,796, because the document, entitled “Employment Report and Salary Survey” (emphasis added) was not based on the responses of all of the Cooley graduates in 2010; rather, the document states that the number of 2010 graduates was 934, but the number of graduates with employment status known was 780. So, the “[a]verage starting salary for all graduates” would instead mean the average starting salary of graduates who responded to the survey and chose to include their salary information—not the average salary of all Cooley graduates in any given year.

We agree with the district court that this statistic is “objectively untrue,” but that the graduates’ reliance upon it was “also unreasonable,”  which dooms their fraudulent misrepresentation claim.

It’s not just statisticians who think you need to pay attention to where the numbers come from.

(via)