Posts written by Rachel Cunliffe (512)

avatar

Rachel Cunliffe is the co-director of CensusAtSchool and currently consults for the Department of Statistics. Her interests include statistical literacy, social media and blogging.

August 2, 2011

The Big Mac Index for Exchange Rates

The Economist has updated its Big Mac Index:

“The Economist’s Big Mac index is a fun guide to whether currencies are at their “correct” level. It is based on the theory of purchasing-power parity (PPP), the notion that in the long run exchange rates should move towards the rate that would equalise the prices of a basket of goods and services around the world.”

At market exchange rates, a burger is 9% more expensive in New Zealand than in America. In other words, the raw Big Mac index suggests that the NZD is 9% overvalued against the US dollar. Adjusting for GDP per person, the NZD is 29% overvalued.

Read more »

July 22, 2011

NZ 2011 Referendum Voting System Simulator

New Zealanders will vote in a referendum in November asking whether they want to change the current voting system used for deciding the makeup of Parliament.

Dr Geoffrey Pritchard and Dr Mark C. Wilson, members of the Centre for Mathematical Social Science at the University of Auckland, have created a simulator intended to voters to compare the 5 proposed electoral systems in a quantitative way, by allowing them to compute quickly, for a given polling scenario, the party seat distribution in Parliament under each system.

You can try it out by going to http://cmss.auckland.ac.nz/2011-referendum-simulator/ and they would appreciate any feedback on how to improve it.

It is written in Javascript and the source code is publicly available. The assumptions made are detailed in the FAQ.

They hope that this will allow a better understanding of the consequences of adopting any of these systems, and complement the qualitative information given by the Electoral Commission.

July 4, 2011

Data visualisation links worth exploring

Brain Pickings has compiled a fantastic list of 7 books on data visualisation from the speakers at the eyeo festival.

Once you’ve explored those, jump over to eyeo‘s website to be linked to some incredible people in the data visualisation field, including:

Moritz Stefaner who worked on the OECD Better life project and Google’s Think Quarterly – both previously blogged about here on Stats Chat; Ben Fry of Fathom, Adam Bly of Visualizing, Amanda Cox who creates beautiful graphics for the New York Times, and Nicholas Felton. All their sites are well worth a visit.

eyeo was partly sponsored by Visual.ly which launches this week and promises to showcase more than 2,000 visualisations and enable people to create their own web-based infographics and visualisations.

And, for more fascinating visualisations, visit Data Insight – a recently held data visualisation competition.

Our PhD student Bobby Willcox in NZ Herald

Bobby Willcox, one of our PhD students at the University of Auckland, Department of Statistics was featured in the NZ Herald yesterday.

Bobby’s major area of interest is statistical research in netball. She completed her MSc in Statistics in 2004, and has been involved with Netball New Zealand and the Silver Ferns netball team ever since. She is currently the Performance Analyst for the Silver Ferns and is in the process of completing her PhD, started in 2007. Her research is focused around finding a way to objectively measure and evaluate player performance in netball and identifying different strategies adopted by players within each position on court.

Read more about Bobby’s statistical tools developed for the Silver Ferns.

June 29, 2011

Even toddlers use statistics!

New research published in the journal Science from researchers at MIT has shown that toddlers as young as 16 months old are able to make accurate judgments about whether a toy failed to operate due to their own mistake or due to circumstances beyond their control.

The results give insight into how toddlers use prior knowledge with some statistical data to make accurate inferences about the cause of a failed action. These findings are contrary to commonly held educational assumptions that young children aren’t able to distinguish among causes and has implications for early childhood education and for how humans learn in general.

“Infants who saw evidence suggesting the failure was due to their own action tried to hand the toy to their parents for help. Conversely, babies who saw evidence suggesting that the toy was broken were more likely to reach for a new toy, as another one was always nearby.

“That’s the amazing thing about what the babies are doing,” said Schulz. “They can use very, very sparse evidence because they have these rich prior beliefs and they can use that to make quite sophisticated, quite accurate inferences about the world.”

“It was fascinating to see that they are even sensitive to this problem of figuring out whether it’s them or the world to begin with,” added Gweon, “and that they can track such subtle statistical dependence between agents, objects and event outcomes to make rational inferences.”

Read more about the study »

June 21, 2011

CensusAtSchool makes news headlines today

CensusAtSchool – one of the The University of Auckland’s Department of Statistics’ educational projects in association with Statistics New Zealand and the Ministry of Education – has made news headlines today with its survey findings on students’ thoughts on who will win the Rugby World Cup.

Read the original press release and the article on NZ Herald.

See also:

How trustworthy is Reader’s Digest’s “most trusted” list?

Yesterday Reader’s Digest released its annual list of most trusted people in New Zealand and the list got many people talking because of its surprising results: “Scientists topple sportspeople in ‘most trusted’” said the NZ Herald headline.

Today the NZ Herald followed up with a story on whether the survey itself could be deemed trustworthy. Professor David Scott from our department was ask to comment on the methodology and the not-so-obvious change in methodology compared with previous years and how that could influence the results.

The Reader’s Digest also puts out other “most trusted” lists and a complaint about the methodology was taken to the Press Council in 2004 by Variety Club but it was not upheld. The ruling points out that these polls are more about “which was more popular than statistically scientific”.

June 20, 2011

Visualising quality of life in New Zealand

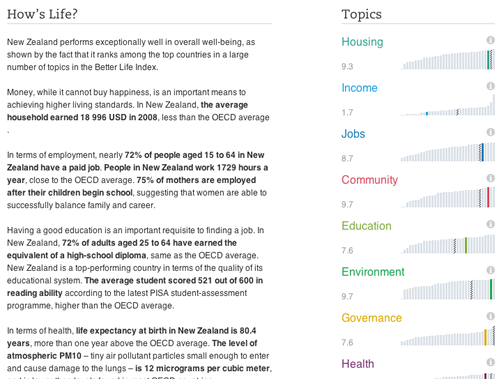
On May 24, the OECD launched a fascinating new interactive visual tool which allows you to compare quality of life: Better life Index. Rather than just focussing on GDP and economic statistics, this index allows you to compare lives across 34 countries, based on 11 topics: housing, income, jobs, community, education, environment, governance, health, life satisfaction, safety and work-life balance.

One of the unique features of the tool is that you can define what “better life” means for you by giving your own personal weight to the importance of each of these topics and find out how countries stack up. You can then share it with others by email, Facebook or Twitter and see which country best meets your criteria.

The data is presented in a beautiful and original format: by using flowers for each country, with a petal for each topic. The length of the petal represents the country’s score for that topic and the width represents the importance you’ve assigned to that topic. Each topic is based on multiple variables and the definitions are clearly explained, along with the ability to download all the data for yourself into Excel.
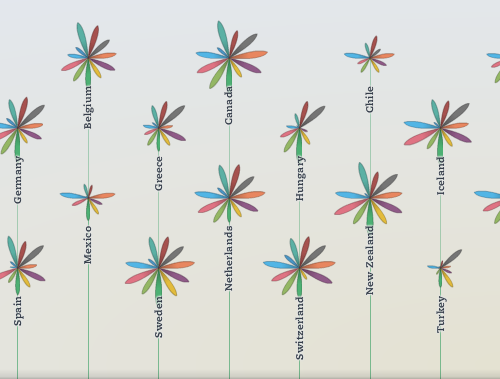
So, what does quality of life look like for New Zealand?
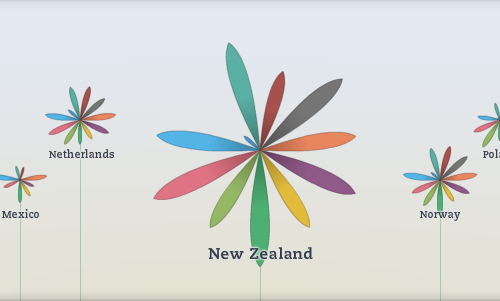
Overall, our flower looks quite healthy but what is that tiny little petal there? Go explore!

You can compare New Zealand to Australia (or any of the other OECD countries), and find out if New Zealand has the best quality of life you’re looking for!
June 19, 2011

Thanks Media Watch… and welcome!

Thanks Media Watch for the mention this morning for Stats Chat!  You can listen to the my interview online and if you’ve just discovered our newly-launched blog, welcome!

This is a group blog from various members of the The University of Auckland’s Department of Statistics.

We’ll be covering all sorts of topics of interest to the general public (so you don’t have to be a statistics major to understand everything here) – the use and misuse of statistics in the media (especially those relating to New Zealand), curated links to sites showing new ways of exploring data and more.

June 17, 2011

Reporting of health risks in the media

New research published in the journal Public Understanding of Science from a group of British researchers including Ben Goldacre of Bad Science has found that misreporting of dietary advice by UK newspapers is widespread and may contribute to public misconceptions about food and health.

The authors took the Top 10 bestselling UK newspapers for a week and evaluated the evidence for every single health claim reported on using the best currently available published research. Each claim was graded using two standard systems for categorising the strength of evidence.

They found 111 health claims were made in those UK newspapers over one week and in only 15% of those claims the evidence was “convincing”.

For more details and limitations on the study, see this Guardian article by Ben Goldacre in which he concludes:

It seems that the majority of health claims made, in a large representative sample of UK national newspapers, are supported only by the weakest possible forms of evidence.

People who work in public health bend over backwards to disseminate evidence-based information to the public. I wonder if they should also focus on documenting and addressing the harm done by journalists.