Posts written by Rachel Cunliffe (512)

avatar

Rachel Cunliffe is the co-director of CensusAtSchool and currently consults for the Department of Statistics. Her interests include statistical literacy, social media and blogging.

November 14, 2012

2013: International Year of Statistics

A call for contributions from The Australian Mathematical Sciences Institute:

2013 is the International Year of Maths of Planet Earth and the International Year of Statistics. This is a once in a decade PR opportunity for the our discipline, AMSI is coordinating the national program for the year.

We are looking for guest bloggers to help us get the word out about the beauty and application of mathematics and statistics in the world around us. We want to show how mathematics and statistics appear in transport networks, bone remodelling, bush fire prediction, economic forecasting, predicting weather patterns, nature, movie animation, gene sequencing or any of the many other areas. Whatever your area of mathematics or statistics we want to hear from you.

This is an opportunity to showcase your research and teaching and help us show the limitless applications of mathematics and statistics to inspire the next generation.

Interested, or want more information? Email Simi.

November 12, 2012

Stat of the Week Competition: November 10 – 16 2012

Each week, we would like to invite readers of Stats Chat to submit nominations for our Stat of the Week competition and be in with the chance to win an iTunes voucher.

Here’s how it works:

  • Anyone may add a comment on this post to nominate their Stat of the Week candidate before midday Friday November 16 2012.
  • Statistics can be bad, exemplary or fascinating.
  • The statistic must be in the NZ media during the period of November 10 – 16 2012 inclusive.
  • Quote the statistic, when and where it was published and tell us why it should be our Stat of the Week.

Next Monday at midday we’ll announce the winner of this week’s Stat of the Week competition, and start a new one.

(more…)

Stat of the Week Competition Discussion: November 10 – 16 2012

If you’d like to comment on or debate any of this week’s Stat of the Week nominations, please do so below!

November 9, 2012

Thomas Lumley interviewed on Firstline

Auckland University statistician and the most regular contributor to Stats Chat, Professor Thomas Lumley, spoke to Firstline this morning.

Watch the interview or read the interview below:

“Now bear with us, because we’re about to talk statistics, but not the dry mathematics you might expect: it’s all about the art of picking an election winner.

In the US election, many commentators said the race was too close to call but there were some who picked the Obama victory almost perfectly like Nate Silver of the New York Times and Princeton’s Sam Wang. How did they get it right when others got it so wrong. Well for more on this I’m joined by Auckland University statistician Professor Thomas Lumley.

So people like Nate Silver and Sam Wang, were you surprised that they predicted it so accurately?”

Thomas: “No, it’s the sort of thing that you really can predict things accurately. There’s a lot of polling information in the United States, people do a lot of National polls, State polls and so on, and there’s a lot of history about how accurate they are so it is possible to put that information together.”

“So who is Nate Silver?”

Thomas: “He’s currently from the New York Times. He used to a run a separate blog called FiveThirtyEight.com and then got bought by the New York Times essentially. Before that, he was a baseball statistician, he did baseball prediction.

He was extremely close, he was actually lucky as well as smart. He was closer than he could have been just by being right: but he got every single state correct in the electoral college vote and Florida which hasn’t been decided yet, he predicted at almost exactly 50%.”

“So he’s making these correct calls and yet we’re reporting all the time: ‘too close to call’. How can there be such a gulf between what he does and what everyone else is saying?”

Thomas: “Partially, it’s what people aren’t used to what you can do by putting the poll information together. In the old days, people looked at one poll at a time, and there because of the biases in different polls and because each poll is relatively small, maybe 1000 or 5000 people you can’t tell very accurately.

But if you put them all together you can tell quite accurately unless something really novel happens – there’s a big change in who goes out to vote or something. [This is what’s called] meta-polling: putting polls together. People have been picking polls with what they would like to believe and one of the things about Nate Silver is that he’s very good at distinguishing what he wants to be true from what there’s actually data about.”

“George Will of the Washington Post said Romney would win with 320 electoral votes, another one from the New York Post said 325. They’re way off.”

Thomas: “They’re way off and those people are off more than a reliance on a single poll could be. Part of the issue is that one of the things that political journalism is valuable about it is that people talk to inside sources and learn what people inside the parties are saying and cross check it. But it doesn’t actually help in this case because there isn’t any inside information, the parties don’t know any more than the pollers do.”

“Would something similar work for New Zealand elections?”

Thomas: “It would work and there’s a couple of websites which are trying to do it. It wouldn’t work quite as well probably because there are fewer polls in New Zealand. Because New Zealand’s smaller and the polls still have to be 1000 or so people, you can’t afford as many polls in a New Zealand as a US one. There isn’t as much information. It would still work better than a single poll though.

November 7, 2012

BMJ to require clinical trial data be made available

I’ve been following with interest the British Medical Journal‘s bold new move to refuse to publish research on drugs unless the clinical trial data is made available for independent analysis from January 2013. This is great news for other researchers, scientists and statisticians wanting to independently analyse and verify findings from studies.

In an editorial, the journal says they want to “leverage their power and publish only where there is a commitment to make the relevant anonymised patient level data available on reasonable request.” Further, they are campaigning for open data using Tamiflu as an important case study after being frustrated with years of trying to get drug company Roche to fulfill its promise to release full clinical trial results.

The BMJ quotes Ben Goldacre’s new book Bad Pharma:

“Drug companies around the world have produced some of the most amazing innovations of the past fifty years, saving lives on an epic scale. But that does not allow them to hide data, mislead doctors, and harm patients.”

Goldacre is one of a group of campaigners in the UK currently pushing the government to legislate for true transparency regarding clinical trials.

Watch a recent TED video from Ben Goldacre on the other “scandalous” problem of unreported trials of negative or inconclusive drug trial findings:

I believe Media Watch will be covering this story this weekend too.

Ben’s blog, Bad Science is always excellent reading, and I am looking forward to reading his newest book and hope that the BMJ’s campaign is successful.

November 5, 2012

Stat of the Week Competition: November 3 – 9 2012

Each week, we would like to invite readers of Stats Chat to submit nominations for our Stat of the Week competition and be in with the chance to win an iTunes voucher.

Here’s how it works:

  • Anyone may add a comment on this post to nominate their Stat of the Week candidate before midday Friday November 9 2012.
  • Statistics can be bad, exemplary or fascinating.
  • The statistic must be in the NZ media during the period of November 3 – 9 2012 inclusive.
  • Quote the statistic, when and where it was published and tell us why it should be our Stat of the Week.

Next Monday at midday we’ll announce the winner of this week’s Stat of the Week competition, and start a new one.

(more…)

Stat of the Week Competition Discussion: November 3 – 9 2012

If you’d like to comment on or debate any of this week’s Stat of the Week nominations, please do so below!

November 1, 2012

Hurricane Sandy Signals

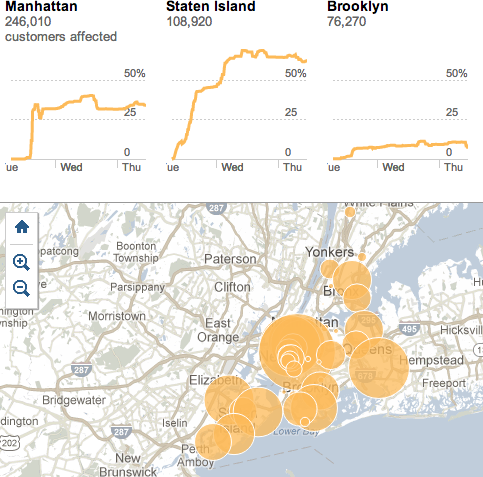
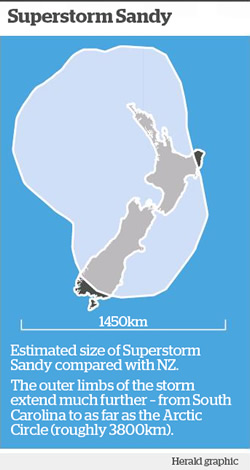
Despite all the media coverage of Hurricane Sandy, I found it hard to get a sense of the scale of the storm and the destruction it caused – there’s plenty of noise, but hard to find the signals.

A few sources of information I’ve found useful are:

A map in yesterday’s NZ Herald giving useful size context to the storm:

The New York Times is real-time graphing and mapping the number of customers affected by power outages in New York city after Hurricane Sandy:

For another good overview divided by different types of damage in New York city, see: Assessing the Damage From Hurricane Sandy.

Google has an interactive crisis map.

There were not-so-useful statistics being used such as “Facebook Sees Mentions of ‘Hurricane Sandy’ Spike 1 Million Percent”.

The Atlantic does a nice job of verifying social media photos of Sandy.

Have you found any good resources online for getting a sense of the scale and destruction of Hurricane Sandy? Let me know!

October 29, 2012

Stat of the Week Competition: October 27 – November 2 2012

Each week, we would like to invite readers of Stats Chat to submit nominations for our Stat of the Week competition and be in with the chance to win an iTunes voucher.

Here’s how it works:

  • Anyone may add a comment on this post to nominate their Stat of the Week candidate before midday Friday November 2 2012.
  • Statistics can be bad, exemplary or fascinating.
  • The statistic must be in the NZ media during the period of October 27 – November 2 2012 inclusive.
  • Quote the statistic, when and where it was published and tell us why it should be our Stat of the Week.

Next Monday at midday we’ll announce the winner of this week’s Stat of the Week competition, and start a new one.

(more…)

Stat of the Week Competition Discussion: October 27 – November 2 2012

If you’d like to comment on or debate any of this week’s Stat of the Week nominations, please do so below!