Posts written by Atakohu Middleton (125)

avatar

Atakohu Middleton is an Auckland journalist with a keen interest in the way the media uses/abuses data. She happens to be married to a statistician.

January 6, 2016

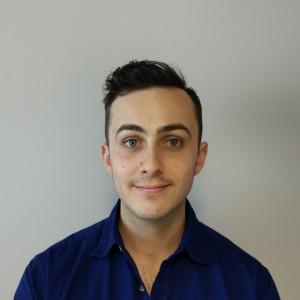
Meet Statistics summer scholar Katie Fahy

Every summer, the Department of Statistics offers scholarships to a number of students so they can work with staff on real-world projects. Katie, right, is working on the New Zealand Socio-Economic Index with Dr Barry Milne of COMPASS (Katie FahyCentre of Methods and Policy Application in the Social Sciences) and Professor Alan Lee from the Department of Statistics. Katie explains:

“The New Zealand Socio-Economic Index (NZSEI) assigns occupations a score that enables us to measure the socio-economic status of people in that occupation. It’s calculated using the average age, income and education level of people with each job. For example, doctors would have a very high socio-economic index, because they’re typically high-earning and well-educated people.

“The NZSEI has been created from Census data since the 90s, but has not yet been updated for the most recent Census in 2013. In this project, my job is to update the NZSEI using path analysis, and check that this updated version is appropriate for all people in New Zealand. A couple of examples include assessing that the index is valid for all ethnicities, and valid for workers in both urban and rural regions.

“The index is important to measure any changes to New Zealand over time, as it is updated with each Census. As well as this, the NZSEI uses a similar methodology to international scales, so international comparisons are possible.

“I am currently in my third year of studying Mathematics and Statistics at the University of Sheffield in England, and I’m halfway through my year here in Auckland as an exchange student. I’ve always been interested in Statistics and studying it at university level has shown me how applicable it is in a variety of fields, from finance to biology.

“Over the summer, I’m looking forward to exploring New Zealand more.”



January 3, 2016

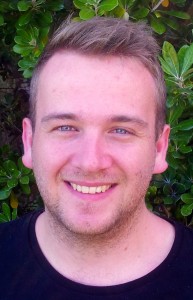
Meet Statistics summer scholar Jale Basten

Jale BastenEvery summer, the Department of Statistics offers scholarships to a number of students so they can work with staff on real-world projects. Jale, right, is exploring evolutionary relationships with Dr Steffen Klaere. Jale explains: 

“To understand the evolution of life on earth, we need to make inferences about evolutionary events leading up to the diversity of life we see now. My project is about phylogenetic inference – the set of bioinformatic tools for estimating evolutionary relationships between different species, or taxa.

“The set of taxa and their divergence is usually represented by a DNA-sequence alignment. The basic assumption is that each sequence represents a taxon and the evolutionary divergence between species is identified by differences in the respective sequences. The relatedness of taxa is then represented by a phylogenetic tree, where closely-related species are identified with leaves that are close together in the tree.

“In my project, I will investigate different statistics to assess the fitness between model and data. In particular, I am interested in identifying sites in the alignment that are not well represented by the model.

“It has been established that alignments for species with an old, most common recent ancestor will have more sites that will not inform the phylogenetic hypothesis. Such sites are often called saturated sites due to the assumption that they accumulated a lot of mutations over time. It has been hypothesised that such sites can lead to systematic error in the inference.

“That is why we want to identify influential outliers and mask them for the inference. Statistics like observed variability (OV) distances have been proposed, which are easier to compute, but tend to overestimate the number of saturated sites.

“My task will be to investigate methods that propose to identify saturated sites and test them on datasets known to suffer from systematic error. In particular, I want to test the utility of combining different statistics to address such problems.

“I am from Duelmen in Germany, but I have lived and studied in Greifswald for the past three years. I have just completed my Bachelor of Science in Biomathematics at the University of Greifswald. After this research project, I would like to pursue my Master of Science in Statistics at the University of Dortmund, also in Germany.

“What I like about statistics is that it has a wide area of use and deals with diverse topics in biology, medical science and economics. Furthermore, I like that statistics deals with all aspects of data, including the planning of data collection in terms of the design of surveys and experiments. You can work together with people from different institutions and you benefit from the different knowledge they bring.

“As I have some free time over Christmas and New Year, I am thinking about travelling to the Bay of Islands to spend some time at the beaches and enjoy the beautiful countryside. After the research project, I will also have some time to travel to the South Island before flying back to Germany.”


August 19, 2015

World Statistics Day – October 20, 2015

What are you doing on October 20? Statisticians all over the world will be showcasing the value of their work under the theme ‘Better data, better lives’. Quite. Here is the logo for this year, downloadable from the UNStats site here.

WSD_Logo_Final_Languages_Outline


The World Statistics Day was proclaimed by the United Nations General Assembly in 2010 – so, fairly recently – to recognise the importance of statistics in shaping our societies. National and regional statistical days already existed in more than 100 countries, but the General Assembly’s adoption of this international day as 20 October brought extra momentum. That first World Statistics Day in October 2010 was marked in more than 130 countries and areas.

According to UNStats, this year marks an important cornerstone for official statistics, with the conclusion of the Millennium Development Goals (see how countries have fared here), the post-2015 development agenda, the data revolution (see what the Data Revolution Group set up by UN Secretary-General Ban Ki-Moon has to say here), the preparations for the 2020 World Population and Housing Census Programme and the likes.

Statschat hasn’t heard a lot about what might be happening in New Zealand and elsewhere – it might yet be a bit too early for announcements – but if you are running an event or know of one, please let us know. In the meantime, one cute initiative of UNStats is to translate the English logo into many of the languages of the world. We couldn’t miss the opportunity to have UNStats do ours in the first language of this country, te reo Māori. Te tino kē hoki o te moko nā! (Nice logo!)


WorldStatsDay_Logo_Maori-01

June 15, 2015

Verbal abuse the biggest bullying problem at school: Students

StatsChat is involved with the biennial CensusAtSchool / TataurangaKiTeKura, a national statistics education project for primary and secondary school students. Supervised by teachers, students aged between 9 and 18 (Year 5 to Year 13) answer 35 questions in English or te reo Māori about their lives, then analyse the results in class. Already, more than 18,392 students from 391 schools all over New Zealand have taken part.

This year, for the first time, CAS asked students about bullying, a persistent problem in New Zealand schools.

School students think verbal mistreatment is the biggest bullying issue in schools – higher than cyberbullying, social or relational bullying such as social exclusion and spreading gossip, or physical bullying.

Students were asked how much they agreed or disagreed with statements about each type of bullying.  A total of 36% strongly agreed or agreed that verbal bullying was a problem among students at their school, followed by cyberbullying (31% agreed or strongly agreed), social or relational bullying (25% agreed or strongly agreed) and physical bullying (19% agreed or strongly agreed).

Read the rest of the press release here.


February 27, 2015

CensusAtSchool 2015 launches soon!

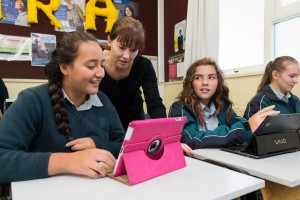
It’s nearly CensusAtSchool time again!  CAS is a biennial educational project in te reo Māori and English that turns school students into data detectives, using real-world, anonymised data about them, their peers, and their world.123_UoAStats_6May13 -low res

This is how it works: In the classroom, using any sort of internet-enabled digital device, and under the supervision of teachers, students fill in a confidential questionnaire in English or te reo Māori.

Some questions involve practical skills, such as weighing their schoolbags and measuring their arm span. Some questions ask about their day-to-day lives: How do they get to school? Where did they eat their dinners the night before? Do they think bullying is a problem in their school? And, given that this is a major sporting year: Which two teams will contest the Rugby World Cup final?

The database is then made available for students and their teachers to undertake statistical investigations, which is an important part of the statistics strand of the curriculum.

Teachers, this year’s Census starts on March 16, and can be completed any time this year. It’s free and you can register at www.censusatschool.org.nz. For everyone else, CAS always attracts great mainstream media interest – we’ll post the best stories here as they crop up.081_UoAStats_6May13low res

CensusAtSchool is an international educational project that began in the UK in 2000, based on a 1990 trial project by Dr Sharleen Forbes, then of Statistics New Zealand. It is now run in the UK, Ireland, Australia, Canada, South Africa, Japan and the US, as well as  New Zealand.

February 25, 2015

Wiki New Zealand site revamped

We’ve written before about Wiki New Zealand, which aims to ‘democractise data’. WNZ has revamped its website to make things clearer and cleaner, and you can browse here.

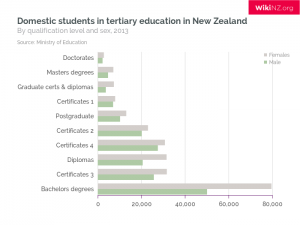
As I’m a postgraduate scarfie this year, the table on domestic students in tertiary education interested me – it shows that women (grey) are enrolled in greater numbers than men at every single level. Click the graph to embiggen.

Founder Lillian Grace talks about the genesis of Wiki New Zealand here, and for those who love the techy  side, here’s a video about the backend.


png


February 4, 2015

Meet Statistics summer scholar Christopher Pearce

Chris PearceEvery year, the Department of Statistics offers summer scholarships to a number of students so they can work with staff on real-world projects. Christopher, right, is working on the OpenAPI project with Associate Professor Paul Murrell. Chris explains:

“Government data is becoming increasingly available. However, this does not mean it is readable – few individuals possess the knowledge and skills to make use of these data by themselves.

“In an ideal world, the code used by fellow statisticians would be available to everyone. It would be even more ideal if it were transferable. Sites like Wiki New Zealand  are doing a remarkable job of displaying some of New Zealand’s trends, but with no source code it can sometimes be impossible to recreate.

“The OpenAPI project is developing a flow-based framework that is primarily aimed at lowering the barriers to use of open data by the general public. My project is about creating an architecture for programmers and statisticians of all levels. Our goal is for anyone interested to have the ability to perform analyses on open government data. The idea is that there are publicly available snippets of code from fellow statisticians that can be easily linked in a meaningful way. The less expertise required by the end user, the better.

“My job is to come up with questions I am interested in answering, then figuring out how a potential lay observer would solve them. So far it has yielded some interesting results.

“I’m a third-year student at the University of Auckland, studying a Bachelor of Laws/Bachelor of Science conjoint. My skills lie in statistics and computer science, but I need the literal side to keep a balanced life.

“I got hooked on statistics when I discovered the Poisson distribution. There’s something about statistics that never seems to get old, and I’m discovering new things every day. It’s nice knowing I can actually attempt an answer to the curiosities in my head.”

February 3, 2015

Meet Statistics summer scholar Daniel van Vorsselen

Every year, the Department of Statistics offers summer scholarships to a number of students so they can work with staff on real-world projects. Daniel, right, is working on a project called Working with data from conservation monitoring schemes with Associate Professor Rachel Fewster. Daniel explains:

Daniel Profile Picture“The university is involved in a project called CatchIT, an online system that aims to help community conservation schemes by proving users with a place where they can input and store their data for reference. The project also produces maps and graphics so that users can assess the effectiveness of their conservation schemes and identify areas where changes can be made.

“My role in the project is to help analyse the data that users put into the project. This involves correctly formatting and cleaning the data so that it is usable. I assist users in the technical aspects relating to their data and help them communicate their data in a meaningful way.

“It’s important to maintain and preserve the wildlife and plant species we have in New Zealand so that future generations have the opportunity to experience them as we have. Our environments are a defining factor of our culture and lifestyles as New Zealanders and we have a large amount of native species in New Zealand. It would be a shame to see them eradicated.

“I am currently studying a BCom/BA conjoint, majoring in Statistics, Economics and Finance. I’m hoping to do Honours in statistics and I am looking at a career in banking.

“Over summer, I hope to enjoy the nice weather, whether out on the boat fishing, at the beach or going for a run.”


February 2, 2015

Meet Statistics summer scholar Ole Geldschlager

OleEvery year, the Department of Statistics offers summer scholarships to a number of students so they can work with staff on real-world projects. Ole, right, is working on a project called Testing data-model fitness in phylogenetics with Dr Steffen Klaere. Ole explains:

“A continuously elusive question in phylogenetic inference is how to test data-to-model fitness. While there have been omnibus tests available for more than 20 years, their applicability was restricted due to issues of power and computability of the test statistics.

“In recent work, we have assessed the fitness of each site (or observation) separately by fitting simultaneous confidence regions.

“However, the more appropriate choice would be to do informed multiple testing on the sites and identify those sites for which the test finds evidence against model fitness. My task is to investigate a number of potential tests and assess their strength and weaknesses through simulation approaches.

“The maximum likelihood approach for phylogenetic inference resembles to some degree a logistic regression approach. Here, one uses deviance measures to assess the model-data fitness. Such approaches have been tested in phylogenetics as well, however, they often ignore the fact that the data are over-dispersed and zero-inflated.

“Consequently, in my project I will investigate the suitability of corrections to the deviance made by ecologists to account for overdispersion and zero-inflation to build statistics which are suitable to test model-data-fitness in phylogenetics.

“I am studying a masters in mathematics at the Ernst-Moritz-Arndt University Greifswald in Germany. I have a bachelor’s degree in biomathematics, also from Greifswaldl.

“Statistics is one of my favourite topics in mathematics. Statistics plays a big role in finance, economy and nature, and that’s why I want to learn and understand statistics.

“Over summer, I am looking forward to travelling around New Zealand. I want to learn more about this exciting country – it is completely new to me.”


January 30, 2015

Meet Statistics summer scholar Ying Zhang

Ying Zhang Photo

Every year, the Department of Statistics offers summer scholarships to a number of students so they can work with staff on real-world projects. Ying, right, is working on a project called Service overview, client profile and outcome evaluation for Lifeline Aotearoa Face-to-Face Counselling Services  with the Department of Statistics’ Associate Professor David Scott and Christine Dong, research and clinical engagement manager, Lifeline and also an Honorary Research Fellow in the Department of Psychological Medicine at the University of Auckland. Ying explains:

“Lifeline New Zealand is a leading provider of dedicated community helpline services, face-to-face counselling and suicide prevention education. The project aims to investigate the client profile, the clinical effectiveness of the service and client experiences of, and satisfaction with, the face-to-face counselling service.

“In this project, my work includes three aspects: Data entry of client profiles and counselling outcomes; qualitative analysis of open-ended questions and descriptive analysis; and modelling for the quantitative variables using SAS.

“Very few research studies have been done in New Zealand to explore client profiles or find out clients’ experiences of, and satisfaction with, community face-to-face counselling services. Therefore, the study will add evidence in terms of both clinical effectiveness and client satisfaction. This study will also provide a systematic summary of the demographics and clinical characteristics of people accessing such services. It will help provide direction for strategies to improve the quality and efficiency of the service.

“I have just graduated from the University of Auckland with a Postgraduate Diploma in Statistics.  I got my bachelor and master degrees majoring in information management and information systems at Zhejiang University in China.

“My first contact with statistics was around 10 years ago when I was at university in China. It was an interesting but complex subject for me. After that, I did some internship work relating to data analysis. It helped me accumulate more experience about using data analysis to help inform business decisions.

“This summer, apart from participating in the project, I will spend some time expanding my knowledge of SAS – it’s a very useful tool and I want to know it better. I’m also hoping to find a full-time job in data analysis.”