Posts written by Atakohu Middleton (125)

avatar

Atakohu Middleton is an Auckland journalist with a keen interest in the way the media uses/abuses data. She happens to be married to a statistician.

September 3, 2012

Top of the table: David Scott’s Super 15 success

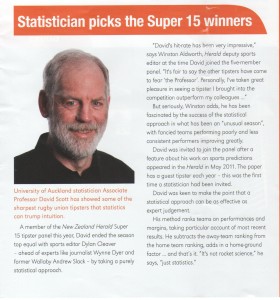
This appeared in Uni News,  the internal University of Auckland magazine sent to a wide outside audience, a week or so after the end of the Super 15. David came top equal with sports writer Dylan Cleaver, and says he’ll be spending time over this summer “looking at some possible improvements to the prediction method”. Watch this space!


August 15, 2012

How the Aussies topped the medal table (sort of) …

Wit from the Sydney Morning Herald:

How Australia topped the medal tally

Who was the real winner from the London Olympic Games? According to a ground-breaking analysis of the official medal tally by a BusinessDay statistician, the most successful nation at the Olympics was … Australia!

Statistics can be used to tell a lot more than one story, of course. Other nations will try to claim victory using lesser formulations. Based on the number of athletes per medal, for example, China will claim it is the winner. Despite occasional murmurs of complaint at being fleeced out of gold, the Peoples’ Republic needed just 4.5 athletes to win a medal of any colour.

From its team of 396 athletes, the Chinese needed 10 athletes to win each of their gold medals. Next best among the top 25 nations at the Olympics was the US, which needed 12 athletes for each gold and 5.1 athletes for all medals. The American team was by far the biggest with 530 athletes.

The 410-strong Australian squad required 12 athletes for a medal, and 59 athletes for each gold medal. It has been well publicised that the 2012 Olympics were a bit lacking on the gold medal front, at least by Australia’s historical standards. Naturally, the proponents of sports funding are therefore calling on government to dig deep – to buy some more medals at the next Games.

Read the rest here.

August 14, 2012

London 2012 and data journalism: What did we learn at the Olympics?

Fascinating item in The Guardian, which looks at the Olympics from a data journalist’s point of view …. and does a great job.


August 5, 2012

Statistics New Zealand’s alternative medal table …

A big gold medal to Statistics New Zealand for its daily tally of Olympic  medals by population (the most usual table is number of medals won), with the numbers sliced and diced different ways. Whichever way you slice and dice, the Aussies will still be cross.


Total medals per 1 million - day 6

July 31, 2012

Commuter survey ‘can’t be trusted’ – statistician

This just in from National Business Review – thanks to journo Caleb Allison and  NBR Online for giving us permission to upload the content, which sits behind a pay wall.

Commuter survey ‘can’t be trusted’ – statistician 

A statistician questions the validity of a survey promoting flexible working conditions for employees.

A recent survey by Regus – which describes itself as “the world’s largest provider of flexible workspaces” – said 67% of New Zealand employees would spend more time with family if they had a shorter commute as a result of flexible working conditions.

While the survey claimed to have polled more than 16,000 people in 80 countries, NBR ONLINE can reveal the company polled just 54 people in New Zealand.

Auckland University’s Dr Andrew Balemi says while it is a very low number, that alone does not suggest the poll is dodgy.

“Most people obsess about the sample size, but what I obsess about is the sample quality,” Dr Balemi says.

The only way to know if the information is credible is to know how the company undertook the survey.

However, the methodology was not included with the poll.

Dr Balemi says not only does this survey have a small sample size, it doesn’t tell the reader how it was obtained.

“In the absence of any explanation of how they’ve collected the data I wouldn’t trust this information.

“If they can’t even do that, I wouldn’t dignify it with any more consideration.”

He says the company may have a valid methodology and the poll could be worthy, but they should have included that information in the survey.

This follows another recent example of dodgy polling by the Auckland Council.

A press release claiming 63% of Aucklanders favour mayor Len Brown’s city rail loop turned out to have surveyed only 112 people.
July 16, 2012

Euro-zone debt crisis hits number-crunchers, too …

Here’s a different statistical take on the Euro-zone crisis:

Debt crisis: Italy’s statisticians threaten ‘stats black-out’

Italy’s official statisticians are threatening to down calculators and stop reporting on its stricken economy – as they themselves fall victim to the recession they are paid to track. 

Read the details here.


Ewen Macdonald: (Vile) trial by opinion poll

This appeared on stuff.co.nz and in Fairfax papers last week:

After a harrowing trial that gripped the nation, a survey has revealed just one in five New Zealanders think Ewen Macdonald did not murder his brother-in-law Scott Guy.

A jury of 11 handed down a not guilty verdict to Macdonald, 32, last week, after a month-long trial in the High Court at Wellington.

But results to be made public by market research company UMR today show just 20 per cent of people surveyed agreed with Ewen Macdonald being acquitted of slaying Mr Guy outside his rural Feilding home in July 2010.

Living in New Zealand means agreeing to deal with criminal allegations transparently in the courtroom, not the court of (ill-informed, speculative) public opinion. The only people with the information on which to make an informed opinion are members of the jury – and they have delivered a verdict that police will not appeal.  What was UMR thinking?

July 8, 2012

Genetic variants and health – what are the links?

How do genetic variants affect biology and health? Is personalised medicine just around the corner?

Thomas Lumley, prolific statschat.org.nz contributor and University of Auckland biostatisician, gives a primer to Kim Hill and her listeners on Radio New Zealand.

April 22, 2012

Does that medication really work?

How do we know whether a particular drug, therapy or operation really works, and how well? How reliable is the evidence? Are clinical trials truly unbiased?

Recommended for their plain-language approach to answering these questions are  Testing Treatments: Better research for better healthcare by three doctors and a health advocate, and the University of Sydney’s Smart Choices: Making sense of health advice.

And even better, both are free downloads.

February 20, 2012

Stats crimes – we need your help

What do you think are the biggest media/public misunderstandings around statistics? We know that some statistical concepts can be quite hard to understand (and a bit of a challenge to teach); we’d like to compile a list of the top stats misunderstandings so we can accurately focus some media education projects we are planning ….

Some examples that have already been raised:

  • Misunderstanding correlation and causality: All too often causality will be assigned where a study has merely shown a link between two variables.
  • Abuse/misuse of the term “potentially fatal”: While many activities/diseases could possibly result in death, the odds should be considered in the context of a developed country with reasonable health-care.
  • How to know when something is statistically significant and when not.
  •  How to know when you are looking at  “junk” statistics …

Please share your ideas below …