Posts written by Atakohu Middleton (125)

avatar

Atakohu Middleton is an Auckland journalist with a keen interest in the way the media uses/abuses data. She happens to be married to a statistician.

April 26, 2013

That TV3 poll on racism? Bogus!

The Herald today ran this story claiming that people think New Zealand is a racist country, based on the results of a survey run  for TV3’s new show The Vote. Viewers voted through Facebook, Twitter, The Vote website or by text.

I haven’t watched The Vote, but I would like to know whether its journalist presenters, presumably fans of accuracy, point out that such self-selecting  polls are unscientific – the polite term for bogus. The best thing you can say is that such polls allow viewers to  feel involved.

But that’s not a good thing if claims made as a  result of these polls lead to way off-beam impressions being planted in the public consciousness; that’s often the way urban myths are born and prejudice stoked.

I’m not saying that racism doesn’t exist in New Zealand, but polls like this  offer no insight into the issue or, worse, distort the truth.

It’s disappointing to see the Herald, which still, presumably, places a premium on accuracy, has swallowed The Vote press release whole, without  pointing out its shortcomings or doing its homework to see what reliable surveys exist. TV3 must be very pleased with the free publicity, though.

April 8, 2013

Kiwi students hold their own census

What are Kiwi kids’ most common food allergies? What time do they go to sleep at night? How long can they stand on their left leg with their eyes closed?

Many thousands of students aged between 10 and 18 (Year 5 to Year 13) are due to start answering these questions – and a host of others about their lives – on Monday May 6, the first day of the new term and the day CensusAtSchool 2013 begins.

So far, 461 schools have registered to take part. The 32-question survey, available in English and Māori, aims to raise students’ interest in statistics and provide a fascinating picture of what they are thinking, feeling and doing. Teachers will administer the census in class between May 6 and June 14.

“A good way to engage students in mathematics and statistics is to start from a place that’s familiar to them – their own lives and the lives of their friends,” says co-director Rachel Cunliffe, a University of Auckland-trained statistician.“Students love taking part in the activities and then, in class with their teachers, becoming “data detectives” to see what stories are in the results – and not just in their own classroom, but across the country.”

This year, students are being asked for the first time about food allergies to reflect the lack of data on the issue, says Cunliffe. “Students will be able to explore the dataset to compare the prevalence of self-reported allergies for different ages, ethnicities and sexes.”

Westlake Girls High School maths teacher Dru Rose is planning for about 800 Year 9 and 10 students to take part. She’s keen to see the data that will emerge from two other new questions about how many hours of homework students did the night before, and how many hours sleep they had. “It’s real-life stuff,” she says. “We’ll be able to examine the data and see if there are any links.”

Andrew Tideswell, manager of the Statistics New Zealand Education Team, says our  statistics curriculum is world-leading, and CensusAtSchool helps teachers and students get the most out of it.

“By engaging in CensusAtSchool, students have an experience that mirrors the structure of the national census, and it encourages them to think about the need for information and ways we might use it to solve problems,” he says. “Students develop the statistical literacy they need if New Zealand is to be an effective democracy where citizens can use statistics to make informed decisions.”

CensusAtSchool, now in its sixth edition, is a biennial collaborative project involving teachers, the University of Auckland’s Department of Statistics, Statistics New Zealand and the Ministry of Education. It is part of an international effort to boost statistical capability among young people, and is carried out in Australia, the United Kingdom, Canada, the US, Japan and South Africa.
 

March 15, 2013

Policing the pollsters … your input sought

This is from Kiwiblog:

A group of New Zealand’s leading political pollsters, in consultation with other interested parties, have developed draft NZ Political Polling Guidelines.

The purpose is to ensure that Association of Market Research Organisations and Market Research Society of New Zealand members conducting political polls, and media organisations publishing poll results, adhere to the highest “NZ appropriate” standards. The guidelines are draft and comments, questions and recommendations back to the working group are welcome.

This code seeks to document best practice guidelines for the conducting and reporting of political polls in New Zealand. It is proposed that the guidelines, once approved and accepted, will be binding on companies that are members of  AMRO and on researchers that are members of MRSNZ.

February 3, 2013

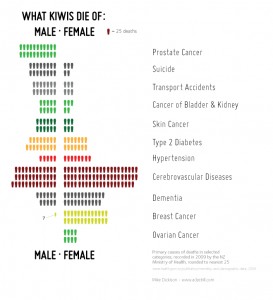
What do Kiwis die of?

University of Auckland research scientist Dr Siouxsie Wiles (she’s the one who makes bacteria glow in the dark) has teamed up with data visualisation expert Mike Dickison to create a series of infographics looking at the morbidly fascinating topic of what New Zealanders die from.

Here’s one (click to enlarge). See the whole post on Siouxsie’s blog Infectious Thoughts  here.

battle-of-the-sexes-infographic1

January 30, 2013

How stats made Auckland City Hospital’s heart unit more efficient: Radio New Zealand

When Auckland City Hospital was experiencing a cardiac-surgery cancellation rate approaching 30%,  staff decided to ask a statistician for help.  The University of Auckland’s Ilze Ziedins is an expert in queuing theory and probability who often works in areas such as telecommunications and traffic; she jumped at the chance to collaborate on a problem that involved people.

Ilze and two of her graduate students, William Chen and Kim Frew, set out to develop a mathematical model of the Cardiavascular Intensive Care Unit using R, a statistical environment and programming language initially developed at The University of Auckland by Ross Ihaka and Robert Gentleman.

The model used real-life data to investigate different staffing and resourcing scenarios, and as a result was able to confirm what hospital staff had suspected – that the Cardiac Intensive Care Unit was the bottleneck creating problems. The model was also able to suggest an optimal staffing regime that took into account the irregular arrival of people in the unit, either from the operating theatre or as the result of an emergency. As a result, ICU director Andrew Kee and other team members were able to allocate more staff and reduce the cancellation rate to about 10%.

Alison Ballance, of Radio New Zealand show Our Changing World,  went to Auckland City Hospital to meet Ilze Ziedins and Cardiovascular Services Manager Pam Freeman. Listen to the 13-minute interview here.

January 14, 2013

More about Lotto numbers …

From today’s New Zealand Herald:

Five Lotto numbers prove very lucky

Two Saturdays in a row, five of the same numbers were drawn in Lotto.

But a statistician says the chances of that happening aren’t as high as they may seem – 1 in 5500 ….

Said statistician is our very own Russell Millar. The rest of the story is here


November 27, 2012

Stats Chat at national journalism teachers’ conference

Polls and surveys making various claims land on journalists’ desks every day – but not all of them are newsworthy (and the bogus, PR-driven ones that make it into print are subsequently shredded in this very forum).

The statschat.org.nz team is always keen to help people understand the difference between a reliable poll and something that should be filed in the bin. So we’re delighted that two members of the statschat.org.nz team, Andrew Balemi, a polls and surveys expert from the Department of Statistics at The University of Auckland, and adviser Julie Middleton have been given an hour at this Wednesday’s Journalists Training Organisation/Journalism Education Association conference to talk about polls and surveys.

They’re not going to each anyone to crunch numbers. What’s far more important is knowing the right questions to ask about a poll or survey to determine whether it should be taken seriously.

This is the hand-out we are providing – we have only an hour, so the list of questions isn’t complete, but it gives you an idea of how we encourage journalists to think.

Questions a reporter should ask of a poll or survey

Why is the poll/survey being done?
What do the pollsters want to find out?

Who is doing the survey?
Who paid for the survey?
Who carried out the work?
Is the person/company that carried out the survey a member of the Market Research Society of New Zealand? (ie, is it subject to a code of ethics?)

What we’re looking for: Evidence of lobbying, misinformation, public-relations or marketing spin … or just a company hoping to get editorial when it should buy an ad.

How representative is the sample?
How were those to be polled/surveyed chosen?
From what area (nation, state, or region) or group (teachers, National voters etc) were these people chosen?
How were the interviews conducted? (Internet survey, face-to-face, by phone)…

What we’re looking for: Evidence that the poll/survey is based on a genuinely representative random sample and has been conducted according to sound statistical principles. Be wary if you can’t get the original research questionnaire, raw data and a full explanation of methods.

If possible, ask about the broader picture
Does this study reflect the findings of other polls/surveys on this topic?

What we’re looking for: Evidence of similar findings elsewhere. 

Is this poll/survey worth reporting?
If you get positive responses to the above, yes. If not, this question becomes a philosophical one: Do you ignore accuracy for a sexy subject? Or run a story based on a bogus survey with a long list of caveats?

Don’t be afraid to ask professional statisticians for advice and help. They will generally be flattered – and pleased that you are taking such care.

October 5, 2012

What happened when MPs took a maths exam

This just in from the BBC:

Could it be that Labour leader Ed Miliband’s demand that all school pupils must study maths until they are 18 has been prompted by new evidence that his own MPs struggle with numbers?

The man in charge of the party’s policy review, Jon Cruddas, admitted this weekend that he is “barely numerate”. And when the Royal Statistical Society (RSS) recently tested the ability of honourable members to answer a relatively simple mathematical question, only a quarter of Labour MPs got it right.

Read the rest of the yarn here.

September 5, 2012

How to win Lotto … sort of

From today’s Herald …

Choose carefully, $23m is at stake

Today’s $23 million Big Wednesday draw is the fourth-largest prize in Lotto history.

And while there is no secret way to guarantee hitting the jackpot, a mathematician says you can boost chances of not having to share any cash you do win.

Associate Professor of Statistics at the University of Auckland David Scott said: “There’s no way of increasing your chances of winning but it’s possible to increase your chances of getting more money and not having to share it.

“Avoid the numbers of 1 up to 30, where people choose their birthdays.”

Read the rest of the story here.


September 3, 2012

Gee, thanks!

Stats Chat has had a few nice mentions in dispatches over the past few days, and in this blog-eat-blog world, we thought we oughta share them.

Thanks to Janet McAllister for describing us, along with a couple of other blogs, as “excellent” and “useful” in her New Zealand Herald  column on the weekend.

And this from Public Address, Russell Brown’s thoroughly readable  blog, about his sneak preview of the new, tabloid Herald: The new pages better accommodate the use of infographics – and, happily, editorial staff will have received three training sessions in the use of statistics by the time the paper relaunches. This ought to be a more productive relationship between the Herald and the University of Auckland’s Statistics faculty than the paper having its homework constantly corrected in StatsChat.

Stats Chat just might have run one of those training sessions, on the Monday before last, and we  just might have called it “Learning to Love Statistics: A workshop for journalists”. Thumbs up to the Herald – its journos have had, or are about to have, a session with Statistics New Zealand about how they can best use its marvellous online tools.

And we aren’t out to hassle the Herald, honestly. It’s just that we’re in Auckland, and the Herald’s published seven days a week, and we are still loyal subscribers to the old-fashioned paper product …