To trend or not to trend
David Whitehouse through the Global Warming Policy Foundation has recently released a report stating that “It is incontrovertible that the global annual average temperature of the past decade, and in some datasets the past 15 years, has not increased”. In case it is unclear, both the author and institute are considered sceptics of man-made climate change.
The report focuses on arguing the observation that if you look at only the past decade then there is no statistically significant change in global average annual temperature. Understanding what this does, or doesn’t, mean requires considering two related statistical concepts; 1) significant versus non-significant effects and 2) sample size and power.
Detecting a change is not the same as detecting no change. Statistical tests, indeed most of science, generally operates around Karl Popper’s falsification. Null hypotheses are set-up, generally a statement or test of the form ‘there is no effect’ and the alternative hypothesis is set-up in the contrary ‘there is an effect’. We then set-out to test these competing hypotheses. What is important to realise, however, is that technically one can never prove the null hypothesis, only gather evidence against it. In contrast however one can prove the alternative hypothesis. Scientists generally word their results VERY precisely. As a common example, imagine we want to show there are no sharks in a bay (our null hypothesis). We do some surveys, and eventually one finds a shark. Clearly our null hypothesis has been falsified, as finding a shark proves that there are sharks in the bay. However, let’s say we do a number of surveys, say 10, and find no sharks. We don’t have any evidence against our null hypothesis (i.e. we haven’t found any sharks..yet), but we haven’t ‘proven’ there are no sharks, only that we looked and didn’t find any. What if we increased it to say 100 surveys? That might be more convincing, but once again we can never prove there are no sharks, only demonstrate that after a large number of surveys (even 1,000, or 1,000,000) its highly unlikely there are any. In other words, as we increase our sample size, we have more ‘power’ (a statistical term) to be confident that they represent the underlying truth.
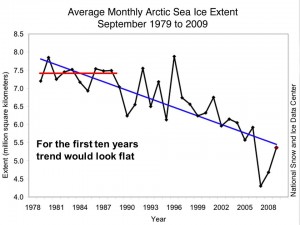
And so in the case of David Whitehouse’s claim we see similar elements. Just because an analysis of the last decade of global temperatures does not find a statistically significant trend, does not prove there is none. It may mean there has been no change, but it might also mean that the dataset is not large enough to detect it (i.e. there is not enough power). Furthermore, by reducing your dataset (i.e. only looking at the last 10 years rather than 30) you are reducing your sample size, meaning you are MORE likely NOT to detect an effect. A cunning statistical sleight of hand to make evidence of a trend disappear.
I lecture these basic statistical concepts to my undergraduate class and demonstrate it graphically. If you put a line over any ten years of data, it probably could be flat, only once you accumulate enough data, say thirty years, does the extent of the trend become clear.
This point is actually noted by the report (e.g. see Fig. 16).
Essentially, the only point that the report makes is that if you look at a small part of the dataset (less than a few decades), you can’t make a statistically robust conclusion, since you will be within a low power margin of error. Most importantly, we must be able to detect trends early even when the power to detect them may be low. And as I have stated in earlier posts, changes in variability are as important a metric as changes in the average, and the former, which is predicted from climate change, will make detecting the latter, which is also predicted, even more difficult.

Recent comments on James Russell’s posts