Search results for foreign drivers (6)

March 25, 2015

Foreign drivers, yet again

From the Stuff front page

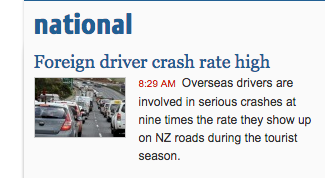
ninetimes

Now, no-one (maybe even literally no-one) is denying that foreign drivers are at higher risk on average. It’s just that some of us feel exaggerating the problem is unhelpful. The quoted sentence is true only if “the tourist season” is defined, a bit unconventionally, to mean “February”, and probably not even then.

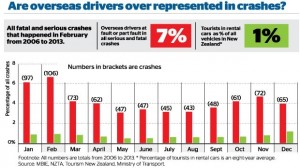
When you click through to the story (from the ChCh Press), the first thing you see is this:

1427225389525

Notice how the graph appears to contradicts itself: the proportion of serious crashes contributed to by a foreign driver ranges from just over 3% in some months to just under 7% at the peak.  Obviously, 7% is an overstatement of the actual problem, and if you read sufficiently carefully, the graphs says so.  The average is actually 4.3%

The other number headlined here is 1%: cars rented by tourists as a fraction of all vehicles.  This is probably an underestimate, as the story itself admits (well, it doesn’t admit the direction of the bias). But the overall bias isn’t what’s most relevant here, if you look at how the calculation is done.

Visitor surveys show that about 1 million people visited Canterbury in 2013.

About 12.6 per cent of all tourists in 2013 drove rental cars, according to government visitor surveys. That means about 126,000 of those 1 million Canterbury visitors drove rental cars. About 10 per cent of international visitors come to New Zealand in January, which means there were about 12,600 tourists in rental cars on Canterbury roads in January.

This was then compared to the 500,000 vehicles on the Canterbury roads in 2013 – figures provided by the Ministry of Transport.

The rental cars aren’t actually counted, they are treated as a constant fraction of visitors. If visitors in summer are more likely to drive long distances, which seems plausible, the denominator will be relatively underestimated in summer and overestimated in winter, giving an exaggerated seasonal variation in risk.

That is, the explanation for more crashes involving foreign drivers in summer could be because summer tourists stay longer or drive more, rather than because summer tourists are intrinsically worse drivers than winter tourists.

All in all, “nine times higher” is a clear overstatement, even if you think crashes in February are somehow more worth preventing than crashes in other months.

Banning all foreign drivers from the roads every February would have prevented 106 fatal or serious injury crashes over the period 2006-2013, just over half a percent of the total.  Reducing foreign driver risk by 14%  over the whole year would have prevented 109 crashes. Reducing everyone’s risk by 0.6%  would have prevented about 107 crashes. Restricting attention to February, like restricting attention to foreign drivers, only makes sense to the extent that it’s easier or less expensive to reduce some people’s risk enormously than to reduce everyone’s risk a tiny amount.


Actually doing something about the problem requires numbers that say what the problem actually is, and strategies, with costs and benefits attached. How many tens of millions of dollars worth of tourists would go elsewhere if they weren’t allowed to drive in New Zealand? Is there a simple, quick test would separate safe from dangerous foreign drivers, that rental companies could administer? How could we show it works? Does the fact that rental companies are willing to discriminate against young drivers but not foreign drivers mean there’s something wrong with anti-discrimination law, or do they just have a better grip on the risks? Could things like rumble strips and median barriers help more for the same cost? How about more police presence?

From 2006 to 2013 NZ averaged about 6 crashes per day causing serious or fatal injury. On average, about one every four days involved a foreign driver. Both these numbers are too high.
 

January 21, 2015

Tired foreign drivers

This one makes sense as a possibility

However, road safety campaigner Clive Matthew-Wilson today slammed the new website a “dangerous waste of time”.

He has repeatedly called for tourist drivers to be banned from driving vehicles within 24 hours of arriving in the country.

“Driving tired is as dangerous as driving drunk,” said Mr Matthew-Wilson.

Obviously it matters how tired vs how drunk, but fatigue certainly is unhealthy in drivers.

There’s also the issue that almost 50% of foreign tourists have only come from Australia, not a terribly arduous trip, and that there are almost as many Kiwis returning from Foreign Parts as there are Foreigners visiting. Still, banning car rentals within 24 hours of a sufficiently long flight is something that wouldn’t need to be restricted to foreigners and so wouldn’t require withdrawing from the UN Conventions on Road Traffic.

It would be surprising if tired foreign drivers weren’t at somewhat higher risk of a crash. We’d still want data to see how many crashes we’re talking about. Is this rule going to prevent 10 fatal crashes per year, or 1 per decade?

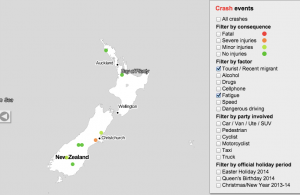
We can get an initial idea from the National Crash Map built by Richard Law and Andrew Parnell and feature in the Herald Data Blog on Christmas Day.

Here are all the crashes from December 2013 to July 2014 where both fatigue and being a foreign driver were judged to be contributing causes. It’s an overestimate, since it includes fatigue from all causes rather than just from recent arrival, and in a multi-car collision even includes fatigue in someone other than the foreign driver. Also, it’s based on police judgment and maybe they overestimate or underestimate fatigue as a cause.

It’s a start.

tired-foreign


Over this eight-month period there were no fatal crashes, one serious-injury crash, and two minor-injury crashes satisfying these criteria.

This is just two-thirds of one year, and a proper analysis would look at the data back to 2007 (or the more-limited data even further back). It’s still more data than the story provided.


January 6, 2015

Foreign drivers, again

The Herald has a poll saying 61% of New Zealanders want to make large subsets of foreign drivers sit written and practical tests before they can drive here (33.9%: people from right-hand drive countries; 27.4% everyone but Australians). It’s hard to tell how much of this is just the push effect of being asked the questions and how much is real opinion.

The rationale is that foreign drivers are dangerous:

Overseas drivers were found at fault in 75 per cent of 538 injury crashes in which they were involved. But although failure to adjust to local conditions was blamed for seven fatal crashes, that was the suspected cause of just 26 per cent of the injury crashes.

This could do with some comparisons.  75% of 538 is 403, which is about 4.5% of all injury crashes that year.  We get about 2.7 million visitors per year, with a mean stay of 20 days (PDF), so on average the population is about 3.3% short-term visitors.

Or, we can look at the ‘factors involved’ for all the injury crashes. I get 15367  drivers of motorised vehicles involved in injury crashes, and 9192 of them have a contributing factor that is driver fault (causes 1xx to 4xx in the Crash Analysis System). This doesn’t include things like brake failures.  So, drivers on average are at fault in about 60% of the injury crashes they are involved in.

Based on this, it looks as though foreign drivers are somewhat more dangerous, but that restricting them is very unlikely to prevent more than, say, 1-2% of crashes. If you consider all the ways we might reduce injury crashes by 1-2%, and think about the side-effects of each one, I don’t think this is going to be near the top of the list.

June 8, 2014

Foreign drivers

From the ChCh Press

Foreign drivers cause more fatal and injury crashes in the South Island than the national average – and the West Coast is the worst spot.

They don’t actually mean “more,” they mean “a higher proportion of”.

New Zealand Transport Agency (NZTA) safety directions chief adviser Lisa Rossiter said its crash statistics for the past 10 years showed foreign drivers were involved in about 6 per cent of all fatal or injury crashes in New Zealand, and were at fault in about 2 per cent.

On average, short-term visitors make up roughly 2.5% of people in New Zealand (2.78 million visitors in the year to April 2014, median visit of 9 days, so I’m guessing mean visit about two weeks). About another 2% of people in New Zealand are international students, who are at least sometimes counted as foreign drivers.

So, the risk seems to be a bit higher for foreign drivers, but probably not twice as high. Some of the excess can probably be explained by age: international students, backpackers, and drunk Australians in Queenstown are younger than the population average.

It’s different in parts of the South Island

The tourist hot spots of Otago and the West Coast fared worst.

A foreign driver was identified as a factor in 13 per cent of fatal crashes on the coast, and 5 per cent of fatal crashes in Otago from 2004 to 2013.

A lot of this must be because tourists are over-represented in tourist hot spots: that’s what ‘tourist hot-spot’ means. The proportion of short-term visitors is about 2.5% nationwide, but it’s probably rather lower that than in Gisborne and rather higher on the West Coast.

It’s also worth noting that “identified as a factor” is fairly weak. If you go to the Ministry of Transport reports and add up the percentage of times different factors were involved in a crash, you get a lot more than 100% (for the 2010 report I get 225% for fatal crashes and 185% for injury crashes)

For crashes involving a tourist driver and more than one car, the foreign driver was fully or partly responsible two out of three times.

This at least gets rid of the denominator problem, but the “partly” responsible is still a problem. We aren’t told what proportion of the time the local driver was fully or partly responsible — based on the information given, that could also be two out of three times.

It’s quite likely that foreign drivers are at higher risk, especially those from countries that drive on the right, but the problem is not a big fraction of the NZ road toll. It’s worth considering things that can sensibly be done to reduce it — which doesn’t include withdrawing from the U.N. Convention on Road Traffic — but if you’re trying to stop road deaths it may be more effective to concentrate on interventions that don’t just affect foreign drivers.  Clearer signage, guard rails and median barriers, separated bike lanes, improved public transport… there are many things that might knock a percentage point off road deaths more easily than targetting foreign drivers.

April 17, 2016

Overcounting causes

There’s a long story in the Sunday Star-Times about a 2007 report on cannabis from the National Drug Intelligence Bureau (NDIB)

“Perhaps surprisingly,” Maxwell wrote, “cannabis related hospital admissions between 2001 and 2005 exceeded admissions for opiates, amphetamines and cocaine combined”, with about 2000 people a year ending up in hospital because of the drug.

The problem was with hospital diagnostic codes. Discharge summaries include both the primary cause of admission and a lot of other things to be noted. That’s a good thing — you want to know what all was wrong with a patient both for future clinical care and for research and quality control.  For example, if someone is in hospital for bleeding, you want to know they were on warfarin (which is why the bleeding happened), and perhaps why they were on warfarin. It’s not even always the case that the primary cause is the primary cause — if someone has Parkinson’s Disease and is admitted with pneumonia as a complication, which one should be listed? This is a difficult and complex field, and is even slightly less boring than it sounds.

As a result, if you just count up all the discharge summaries where ‘cannabis dependence’ was somewhere on the laundry list of codes, you’re going to get a lot of people who smoke pot but are in hospital for some completely different reason.  And since there’s a lot of cannabis consumption out there, you will get a lot of these false positives.

There are some other things to note about this report, though. The National Drug Foundation says (on Twitter) that they made the same point when it first came out. They also claim


that the Ministry of Health argued against its being published.

Perhaps now the multiple-counting problem has been publicised in the context of hospital admissions the same mistake will be made less often for road crashes, where multiple factors from foreign drivers to speed to alcohol to drugs are repeatedly counted up as ‘the’ cause of any crash where they are present.

December 31, 2015

One of those end of year post thingies

The most obvious thing in the StatsChat logs: the Rugby World Cup:

rugby

Also, back last January, there was a study on the relationship between cell divisions and cancer risk across human tissues. The popular misinterpretations of the research — “cancer is mostly bad luck” — led to our most popular post ever.

The question of what it means for something to be a Group I carcinogen gets us a lot of low-level traffic, but interest peaked after the IARC report on red meat and processed meat.

Posts on the risk posed by foreign drivers were popular early in the year. In July, though, they were displaced by foreign-sounding home buyers.

I wrote about the largest human randomised controlled trial of mānuka honey to prevent illness, when it was reported in June. It was done by kids at a London primary school. They didn’t find a benefit.

Finally, there’s a steady trickle of people interested in the mathematics of the lottery, presumably in the mistaken hope that we’ll tell them how to beat the martingale optional sampling theorem.