Posts from January 2025 (20)

January 9, 2025

Briefly

  • The top baby names from New Zealand last year are out.  As we’ve seen in the past, the most-common names keep getting less common. “Noah” came top for boys, with only 250 uses, and “Isla” for girls, with only 190 uses.
  • The Daily Mail (because of course) has something purporting to be a map of penis sizes around the world, credited to this site, which gives no sources for the data. Wikipedia points out that a lot of data on this topic is self-reported claims. Wikipedia (possibly NSFW) notes thatMeasurements vary, with studies that rely on self-measurement reporting a significantly higher average than those with a health professional measuring. Even when it’s measured, it tends to be on volunteer samples, and there isn’t good standardisation of measurement protocols across sites.
  • If you live in one of these Aussie suburbs buy a lottery ticket NOW, says the headline on MSN.com, from the Daily Mail (Australia version).  This is a much more extreme headline than the NZ versions I usually complain about, and the text is more measured. Of course, there are two reasons why a suburb will see more lottery wins. The first is just chance, which doesn’t project into the future like that. The second is that these are suburbs where more money is lost on the lottery. Those trends probably will continue, but lottery advertising stories never seem to print the amounts lost on lotto.
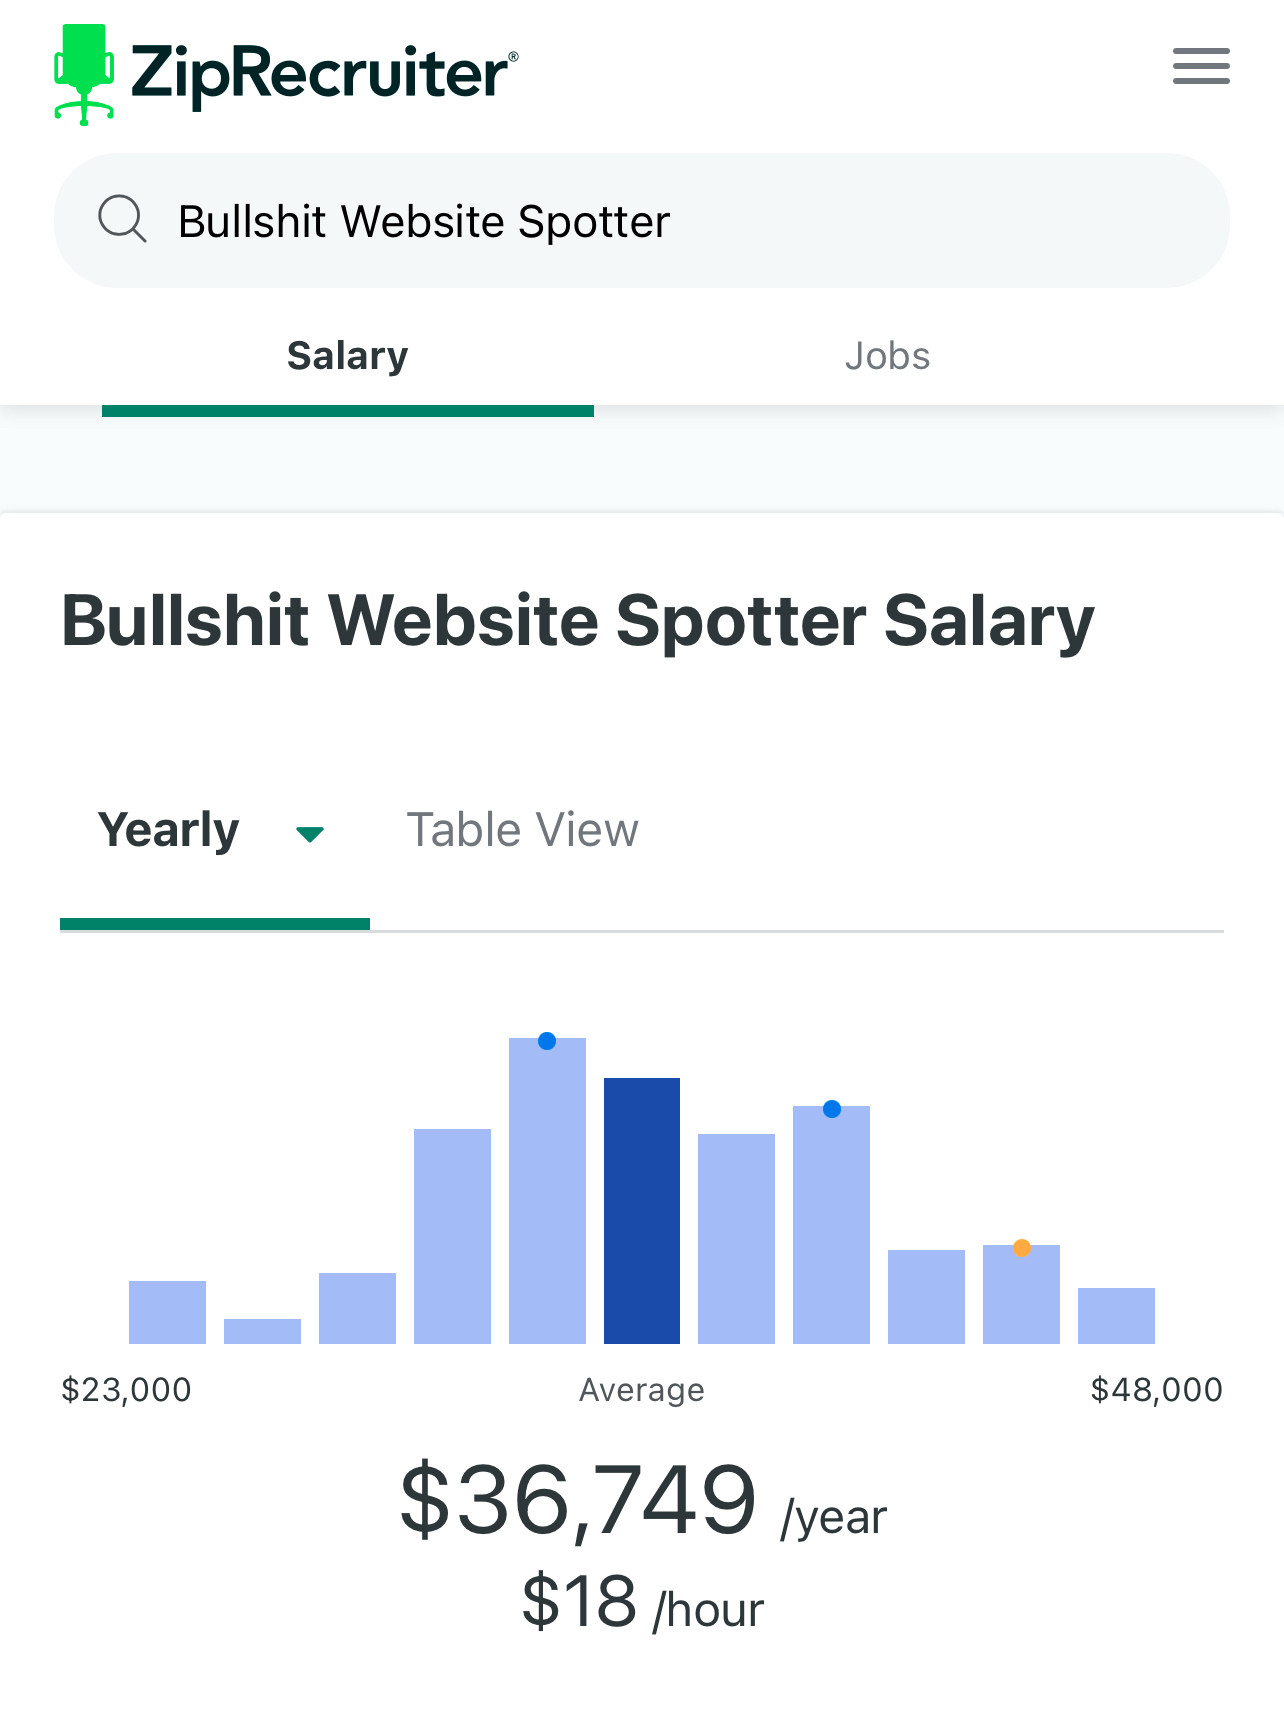
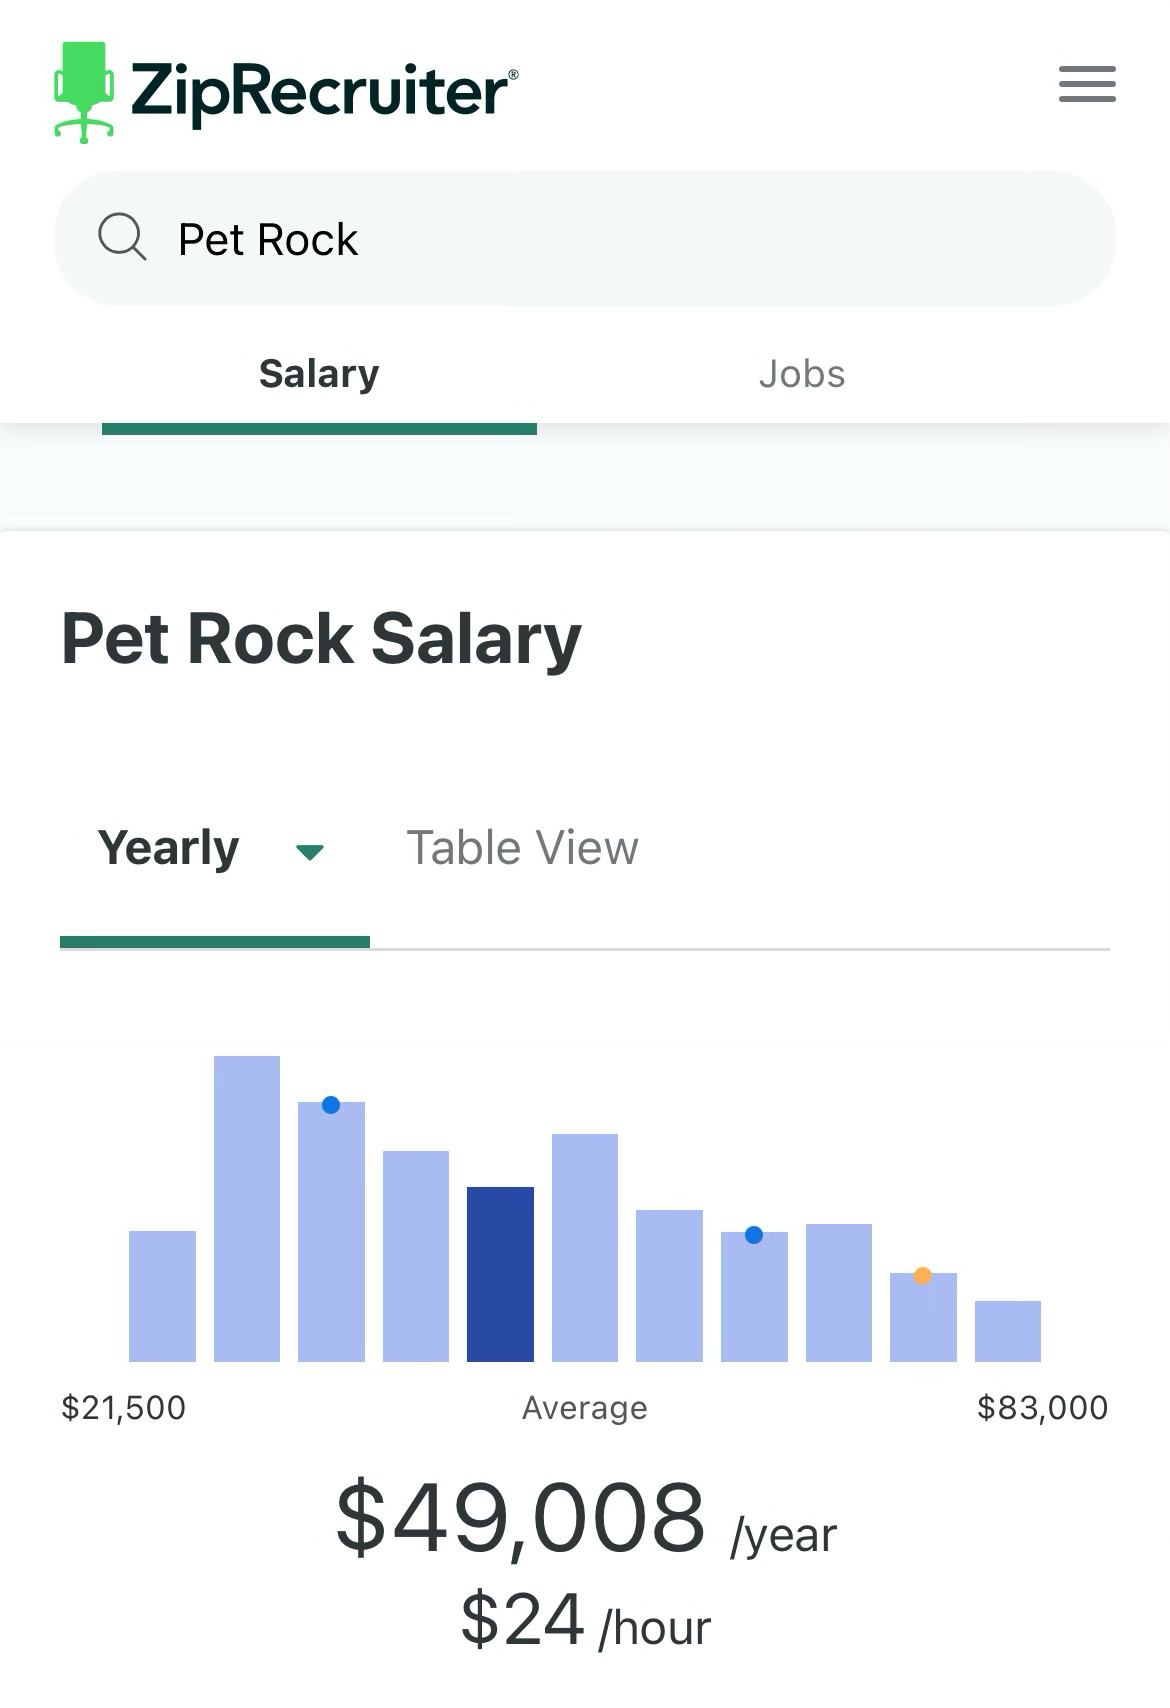
  • We’ve seen a number of times that salary/wage ranges generated from advertising at Seek are not very similar to those reported from actual payments by StatsNZ.  This is worse: via Carl Bergstrom and Eduardo Hebkost, on Bluesky, apparently ziprecruiter.com will (in the US at least; not in NZ) give you salaries for any job you ask about, if you just forge a URL pointing to where the graph should be
January 8, 2025

United Rugby Championship Predictions for Week 10

Team Ratings for Week 10

The basic method is described on my Department home page.
Here are the team ratings prior to this week’s games, along with the ratings at the start of the season.

Current Rating Rating at Season Start Difference
Leinster 14.87 12.09 2.80
Glasgow 9.56 9.39 0.20
Bulls 8.19 8.83 -0.60
Stormers 4.70 6.75 -2.10
Lions 4.43 6.73 -2.30
Munster 4.11 9.28 -5.20
Ulster 3.02 2.52 0.50
Edinburgh 2.79 0.09 2.70
Cheetahs 0.80 0.80 0.00
Sharks 0.03 -2.94 3.00
Connacht -1.95 -0.76 -1.20
Benetton -2.15 1.02 -3.20
Scarlets -4.38 -10.65 6.30
Ospreys -4.83 -2.51 -2.30
Cardiff Rugby -6.09 -2.55 -3.50
Southern Kings -6.52 -6.52 0.00
Zebre -12.64 -16.17 3.50
Dragons -13.94 -15.41 1.50


Performance So Far

So far there have been 69 matches played, 51 of which were correctly predicted, a success rate of 73.9%.
Here are the predictions for last week’s games.

Game Date Score Prediction Correct
1 Stormers vs. Sharks Dec 29 24 – 20 8.10 TRUE
2 Connacht vs. Ulster Dec 30 7 – 17 -0.40 TRUE
3 Munster vs. Leinster Dec 30 7 – 28 -6.10 TRUE
4 Edinburgh vs. Glasgow Dec 30 10 – 7 -6.30 FALSE
5 Zebre vs. Benetton Dec 30 12 – 24 -6.90 TRUE
6 Cardiff Rugby vs. Ospreys Jan 02 13 – 13 1.60 FALSE
7 Scarlets vs. Dragons Jan 02 32 – 15 10.70 TRUE


Predictions for Week 10

Here are the predictions for Week 10. The prediction is my estimated expected points difference with a positive margin being a win to the home team, and a negative margin a win to the away team.

Game Date Winner Prediction
1 Glasgow vs. Connacht Jan 25 Glasgow 17.00
2 Ospreys vs. Benetton Jan 25 Ospreys 2.80
3 Lions vs. Bulls Jan 26 Bulls -1.30
4 Scarlets vs. Edinburgh Jan 26 Edinburgh -1.70
5 Leinster vs. Stormers Jan 26 Leinster 15.70
6 Cardiff Rugby vs. Sharks Jan 26 Sharks -0.60
7 Dragons vs. Munster Jan 26 Munster -12.50
8 Ulster vs. Zebre Jan 27 Ulster 21.20


Rugby Premiership Predictions for Round 11

Team Ratings for Round 11

The basic method is described on my Department home page.
Here are the team ratings prior to this week’s games, along with the ratings at the start of the season.

Current Rating Rating at Season Start Difference
Bath 13.34 5.55 7.80
Bristol 6.85 9.58 -2.70
Northampton Saints 6.25 7.50 -1.20
Sale Sharks 5.04 4.73 0.30
Saracens 2.18 9.68 -7.50
Leicester Tigers 1.83 3.27 -1.40
Gloucester 0.60 -9.04 9.60
Harlequins -0.57 -2.73 2.20
Exeter Chiefs -2.92 1.23 -4.10
Newcastle Falcons -21.84 -19.02 -2.80


Performance So Far

So far there have been 50 matches played, 32 of which were correctly predicted, a success rate of 64%.
Here are the predictions for last week’s games.

Game Date Score Prediction Correct
1 Newcastle Falcons vs. Harlequins Jan 04 14 – 38 -12.50 TRUE
2 Gloucester vs. Sale Sharks Jan 05 36 – 20 -1.40 FALSE
3 Leicester Tigers vs. Exeter Chiefs Jan 05 28 – 15 10.80 TRUE
4 Saracens vs. Bristol Jan 05 35 – 26 0.00 TRUE
5 Northampton Saints vs. Bath Jan 06 35 – 34 -1.00 FALSE


Predictions for Round 11

Here are the predictions for Round 11. The prediction is my estimated expected points difference with a positive margin being a win to the home team, and a negative margin a win to the away team.

Game Date Winner Prediction
1 Harlequins vs. Northampton Saints Jan 25 Northampton Saints -0.30
2 Exeter Chiefs vs. Saracens Jan 26 Exeter Chiefs 1.40
3 Gloucester vs. Leicester Tigers Jan 26 Gloucester 5.30
4 Bristol vs. Newcastle Falcons Jan 27 Bristol 35.20
5 Sale Sharks vs. Bath Jan 27 Bath -1.80


Top 14 Predictions for Round 15

Team Ratings for Round 15

The basic method is described on my Department home page.
Here are the team ratings prior to this week’s games, along with the ratings at the start of the season.

Current Rating Rating at Season Start Difference
Stade Toulousain 10.63 8.76 1.90
Bordeaux Begles 6.53 3.96 2.60
Toulon 6.05 5.32 0.70
Stade Rochelais 3.49 4.85 -1.40
Montpellier 2.05 -0.96 3.00
Racing 92 1.31 2.75 -1.40
Clermont 1.17 0.41 0.80
Bayonne 0.15 -1.69 1.80
Section Paloise -0.70 1.38 -2.10
Castres Olympique -0.96 -0.09 -0.90
Stade Francais -0.98 1.86 -2.80
Lyon -1.00 -0.18 -0.80
USA Perpignan -3.11 -0.66 -2.50
Vannes -8.92 -10.00 1.10


Performance So Far

So far there have been 98 matches played, 76 of which were correctly predicted, a success rate of 77.6%.
Here are the predictions for last week’s games.

Game Date Score Prediction Correct
1 Castres Olympique vs. Section Paloise Jan 05 24 – 19 4.60 TRUE
2 Lyon vs. USA Perpignan Jan 05 17 – 12 8.90 TRUE
3 Montpellier vs. Bayonne Jan 05 42 – 10 5.50 TRUE
4 Stade Francais vs. Bordeaux Begles Jan 05 19 – 46 0.70 FALSE
5 Stade Rochelais vs. Stade Toulousain Jan 05 22 – 19 -0.60 FALSE
6 Toulon vs. Racing 92 Jan 05 36 – 24 9.90 TRUE
7 Vannes vs. Clermont Jan 06 19 – 20 -2.60 TRUE


Predictions for Round 15

Here are the predictions for Round 15. The prediction is my estimated expected points difference with a positive margin being a win to the home team, and a negative margin a win to the away team.

Game Date Winner Prediction
1 Bordeaux Begles vs. Lyon Jan 26 Bordeaux Begles 14.00
2 Racing 92 vs. Castres Olympique Jan 26 Racing 92 9.90
3 Section Paloise vs. Clermont Jan 26 Section Paloise 6.50
4 Stade Toulousain vs. Montpellier Jan 26 Stade Toulousain 14.90
5 USA Perpignan vs. Bayonne Jan 26 USA Perpignan 3.50
6 Vannes vs. Stade Francais Jan 26 Stade Francais -1.30
7 Toulon vs. Stade Rochelais Jan 27 Toulon 8.80


January 4, 2025

Size matters

Ok, this is a bit late, but I didn’t see the poll (in a physical Sunday Star-Times) until this week.  An established Australian polling firm, Freshwater Strategy, have been doing polls here, too.  Stuff reports that the poll (also, at the Post)

…reveals 37% of New Zealand voters have seriously considered emigrating to Australia in the past 12 months.

By comparison, of Australian voters, only 8% have considered moving to New Zealand, including just 1% who have spent time looking into it.

If you don’t think too carefully, that gives the impression of a giant sucking sound and the lights going out in New Zealand.  Australia is a lot larger than New Zealand, though.  If 8% of people in Australia moved to New Zealand and 37% of people in New Zealand moved to Australia, the population of New Zealand would go up, not down.  The total populations are about 5 million and about 27 million. Of those, about 3.6 million are enrolled to vote in NZ and nearly 18 million enrolled to vote in Australia, so 37% of NZ voters is 1.3 million and 8% of Oz voters is 1.44 million.

Another useful comparison number is that the largest ever number of people migrating out of NZ to all destinations, not just Australia, over any 12 months is about 130,000, a tenth of the ‘seriously considered’ number. A lot of people (apparently) seriously consider a lot of things they don’t end up doing.

The other important aspect of the story is the estimates quoted for small subpopulations.  Overall, the poll claims a maximum margin of error of about  3 percentage points. That’s for the population as a whole. Proportions are given for different age groups, including 18-34 year olds, people earning more than $150,000, and voters for Te Pāti Māori.  We aren’t told the uncertainty in these numbers, but it’s obviously higher.  About 1/3 of adults are 18-34, about 5% earn over $150k (IRD spreadsheet), and about 3% voted for Te Pāti Māori.  The maximum margin of error for subpopulations this big would be 5, 13, and 17 percentage points respectively, assuming equal sampling.   You can’t easily learn much about wealthy people or Pāti Māori voters just by contacting random people throughout the country — and the assumption that you can make your sample representative by reweighting gets increasingly dodgy.


January 2, 2025

United Rugby Championship Predictions for Week 10

Team Ratings for Week 10

The basic method is described on my Department home page.
Here are the team ratings prior to this week’s games, along with the ratings at the start of the season.

Current Rating Rating at Season Start Difference
Leinster 14.87 12.09 2.80
Glasgow 9.56 9.39 0.20
Bulls 8.19 8.83 -0.60
Stormers 4.70 6.75 -2.10
Lions 4.43 6.73 -2.30
Munster 4.11 9.28 -5.20
Ulster 3.02 2.52 0.50
Edinburgh 2.79 0.09 2.70
Cheetahs 0.80 0.80 0.00
Sharks 0.03 -2.94 3.00
Connacht -1.95 -0.76 -1.20
Benetton -2.15 1.02 -3.20
Scarlets -4.38 -10.65 6.30
Ospreys -4.83 -2.51 -2.30
Cardiff Rugby -6.09 -2.55 -3.50
Southern Kings -6.52 -6.52 0.00
Zebre -12.64 -16.17 3.50
Dragons -13.94 -15.41 1.50


Performance So Far

So far there have been 69 matches played, 51 of which were correctly predicted, a success rate of 73.9%.
Here are the predictions for last week’s games.

Game Date Score Prediction Correct
1 Stormers vs. Sharks Dec 29 24 – 20 8.10 TRUE
2 Connacht vs. Ulster Dec 30 7 – 17 -0.40 TRUE
3 Munster vs. Leinster Dec 30 7 – 28 -6.10 TRUE
4 Edinburgh vs. Glasgow Dec 30 10 – 7 -6.30 FALSE
5 Zebre vs. Benetton Dec 30 12 – 24 -6.90 TRUE
6 Cardiff Rugby vs. Ospreys Jan 02 13 – 13 1.60 FALSE
7 Scarlets vs. Dragons Jan 02 32 – 15 10.70 TRUE


Predictions for Week 10

Here are the predictions for Week 10. The prediction is my estimated expected points difference with a positive margin being a win to the home team, and a negative margin a win to the away team.

Game Date Winner Prediction
1 Glasgow vs. Connacht Jan 25 Glasgow 17.00
2 Ospreys vs. Benetton Jan 25 Ospreys 2.80
3 Lions vs. Bulls Jan 26 Bulls -1.30
4 Scarlets vs. Edinburgh Jan 26 Edinburgh -1.70
5 Leinster vs. Stormers Jan 26 Leinster 15.70
6 Cardiff Rugby vs. Sharks Jan 26 Sharks -0.60
7 Dragons vs. Munster Jan 26 Munster -12.50
8 Ulster vs. Zebre Jan 27 Ulster 21.20


Top 14 Predictions for Round 14

Team Ratings for Round 14

The basic method is described on my Department home page.
Here are the team ratings prior to this week’s games, along with the ratings at the start of the season.

Current Rating Rating at Season Start Difference
Stade Toulousain 10.82 8.76 2.10
Toulon 5.92 5.32 0.60
Bordeaux Begles 5.52 3.96 1.60
Stade Rochelais 3.34 4.85 -1.50
Racing 92 1.47 2.75 -1.30
Clermont 1.26 0.41 0.90
Montpellier 1.16 -0.96 2.10
Bayonne 1.08 -1.69 2.80
Stade Francais -0.03 1.86 -1.90
Section Paloise -0.69 1.38 -2.10
Lyon -0.80 -0.18 -0.60
Castres Olympique -0.95 -0.09 -0.90
USA Perpignan -3.30 -0.66 -2.60
Vannes -9.06 -10.00 0.90


Performance So Far

So far there have been 91 matches played, 71 of which were correctly predicted, a success rate of 78%.
Here are the predictions for last week’s games.

Game Date Score Prediction Correct
1 Bayonne vs. Castres Olympique Dec 29 33 – 12 8.60 TRUE
2 Bordeaux Begles vs. Toulon Dec 29 21 – 17 7.50 TRUE
3 Clermont vs. Montpellier Dec 29 18 – 22 7.30 FALSE
4 Section Paloise vs. Vannes Dec 29 48 – 24 14.70 TRUE
5 Racing 92 vs. Lyon Dec 30 25 – 25 9.60 FALSE
6 Stade Toulousain vs. Stade Francais Dec 30 38 – 23 16.60 TRUE
7 USA Perpignan vs. Stade Rochelais Dec 30 21 – 13 0.10 TRUE


Predictions for Round 14

Here are the predictions for Round 14. The prediction is my estimated expected points difference with a positive margin being a win to the home team, and a negative margin a win to the away team.

Game Date Winner Prediction
1 Castres Olympique vs. Section Paloise Jan 05 Castres Olympique 4.60
2 Lyon vs. USA Perpignan Jan 05 Lyon 8.90
3 Montpellier vs. Bayonne Jan 05 Montpellier 5.50
4 Stade Francais vs. Bordeaux Begles Jan 05 Stade Francais 0.70
5 Stade Rochelais vs. Stade Toulousain Jan 05 Stade Toulousain -0.60
6 Toulon vs. Racing 92 Jan 05 Toulon 9.90
7 Vannes vs. Clermont Jan 06 Clermont -2.60


Rugby Premiership Predictions for Round 10

Team Ratings for Round 10

The basic method is described on my Department home page.
Here are the team ratings prior to this week’s games, along with the ratings at the start of the season.

Current Rating Rating at Season Start Difference
Bath 13.54 5.55 8.00
Bristol 7.75 9.58 -1.80
Sale Sharks 6.78 4.73 2.10
Northampton Saints 6.05 7.50 -1.40
Leicester Tigers 1.61 3.27 -1.70
Saracens 1.28 9.68 -8.40
Gloucester -1.14 -9.04 7.90
Harlequins -1.73 -2.73 1.00
Exeter Chiefs -2.70 1.23 -3.90
Newcastle Falcons -20.69 -19.02 -1.70


Performance So Far

So far there have been 45 matches played, 29 of which were correctly predicted, a success rate of 64.4%.
Here are the predictions for last week’s games.

Game Date Score Prediction Correct
1 Bristol vs. Sale Sharks Dec 28 0 – 38 18.80 FALSE
2 Bath vs. Saracens Dec 29 68 – 10 8.90 TRUE
3 Northampton Saints vs. Newcastle Falcons Dec 29 61 – 0 26.30 TRUE
4 Harlequins vs. Leicester Tigers Dec 29 34 – 34 4.00 FALSE
5 Exeter Chiefs vs. Gloucester Dec 30 22 – 15 4.40 TRUE


Predictions for Round 10

Here are the predictions for Round 10. The prediction is my estimated expected points difference with a positive margin being a win to the home team, and a negative margin a win to the away team.

Game Date Winner Prediction
1 Newcastle Falcons vs. Harlequins Jan 04 Harlequins -12.50
2 Gloucester vs. Sale Sharks Jan 05 Sale Sharks -1.40
3 Leicester Tigers vs. Exeter Chiefs Jan 05 Leicester Tigers 10.80
4 Saracens vs. Bristol Jan 05 Saracens 0.00
5 Northampton Saints vs. Bath Jan 06 Bath -1.00


January 1, 2025

Black spatulas

If you’ve been paying attention to the food scare news, you will have heard that black plastic spatulas are EVIL and then that they are probably ok.  Predicted exposures to brominated flame retardants were close to the ‘reference level’ because of a simple decimal-place error and there’s now a ten-fold safety margin. The summary by Joel Schwarcz at McGill University in Canada is good; as he notes, there is no actual need for spatulas to be flame-retardant and while the level of fire retardants doesn’t look dangerous, the target level should be roughly zero.

There are two additional points I want to make. First, units.  The original scare paper quoted the ‘oral reference dose’ as 7000 nanograms per kg per day. The EPA document that it cited said 0.007 mg per kilogram per day. These are terrible units.  The SI system gives us names every three orders of magnitude precisely so we don’t have to do this sort of thing and can say 7 micrograms per kilogram per day. It’s a lot easier to work with numbers like this.

Second, what does the reference dose mean?  If you look at the relevant EPA document you will see that the 7 micrograms per kilogram per day comes by taking a reference dose for non-cancer effects in mice and multiplying dividing it by 10 because humans might be more sensitive than mice, and a further 10 because you might be more sensitive than the typical human and a further 3 because long-term exposure might matter more than short-term exposure.  And, on reading further, that the dose for mice was the highest dose tested in that experiment and did not show any adverse effects.  So, the 7 micrograms per kilogram per day reference dose is 300 times the highest dose they even tested for mice.  Some other experiments did find adverse effects in rats, but at doses nearly a thousand times higher: 6 milligrams per kg per day.

Taking all this together you can see the fuzziness in the calculations. There’s now a ten-fold margin of safety between a generously estimated dose and a reference dose — which is not a danger dose, but one that should have no effect.  On top of that, there’s an unknown (and possibly large) safety factor because of the choice of doses in the mouse safety experiments.  The basic problem is that you can’t tell accurately what doses will cause harm in humans without causing harm in humans; some sort of extrapolation is unavoidable in safety assessment.

Away with the ferries

The Isle of Arran, as I’m sure you all know, is on the west side of Scotland  Being an island, it has somewhat limited means of access: Caledonian MacBrayne run two ferries from the mainland.  These ferries are being replaced with allegedly better ferries. However, the BBC headline said ‘Green’ ferry emits more CO2 than old diesel ship

In reply, “Ferries procurement agency CMAL, which owns the ship, said the comparison was “inaccurate” as Glen Sannox is a larger vessel.” 

While New Zealand is very attached to per capita representations of everything, sometimes they aren’t helpful.  The new ship is bigger. Precisely for that reason, it would emit more CO2 if run on the same fuel as the old ship.  The plan is actually to run the ship on liquified fossil gas imported from Qatar and trucked up from the south of England. This would reduce the CO2 emissions, but would produce methane emissions that pretty much compensate for the reduction — and the UK follows mainstream science in recognising that methane actually matters.

In some settings, such as comparing Auckland’s double-decker buses to traditional buses, it’s important to take account of the fact that they’re bigger and so you don’t need as many of them to carry all your passengers.  But when you’re talking about a ferry route with two ships there isn’t the same room for per capita savings to pay off the larger per-ship emissions.   If you run the same number of trips with bigger ships you’ll get more emissions. And if you can carry more cars on the bigger ferries that’s not really going to reduce emissions, either.