Posts from January 2023 (14)

January 31, 2023

United Rugby Championship Predictions for Delayed Games

Team Ratings for Delayed Games

The basic method is described on my Department home page.
Here are the team ratings prior to this week’s games, along with the ratings at the start of the season.

Current Rating Rating at Season Start Difference
Leinster 16.83 16.79 0.00
Munster 9.56 9.78 -0.20
Ulster 9.49 9.27 0.20
Bulls 6.75 7.84 -1.10
Stormers 6.68 7.14 -0.50
Sharks 6.00 6.95 -1.00
Glasgow 2.74 -0.00 2.70
Connacht 1.87 -1.60 3.50
Edinburgh 1.66 3.58 -1.90
Ospreys -1.51 -0.83 -0.70
Benetton -3.56 -3.68 0.10
Lions -3.59 -1.74 -1.80
Scarlets -3.69 -1.23 -2.50
Cardiff Rugby -5.43 -7.42 2.00
Dragons -10.80 -11.81 1.00
Zebre -16.96 -16.99 0.00


Performance So Far

So far there have been 101 matches played, 75 of which were correctly predicted, a success rate of 74.3%.
Here are the predictions for last week’s games.

Game Date Score Prediction Correct
1 Scarlets vs. Bulls Jan 28 37 – 28 -7.40 FALSE
2 Ulster vs. Stormers Jan 28 35 – 5 5.40 TRUE
3 Benetton vs. Munster Jan 29 30 – 40 -8.30 TRUE
4 Dragons vs. Glasgow Jan 29 28 – 42 -7.80 TRUE
5 Leinster vs. Cardiff Rugby Jan 29 38 – 14 27.40 TRUE
6 Edinburgh vs. Sharks Jan 29 19 – 22 0.90 FALSE
7 Connacht vs. Lions Jan 29 43 – 24 8.90 TRUE
8 Zebre vs. Ospreys Jan 30 24 – 28 -11.80 TRUE


Predictions for Delayed Games

Here are the predictions for Delayed Games. The prediction is my estimated expected points difference with a positive margin being a win to the home team, and a negative margin a win to the away team.

Game Date Winner Prediction
1 Sharks vs. Stormers Feb 04 Sharks 3.30


Top 14 Predictions for Round 17

Team Ratings for Round 17

The basic method is described on my Department home page.
Here are the team ratings prior to this week’s games, along with the ratings at the start of the season.

Current Rating Rating at Season Start Difference
Stade Toulousain 7.90 6.34 1.60
La Rochelle 7.11 6.88 0.20
Racing 92 4.80 4.86 -0.10
Bordeaux Begles 4.43 5.27 -0.80
Stade Francais 4.40 -1.05 5.50
Montpellier 4.03 4.18 -0.20
Toulon 3.44 4.09 -0.70
Lyon 1.95 3.10 -1.20
Castres Olympique 1.27 2.87 -1.60
Clermont 1.11 4.05 -2.90
Aviron Bayonnais -0.68 -4.26 3.60
Section Paloise -1.90 -2.12 0.20
USA Perpignan -4.92 -2.75 -2.20
Brive -5.68 -4.20 -1.50


Performance So Far

So far there have been 112 matches played, 80 of which were correctly predicted, a success rate of 71.4%.
Here are the predictions for last week’s games.

Game Date Score Prediction Correct
1 Aviron Bayonnais vs. Brive Jan 29 37 – 9 10.40 TRUE
2 Castres Olympique vs. Bordeaux Begles Jan 29 23 – 18 3.20 TRUE
3 Lyon vs. Clermont Jan 29 34 – 14 6.40 TRUE
4 Racing 92 vs. La Rochelle Jan 29 39 – 36 4.30 TRUE
5 Toulon vs. Section Paloise Jan 29 27 – 16 11.90 TRUE
6 USA Perpignan vs. Stade Francais Jan 29 31 – 24 -3.60 FALSE
7 Stade Toulousain vs. Montpellier Jan 30 23 – 9 10.00 TRUE


Predictions for Round 17

Here are the predictions for Round 17. The prediction is my estimated expected points difference with a positive margin being a win to the home team, and a negative margin a win to the away team.

Game Date Winner Prediction
1 Stade Toulousain vs. Aviron Bayonnais Feb 05 Stade Toulousain 15.10
2 Brive vs. USA Perpignan Feb 05 Brive 5.70
3 Clermont vs. Castres Olympique Feb 05 Clermont 6.30
4 La Rochelle vs. Lyon Feb 05 La Rochelle 11.70
5 Section Paloise vs. Racing 92 Feb 05 Racing 92 -0.20
6 Montpellier vs. Toulon Feb 05 Montpellier 7.10
7 Stade Francais vs. Bordeaux Begles Feb 06 Stade Francais 6.50


Rugby Premiership Predictions for Round 17

Team Ratings for Round 17

The basic method is described on my Department home page.
Here are the team ratings prior to this week’s games, along with the ratings at the start of the season.

Current Rating Rating at Season Start Difference
Sale Sharks 5.01 4.14 0.90
Leicester Tigers 2.15 7.93 -5.80
Exeter Chiefs 2.10 3.67 -1.60
Saracens 2.06 -5.00 7.10
Gloucester 1.97 5.92 -3.90
Northampton Saints 1.97 3.99 -2.00
London Irish 1.74 -1.65 3.40
Harlequins 0.54 3.92 -3.40
Wasps -0.18 0.77 -1.00
Bristol -3.09 -2.43 -0.70
Bath -4.97 -9.15 4.20
Newcastle Falcons -6.54 -8.76 2.20
Worcester Warriors -11.69 -12.27 0.60


Performance So Far

So far there have been 77 matches played, 51 of which were correctly predicted, a success rate of 66.2%.
Here are the predictions for last week’s games.

Game Date Score Prediction Correct
1 Sale Sharks vs. Bath Jan 28 30 – 27 15.90 TRUE
2 Leicester Tigers vs. Northampton Saints Jan 29 18 – 19 5.50 FALSE
3 Saracens vs. Bristol Jan 29 20 – 19 10.80 TRUE
4 Exeter Chiefs vs. Gloucester Jan 29 24 – 17 4.20 TRUE
5 London Irish vs. Harlequins Jan 30 42 – 24 4.20 TRUE


Predictions for Round 17

Here are the predictions for Round 17. The prediction is my estimated expected points difference with a positive margin being a win to the home team, and a negative margin a win to the away team.

Game Date Winner Prediction
1 Bristol vs. Newcastle Falcons Feb 18 Bristol 7.90
2 Gloucester vs. Harlequins Feb 18 Gloucester 5.90
3 Bath vs. London Irish Feb 19 London Irish -2.20
4 Northampton Saints vs. Sale Sharks Feb 19 Northampton Saints 1.50
5 Leicester Tigers vs. Saracens Feb 20 Leicester Tigers 4.60


January 10, 2023

United Rugby Championship Predictions for Week 13

Team Ratings for Week 13

The basic method is described on my Department home page.
Here are the team ratings prior to this week’s games, along with the ratings at the start of the season.

Current Rating Rating at Season Start Difference
Leinster 17.17 16.79 0.40
Munster 9.38 9.78 -0.40
Ulster 8.55 9.27 -0.70
Stormers 7.62 7.14 0.50
Bulls 7.46 7.84 -0.40
Sharks 5.61 6.95 -1.30
Glasgow 2.12 -0.00 2.10
Edinburgh 2.05 3.58 -1.50
Connacht 1.36 -1.60 3.00
Ospreys -1.09 -0.83 -0.30
Lions -3.08 -1.74 -1.30
Benetton -3.38 -3.68 0.30
Scarlets -4.40 -1.23 -3.20
Cardiff Rugby -5.77 -7.42 1.70
Dragons -10.17 -11.81 1.60
Zebre -17.38 -16.99 -0.40


Performance So Far

So far there have been 93 matches played, 69 of which were correctly predicted, a success rate of 74.2%.
Here are the predictions for last week’s games.

Game Date Score Prediction Correct
1 Dragons vs. Bulls Jan 07 14 – 29 -12.70 TRUE
2 Munster vs. Lions Jan 07 33 – 3 15.70 TRUE
3 Benetton vs. Ulster Jan 08 31 – 29 -8.50 FALSE
4 Edinburgh vs. Zebre Jan 08 24 – 17 25.50 TRUE
5 Cardiff Rugby vs. Scarlets Jan 08 22 – 28 3.60 FALSE
6 Connacht vs. Sharks Jan 08 24 – 12 -0.90 FALSE
7 Ospreys vs. Leinster Jan 08 19 – 24 -14.70 TRUE
8 Glasgow vs. Stormers Jan 09 24 – 17 -1.90 FALSE


Predictions for Week 13

Here are the predictions for Week 13. The prediction is my estimated expected points difference with a positive margin being a win to the home team, and a negative margin a win to the away team.

Game Date Winner Prediction
1 Scarlets vs. Bulls Jan 28 Bulls -7.40
2 Ulster vs. Stormers Jan 28 Ulster 5.40
3 Benetton vs. Munster Jan 29 Munster -8.30
4 Dragons vs. Glasgow Jan 29 Glasgow -7.80
5 Leinster vs. Cardiff Rugby Jan 29 Leinster 27.40
6 Edinburgh vs. Sharks Jan 29 Edinburgh 0.90
7 Connacht vs. Lions Jan 29 Connacht 8.90
8 Zebre vs. Ospreys Jan 30 Ospreys -11.80


Top 14 Predictions for Round 16

Team Ratings for Round 16

The basic method is described on my Department home page.
Here are the team ratings prior to this week’s games, along with the ratings at the start of the season.

Current Rating Rating at Season Start Difference
Stade Toulousain 7.70 6.34 1.40
La Rochelle 7.04 6.88 0.20
Racing 92 4.87 4.86 0.00
Stade Francais 4.77 -1.05 5.80
Bordeaux Begles 4.53 5.27 -0.70
Montpellier 4.23 4.18 0.00
Toulon 3.49 4.09 -0.60
Clermont 1.57 4.05 -2.50
Lyon 1.49 3.10 -1.60
Castres Olympique 1.18 2.87 -1.70
Aviron Bayonnais -1.25 -4.26 3.00
Section Paloise -1.95 -2.12 0.20
Brive -5.10 -4.20 -0.90
USA Perpignan -5.29 -2.75 -2.50


Performance So Far

So far there have been 105 matches played, 74 of which were correctly predicted, a success rate of 70.5%.
Here are the predictions for last week’s games.

Game Date Score Prediction Correct
1 Bordeaux Begles vs. Aviron Bayonnais Jan 08 23 – 15 12.80 TRUE
2 Brive vs. Toulon Jan 08 26 – 17 -2.90 FALSE
3 Clermont vs. USA Perpignan Jan 08 31 – 20 13.60 TRUE
4 La Rochelle vs. Stade Toulousain Jan 08 30 – 7 4.70 TRUE
5 Section Paloise vs. Lyon Jan 08 12 – 21 3.90 FALSE
6 Stade Francais vs. Castres Olympique Jan 08 26 – 7 9.10 TRUE
7 Montpellier vs. Racing 92 Jan 09 17 – 12 6.00 TRUE


Predictions for Round 16

Here are the predictions for Round 16. The prediction is my estimated expected points difference with a positive margin being a win to the home team, and a negative margin a win to the away team.

Game Date Winner Prediction
1 Aviron Bayonnais vs. Brive Jan 28 Aviron Bayonnais 10.40
2 Castres Olympique vs. Bordeaux Begles Jan 28 Castres Olympique 3.20
3 Lyon vs. Clermont Jan 28 Lyon 6.40
4 Racing 92 vs. La Rochelle Jan 28 Racing 92 4.30
5 Stade Toulousain vs. Montpellier Jan 28 Stade Toulousain 10.00
6 Toulon vs. Section Paloise Jan 28 Toulon 11.90
7 USA Perpignan vs. Stade Francais Jan 28 Stade Francais -3.60


Rugby Premiership Predictions for Round 16

Team Ratings for Round 16

The basic method is described on my Department home page.
Here are the team ratings prior to this week’s games, along with the ratings at the start of the season.

Current Rating Rating at Season Start Difference
Sale Sharks 5.71 4.14 1.60
Saracens 2.62 -5.00 7.60
Leicester Tigers 2.54 7.93 -5.40
Gloucester 2.20 5.92 -3.70
Exeter Chiefs 1.87 3.67 -1.80
Northampton Saints 1.58 3.99 -2.40
Harlequins 1.28 3.92 -2.60
London Irish 0.99 -1.65 2.60
Wasps -0.18 0.77 -1.00
Bristol -3.64 -2.43 -1.20
Bath -5.68 -9.15 3.50
Newcastle Falcons -6.54 -8.76 2.20
Worcester Warriors -11.69 -12.27 0.60


Performance So Far

So far there have been 72 matches played, 47 of which were correctly predicted, a success rate of 65.3%.
Here are the predictions for last week’s games.

Game Date Score Prediction Correct
1 Gloucester vs. Saracens Jan 07 16 – 19 5.00 FALSE
2 Newcastle Falcons vs. Leicester Tigers Jan 08 45 – 26 -7.10 FALSE
3 Exeter Chiefs vs. Northampton Saints Jan 08 35 – 12 2.70 TRUE
4 Harlequins vs. Sale Sharks Jan 09 16 – 24 1.10 FALSE
5 London Irish vs. Bristol Jan 09 23 – 7 8.20 TRUE


Predictions for Round 16

Here are the predictions for Round 16. The prediction is my estimated expected points difference with a positive margin being a win to the home team, and a negative margin a win to the away team.

Game Date Winner Prediction
1 Sale Sharks vs. Bath Jan 28 Sale Sharks 15.90
2 Leicester Tigers vs. Northampton Saints Jan 29 Leicester Tigers 5.50
3 Saracens vs. Bristol Jan 29 Saracens 10.80
4 Exeter Chiefs vs. Gloucester Jan 29 Exeter Chiefs 4.20
5 London Irish vs. Harlequins Jan 30 London Irish 4.20


January 9, 2023

Briefly

  • “We were able to put together a relatively good data set of case numbers for all states, but we were explicitly forbidden to make the data publicly available, even though our data was more accurate than what was appearing in the media.” Rob Hyndman, quoted by the ABC
  • Yet another example that counting isn’t simply neutral, from the Wikipedia entry for the Bechdel Test, via depths of wikipedia: “What counts as a character or as a conversation is not defined. For example, the Sir Mix-a-Lot song “Baby Got Back” has been described as passing the Bechdel test, because it begins with a valley girl saying to another “oh my god, Becky, look at her butt”. 
  • From the Washington Post: is your name more common for dogs or people? (in the US, of course)
  • From the New York Times, estimated carbon emissions by neighbourhood across the USA.
  • From David Hood, using the Ministry of Health public data, our holiday Covid wave. Something different seems to have happened in Tarāwhiti, and it seems to have happened at roughly the same time as the Rhythm’N’Vines festival
January 8, 2023

Murderous Kiwis

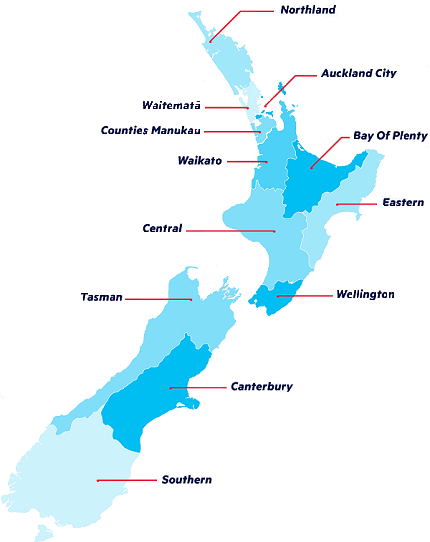
Newshub has a story Map: New Zealand’s murder hotspots revealed.

This is the map

The map (and the text) don’t say what these geographical units are. Based on the context and the presence of “Counties Manukau” as one of them, I would expect them to be police districts: this (just a map, no data) is from the NZ Police website

There’s a few confusing things about the Newshub map, though.  We seem to be missing Wellington (in the text, too), along with Auckland City and Northland. The ‘Southern’, ‘Eastern’, and ‘Central’ police districts are under a label ‘Auckland’ at the top right, making them look as though they might be southern, eastern, and central Auckland.

As always, there’s the question of the appropriate denominator.  Police districts are large enough that the distinction between the location of the murder and the residence of the victim might not matter too much (in contrast to census area units and assault), and I’m going to assume that the data include homicides in private homes (in contrast to census area units and assault) because that would have been mentioned otherwise. So it seems reasonable to use a general population denominator. This is trickier than I would have expected; it seems quite hard to find the police district populations. If you’re putting in a police OIA request like this one you might want to ask them for populations as well.

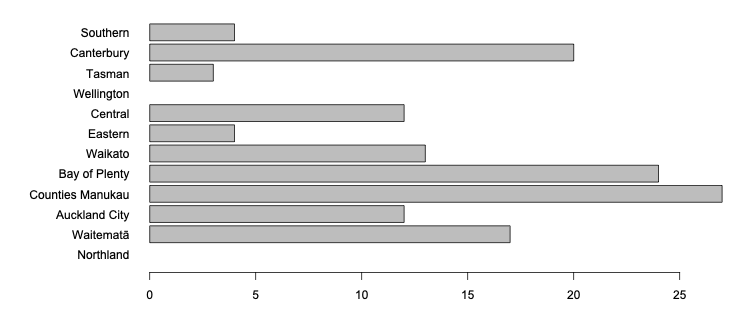
Looking at maps, the police districts seem to (at least approximately) be combinations of DHBs*, so I used the populations of those DHBs. Here are the comparisons just by counts of homicides over nearly three years (we’re missing Wellington and Northland)

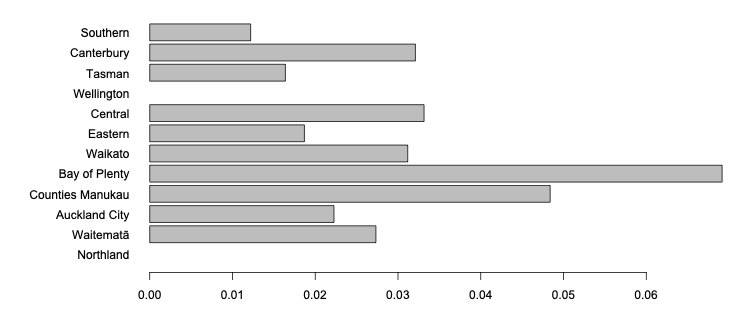
And here are the (approximated) rates per thousand people over those three years. You might worry about how well the three Auckland districts can be separated; it wouldn’t be hard to combine them.

Bay of Plenty looks higher and Canterbury, Counties, and Waitematā look lower when you account for the differences in numbers of people.  Comparisons like this usually want rates (how dangerous), not counts (how many), if a relevant denominator is available.

Newshub does get points, though, for correctly saying all these numbers are pretty low by international standards.


* DHB: Deprecated Health Boundary

January 5, 2023

How common is long covid and why don’t we know?

You see widely varying estimates for the probability of getting long Covid and for the recovery prognosis. Some of this is because people are picking numbers to recirculate that match their prejudices, but some of it is because these are hard questions to answer.

For example, the Hamilton Spectator (other Hamilton, not ours) reports a Canadian study following 106 people for a year. The headline was initially 75 per cent of COVID ‘long haulers’ free of symptoms in 12 months: McMaster study. It’s now 25 per cent of COVID patients become ‘long haulers’ after 12 months: Mac study. Both are misleading, though the second is better.

This study started out with 106 people, with an average age of 57. They had substantially more severe Covid than average:

Twenty-six patients recovered from COVID19 at home, 35 were admitted to the ICU, and 45 were hospitalized but not ICU-admitted

For comparison, in New Zealand the hospitalisation rate has been about 1% of reported cases, with about 0.03% of reported cases admitted to the ICU. It’s not a representative sample, and this matters for estimating overall prevalence. On top of that, only half the study participants have 12-month data. That means the proportion known to have become ‘long-haulers’ is only about 12%; the 25% is a guess that the people who didn’t continue with the study were similar.

A more general problem is that “long covid” isn’t an easily measurable thing. There are people who are still unwell in various ways a long time after they get Covid. There are multiple theories about what exactly is the mechanism, and it’s quite possible that more than one of these theories is true — we don’t even know that ‘long covid’ is just a single condition.  Because we aren’t sure about the mechanism or mechanisms, there isn’t a test for long Covid the way there is for Covid.  If you have symptoms plus a positive RAT or PCR test for the SARS-2-Cov virus you have Covid; that’s what ‘having Covid’ means. There isn’t a simple, objective definition like that for long Covid.

Because there isn’t a simple, objective test for long covid, different studies define it in different ways: usually as having had Covid plus some set of symptoms later in time. Different studies use different symptoms. The larger the study, the more generic the symptom measurements tend to be, and so you’d expect higher rates of people to report having those symptoms.  If you simply ask about ‘fatigue’ you’ll pick up people with ordinary everyday <gestures-broadly-at-internet-and-world> as well as people with crushing post-Covid exhaustion, even though they’re very different.

There are also different time-frames in different studies: more people will have symptoms for three months than for twelve months just because twelve months is longer.  Twelve-month follow-up also implies the study must have started earlier; a study that followed people for twelve months after initial illness won’t include anyone who had Omicron and might include a lot of unvaccinated people.

The different definitions and different populations matter. The majority of people in New Zealand have had Covid. There’s no way that 25% them have the sort of long Covid that someone like Jenene Crossan or Daniel Freeman did; it would be obvious in the basic functioning of society.   Some people do have disabling long Covid; some people have milder versions; some have annoying post-Covid symptoms; some people seem to recover ok (though they might be at higher risk of other disease in the future). We don’t have good numbers on the size of these groups, or ways to predict who is who, or treatments, and it’s partly because it’s difficult and partly because the pandemic keeps changing.

It’s also partly because we haven’t put enough resources into it.

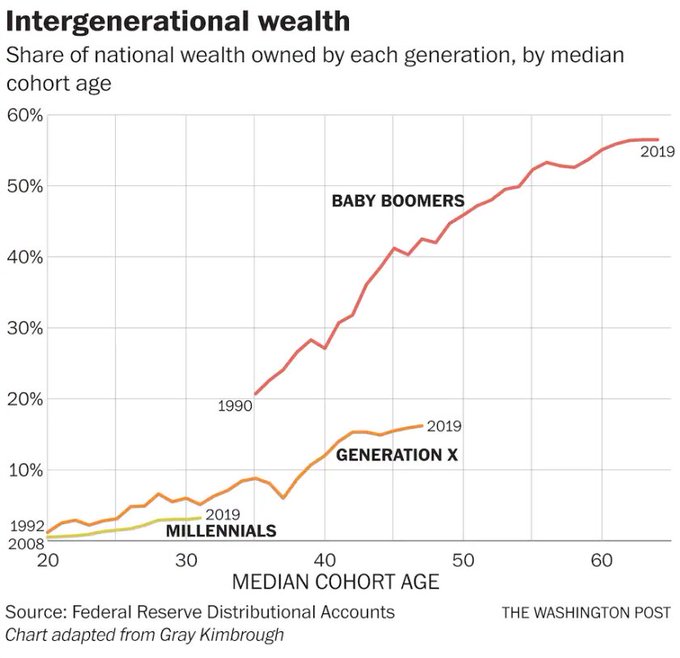
Ok boomers?

A graph, which has been popular on the internets, in this instance via Matthew Yglesias

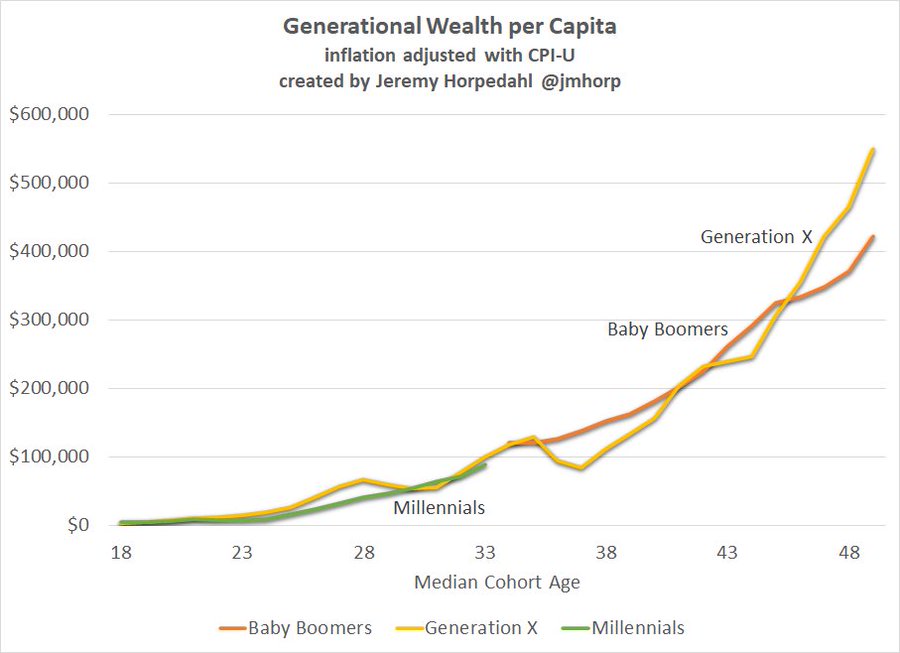
Another graph, showing the same thing per capita rather than as shares of the population, also via Matthew Yglesias. This one appears to have a very different message.

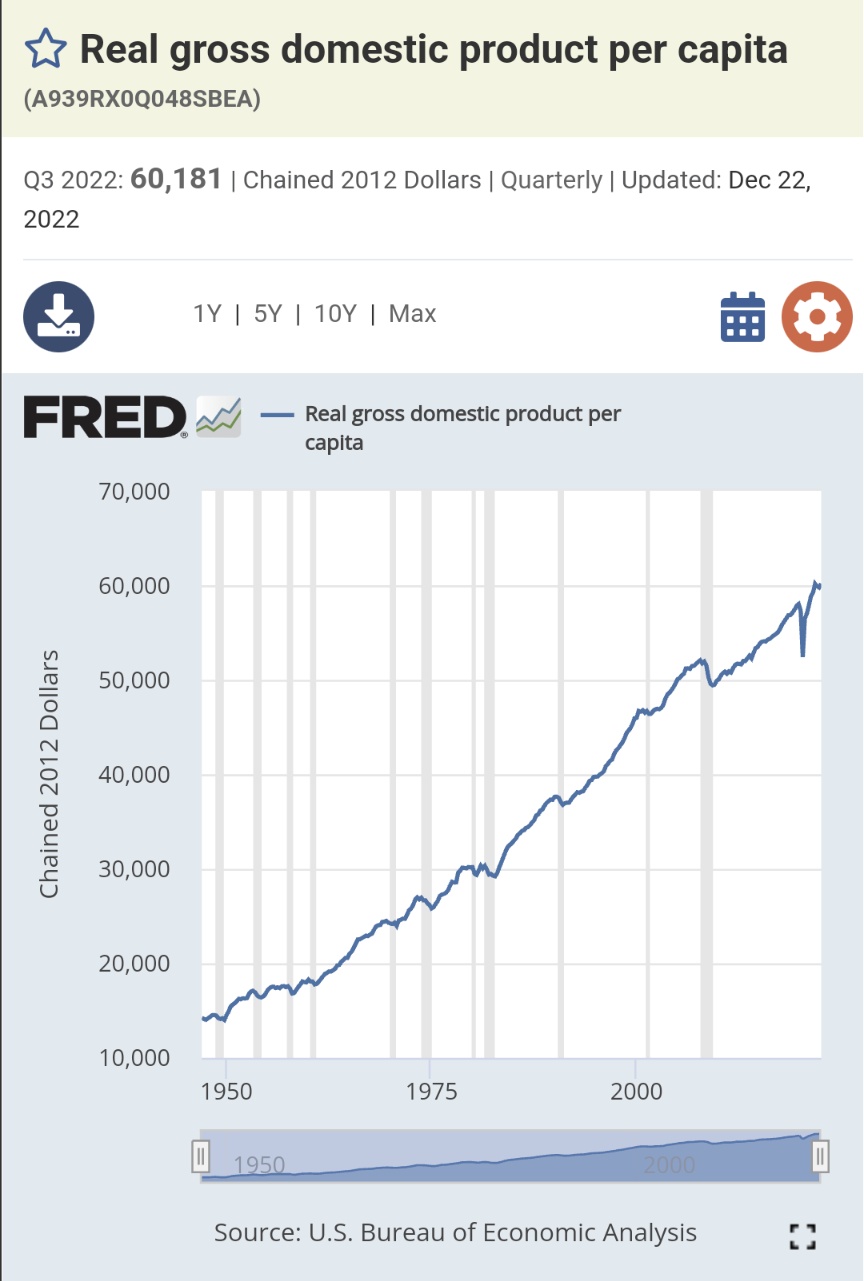
And a third graph, from the FRED system operated by the Federal Reserve Bank, showing US real per-capita GDP

So: Gen X have a much lower share of US wealth than the Baby Boomers did at the same age.  This is partly because we are a smaller fraction of the population than they were: per-capita wealth is similar.  But per-capita wealth being similar isn’t as good as it sounds, because the US as a whole is substantially richer now than when the Boomers were 50.

This isn’t a gotcha for either of the first two graphs — different questions are allowed to have different answers — but it might be useful context for the comparison