Posts from November 2022 (14)

November 29, 2022

United Rugby Championship Predictions for Week 9

Team Ratings for Week 9

The basic method is described on my Department home page.
Here are the team ratings prior to this week’s games, along with the ratings at the start of the season.

Current Rating Rating at Season Start Difference
Leinster 18.05 16.79 1.30
Ulster 9.71 9.27 0.40
Bulls 7.83 7.84 -0.00
Stormers 7.50 7.14 0.40
Munster 6.64 9.78 -3.10
Edinburgh 4.91 3.58 1.30
Sharks 4.06 6.95 -2.90
Connacht 0.44 -1.60 2.00
Glasgow -0.23 -0.00 -0.20
Lions -1.40 -1.74 0.30
Ospreys -2.21 -0.83 -1.40
Scarlets -4.18 -1.23 -2.90
Cardiff Rugby -4.63 -7.42 2.80
Benetton -4.80 -3.68 -1.10
Dragons -9.60 -11.81 2.20
Zebre -16.06 -16.99 0.90


Performance So Far

So far there have been 61 matches played, 46 of which were correctly predicted, a success rate of 75.4%.
Here are the predictions for last week’s games.

Game Date Score Prediction Correct
1 Stormers vs. Scarlets Nov 26 36 – 19 16.00 TRUE
2 Ulster vs. Zebre Nov 26 36 – 15 31.30 TRUE
3 Benetton vs. Edinburgh Nov 26 24 – 17 -6.40 FALSE
4 Bulls vs. Ospreys Nov 26 43 – 26 13.90 TRUE
5 Leinster vs. Glasgow Nov 27 40 – 5 21.50 TRUE
6 Munster vs. Connacht Nov 27 24 – 17 11.00 TRUE
7 Lions vs. Dragons Nov 28 33 – 25 13.90 TRUE
8 Sharks vs. Cardiff Rugby Nov 28 0 – 35 16.30 FALSE


Predictions for Week 9

Here are the predictions for Week 9. The prediction is my estimated expected points difference with a positive margin being a win to the home team, and a negative margin a win to the away team.

Game Date Winner Prediction
1 Sharks vs. Ospreys Dec 03 Sharks 10.80
2 Edinburgh vs. Munster Dec 03 Edinburgh 2.80
3 Stormers vs. Dragons Dec 04 Stormers 21.60
4 Zebre vs. Glasgow Dec 04 Glasgow -11.30
5 Connacht vs. Benetton Dec 04 Connacht 9.70
6 Bulls vs. Cardiff Rugby Dec 04 Bulls 17.00
7 Leinster vs. Ulster Dec 04 Leinster 12.30
8 Lions vs. Scarlets Dec 05 Lions 7.30


Top 14 Predictions for Round 12

Team Ratings for Round 12

The basic method is described on my Department home page.
Here are the team ratings prior to this week’s games, along with the ratings at the start of the season.

Current Rating Rating at Season Start Difference
Stade Toulousain 8.01 6.34 1.70
La Rochelle 6.81 6.88 -0.10
Racing 92 5.28 4.86 0.40
Montpellier 4.64 4.18 0.50
Toulon 4.32 4.09 0.20
Bordeaux Begles 3.36 5.27 -1.90
Clermont 2.65 4.05 -1.40
Lyon 2.48 3.10 -0.60
Stade Francais 1.80 -1.05 2.90
Castres Olympique 1.63 2.87 -1.20
Section Paloise -0.61 -2.12 1.50
Aviron Bayonnais -2.49 -4.26 1.80
USA Perpignan -4.41 -2.75 -1.70
Brive -6.21 -4.20 -2.00


Performance So Far

So far there have been 77 matches played, 56 of which were correctly predicted, a success rate of 72.7%.
Here are the predictions for last week’s games.

Game Date Score Prediction Correct
1 La Rochelle vs. Castres Olympique Nov 27 53 – 7 9.60 TRUE
2 Montpellier vs. Aviron Bayonnais Nov 27 35 – 14 12.80 TRUE
3 Section Paloise vs. Brive Nov 27 22 – 6 11.70 TRUE
4 Stade Francais vs. Toulon Nov 27 12 – 17 5.00 FALSE
5 USA Perpignan vs. Bordeaux Begles Nov 27 23 – 20 -1.70 FALSE
6 Lyon vs. Stade Toulousain Nov 28 21 – 14 0.30 TRUE
7 Racing 92 vs. Clermont Nov 28 46 – 12 7.50 TRUE


Predictions for Round 12

Here are the predictions for Round 12. The prediction is my estimated expected points difference with a positive margin being a win to the home team, and a negative margin a win to the away team.

Game Date Winner Prediction
1 Aviron Bayonnais vs. Lyon Dec 04 Aviron Bayonnais 1.50
2 Bordeaux Begles vs. Brive Dec 04 Bordeaux Begles 16.10
3 Clermont vs. Montpellier Dec 04 Clermont 4.50
4 Stade Francais vs. La Rochelle Dec 04 Stade Francais 1.50
5 Stade Toulousain vs. USA Perpignan Dec 04 Stade Toulousain 18.90
6 Castres Olympique vs. Section Paloise Dec 05 Castres Olympique 8.70
7 Toulon vs. Racing 92 Dec 05 Toulon 5.50


Rugby Premiership Predictions for Round 12

Team Ratings for Round 12

The basic method is described on my Department home page.
Here are the team ratings prior to this week’s games, along with the ratings at the start of the season.

Current Rating Rating at Season Start Difference
Leicester Tigers 5.14 7.93 -2.80
Sale Sharks 4.43 4.14 0.30
Harlequins 3.88 3.92 -0.00
Gloucester 2.99 5.92 -2.90
Exeter Chiefs 2.74 3.67 -0.90
Northampton Saints 1.86 3.99 -2.10
Saracens 1.10 -5.00 6.10
Wasps -0.18 0.77 -1.00
London Irish -0.73 -1.65 0.90
Bristol -4.32 -2.43 -1.90
Bath -6.27 -9.15 2.90
Newcastle Falcons -7.88 -8.76 0.90
Worcester Warriors -11.69 -12.27 0.60


Performance So Far

So far there have been 53 matches played, 34 of which were correctly predicted, a success rate of 64.2%.
Here are the predictions for last week’s games.

Game Date Score Prediction Correct
1 Harlequins vs. Gloucester Nov 26 21 – 12 4.90 TRUE
2 Newcastle Falcons vs. Exeter Chiefs Nov 26 24 – 21 -7.30 FALSE
3 Sale Sharks vs. Bristol Nov 27 25 – 20 14.30 TRUE
4 Leicester Tigers vs. London Irish Nov 28 33 – 31 11.50 TRUE


Predictions for Round 12

Here are the predictions for Round 12. The prediction is my estimated expected points difference with a positive margin being a win to the home team, and a negative margin a win to the away team.

Game Date Winner Prediction
1 Bath vs. Harlequins Dec 03 Harlequins -5.70
2 Bristol vs. Leicester Tigers Dec 04 Leicester Tigers -5.00
3 Gloucester vs. Northampton Saints Dec 04 Gloucester 5.60
4 London Irish vs. Newcastle Falcons Dec 04 London Irish 11.60


November 28, 2022

99.44% pure

From the Guardian: Computer says there is a 80.58% probability painting is a real Renoir. The story goes on to say Dr Carina Popovici, Art Recognition’s CEO, believes that this ability to put a number on the degree of uncertainty is important.

It’s definitely valuable to put a number on the degree of uncertainty. What’s much less clear is that it’s valuable to put a number on the uncertainty to four-digit precision.   Let’s think about what it would take to be that precise.

If the 80.58% number was estimated from a proportion of observed data in some sense, quoting it to four digits would only make sense if the uncertainty was less than about 0.05%.  A standard error of 0.05% would need a sample size of more than five hundred million.

Another way you can get an estimate with high precision is including subjective expert opinion, which would be entirely appropriate in a context like this. There’s no limit to how precise this can be for the person whose opinion it is — you believe exactly what you believe — but there are very strong limits on how precise it can realistically be as a guide to others.  If the computer isn’t the one buying the Renoir, other people probably shouldn’t care about its opinion to more than one or two digits accuracy.

Sometimes when you come up with an estimate you want to quote it to higher precision than is directly useful — lots of statistical software, including some I write, quotes four or more digits in the default output. This allows rounding to happen closer to the point of use, such as before it’s in a headline in the mainstream media.

November 18, 2022

How many Covid cases?

From Hannah Martin at Stuff: Only 35% of Covid cases being reported, ministry says, after earlier saying it was 75%

The ministry’s latest Trends and Insights report, released on Monday, said “approximately three quarters of infections are being reported as cases”, based on wastewater testing.

However, it has since said that “based on updated wastewater methodology”, about 35% of infections were reported as cases as of the week to November 2.

This is a straightforward loss during communication:  the 75% was an estimate of how much the reporting had changed since the first Omicron peak, but it got into the Trends and Insights report as an absolute rate.  Dion O’Neale is quoted further down the story explaining this.

For future reference, it’s worth looking at what we can and can’t estimate well from various sources of information we might have.

The wastewater data has the advantage of including everyone in a set of cities and towns, adding up to the majority of the country; everybody poops. It has the disadvantage of not directly measuring cases or infections.  The wastewater data tells us how many Covid viral fragments are in the wastewater.  How that relates to infections depends on how many viral fragments each person sheds and how many of these make it intact to the collection point.  This isn’t known — it’s probably different for different people, and might depend on vaccination and previous infections and which variant you have and age and who knows what else. However, the population average probably changes slowly over time, so if the number of viral fragments is going up this week, the number of active infections is probably going up, and  if the number of viral fragments is going down, the number of active infections is probably going down.

Using the wastewater data, we can see that the ratio of reported cases to wastewater viral fragments has been going down slowly since the first Omicron peak.  We’ve got a lot of other reasons to think testing and reporting is going down, so that’s a good explanation. It’s especially a good explanation because most of the other reasons for a change (eg, less viral shedding in second infections) would make the ratio go up instead.  So, with the ratio of reported cases to viral fragments going down by 25% it makes sense to estimate that the ratio of reported cases to infections has gone down 25%.

Now all we need is to know what the reporting rate was at the peak. Which we don’t know. It couldn’t have been much higher than 60%, because some infections won’t have been symptomatic and some tests will have been false negatives.  If it was 60%, it’s down to roughly 40% now.  If it was lower than that at the peak, it’s lower than 40% now.  You could likely get somewhat better guesses by combining the epidemic models and the wastewater data, but it’s always going to be difficult.

You might think that hospitalisation and death data are less subject to under-reporting. This is true, but the proportion of infections leading to hospitalisation is (happily) going down due to vaccination and prior infection, and the proportion leading to death is (happily) going down even more due to better treatment.  On top of those changes, hospitalisation and death lag infection by quite a long time. The hospitalisation rate and death rate are directly important for policy, but they aren’t good indicators of current infections.

So, we’re a bit stuck. We can detect increases or decreases in infections fairly reliably with wastewater data, but absolute numbers are hard.  This is even more true for other diseases — in the future, there will hopefully be wastewater monitoring for influenza and maybe RSV, where we expect the case reporting rate to be massively lower than it is for Covid.

To get good absolute numbers we need a measurement of the actual infection rate in a random sample of people. That’s planned — originally for July 2022, but the timetable keeps slipping. A prevalence survey is a valuable complement to the wastewater data; it gives absolute numbers that can be used to calibrate the more precise and geographically detailed relative numbers from the wastewater.  Until we have a prevalence survey, the ESR dashboard is a good way to get a feeling for whether Covid infections are going up or down, and how fast.
November 16, 2022

Is Roy Morgan weird yet?

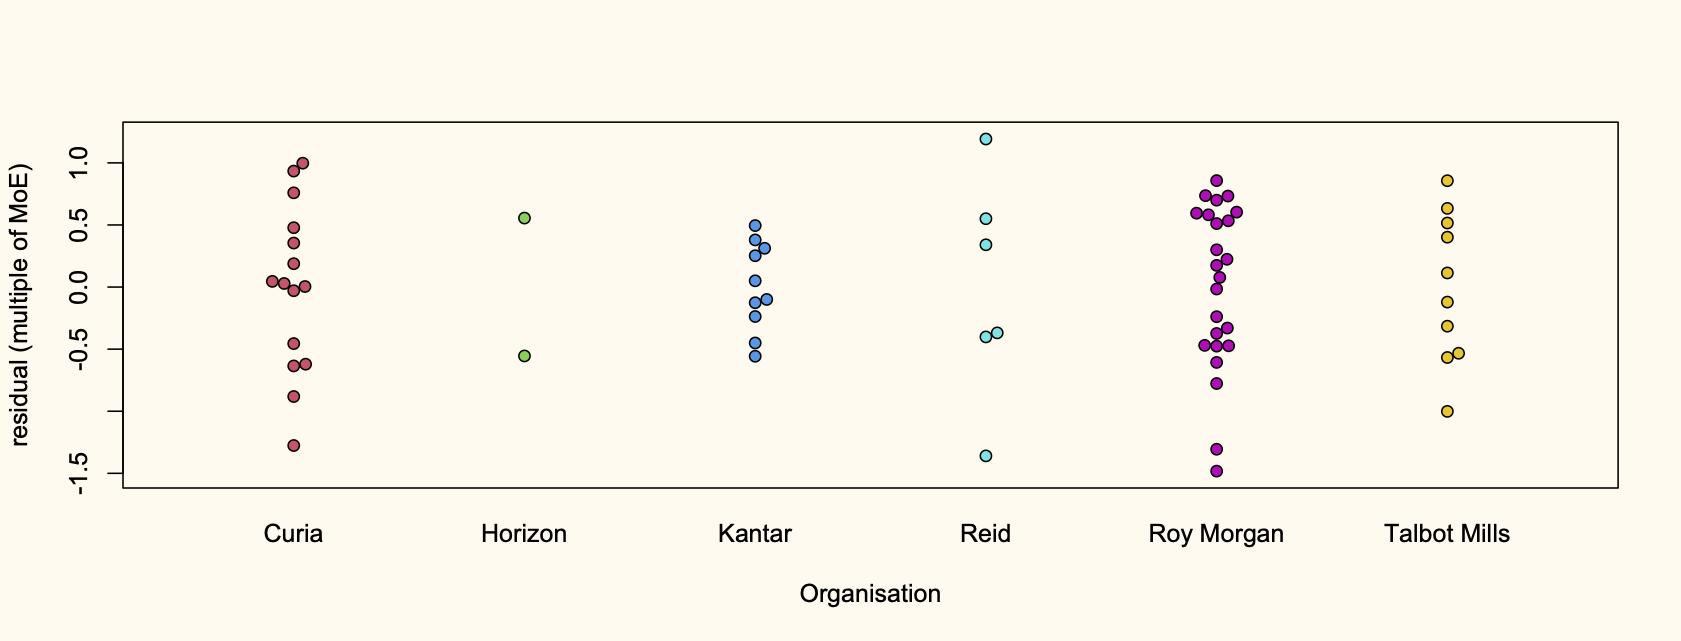
Some years ago, at the behest of Kiwi Nerd Twitter, I looked at whether the Roy Morgan poll results varied more than those from other organisations, and concluded that they didn’t. It was just that Roy Morgan published polls more often. They had a larger number of surprising results because they had a larger number of results.  Kiwi Nerd Twitter has come back, asking for a repeat.

I’m going to do analyses of two ways of measuring weirdness, for the major and semi-major parties. All the data comes from Wikipedia’s “Opinion polling for the next NZ Election“, so it runs from the last election to now.  First, I’ll look at National.

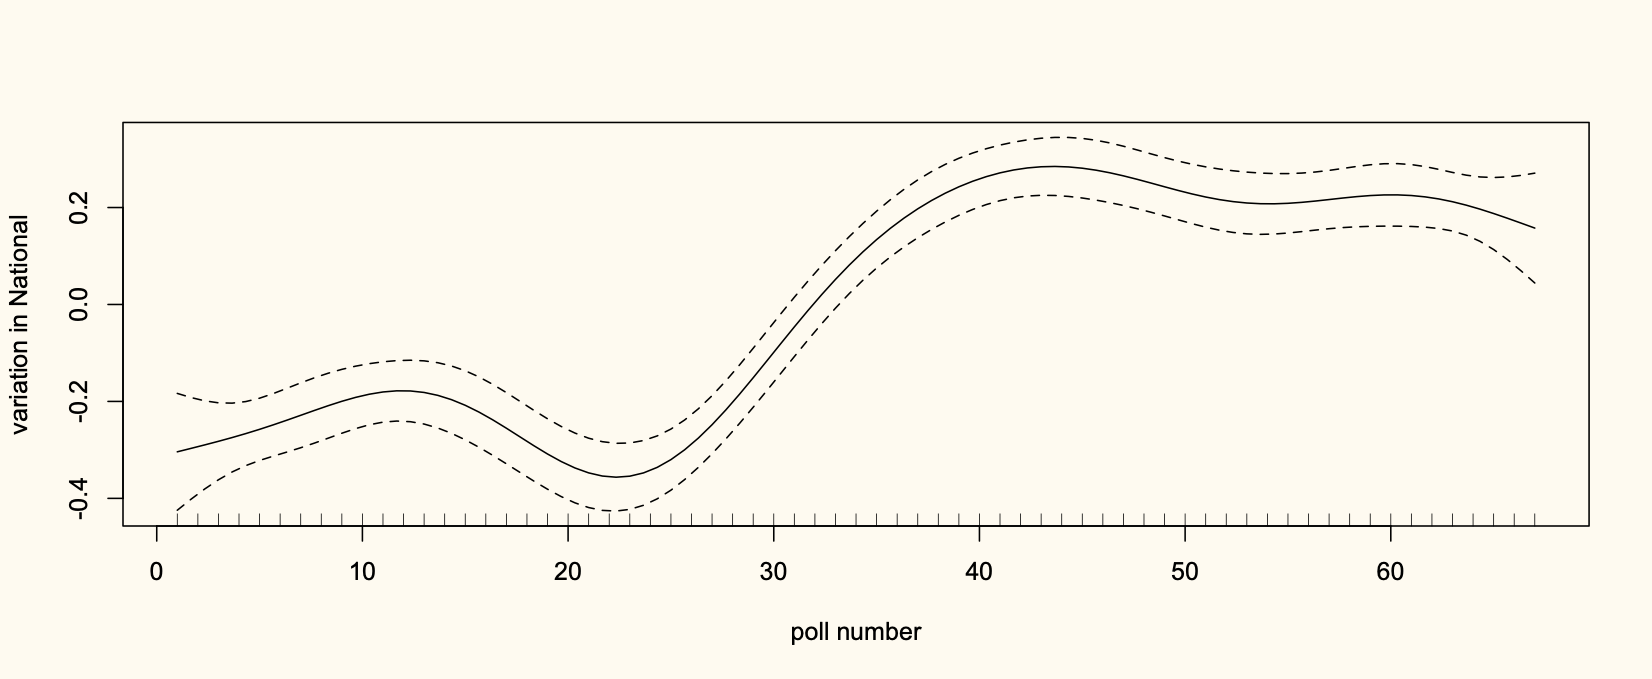
The first analysis is to look at departures from the general trend.  The general trend for National (from a spline smoother, fitted in R’s mgcv package, in a model that also has organisation effects) looks like this:

Support was low; it went up.

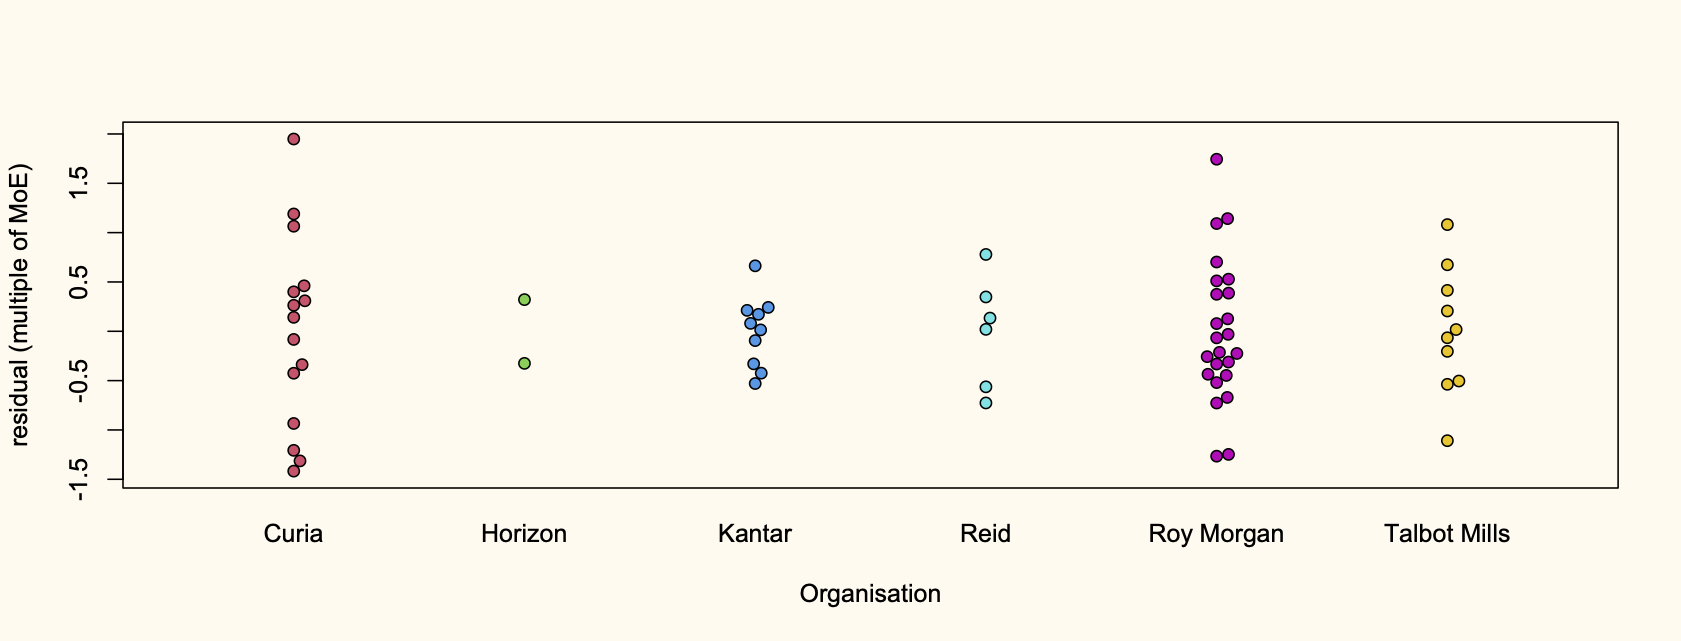
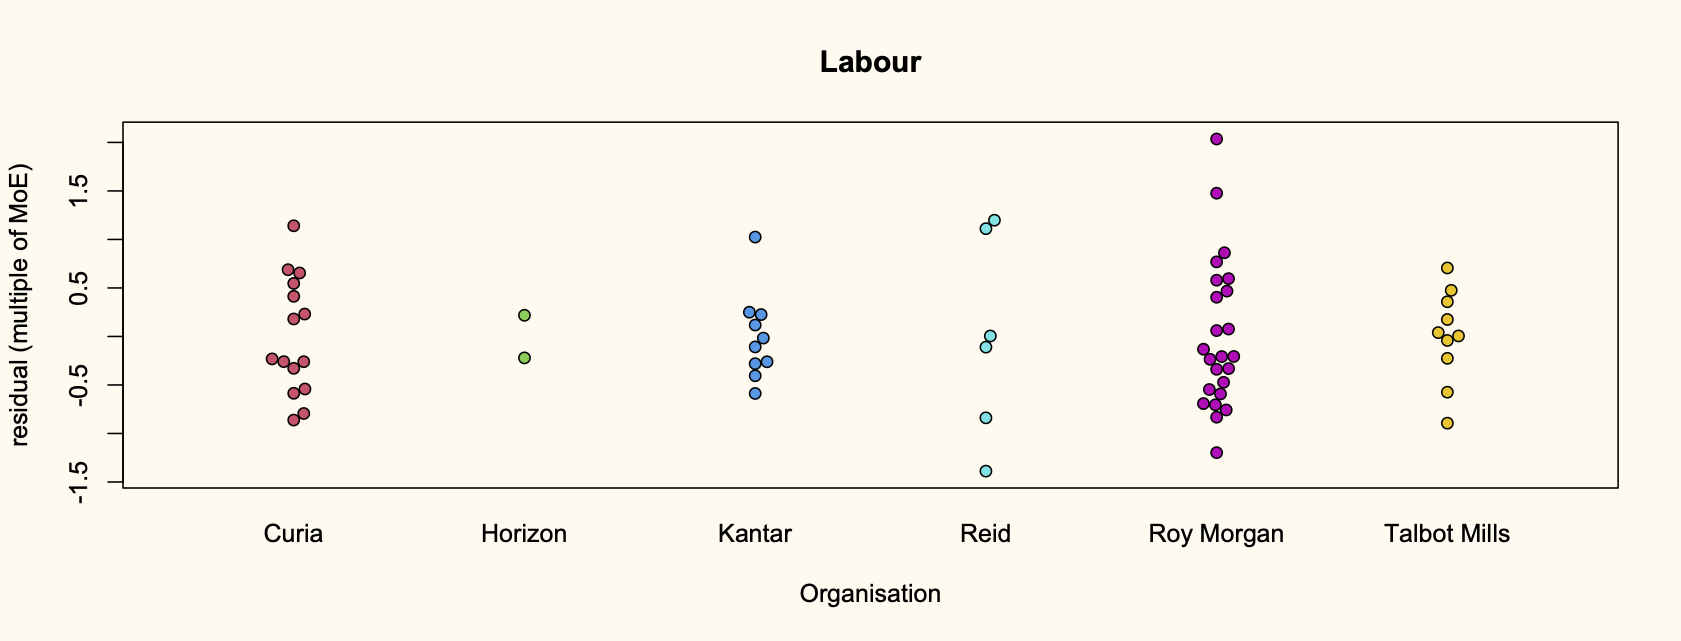
I subtracted off the trend, and scaled the departures by the margin of error (not the maximum margin of error). Here they are, split up by polling organisation

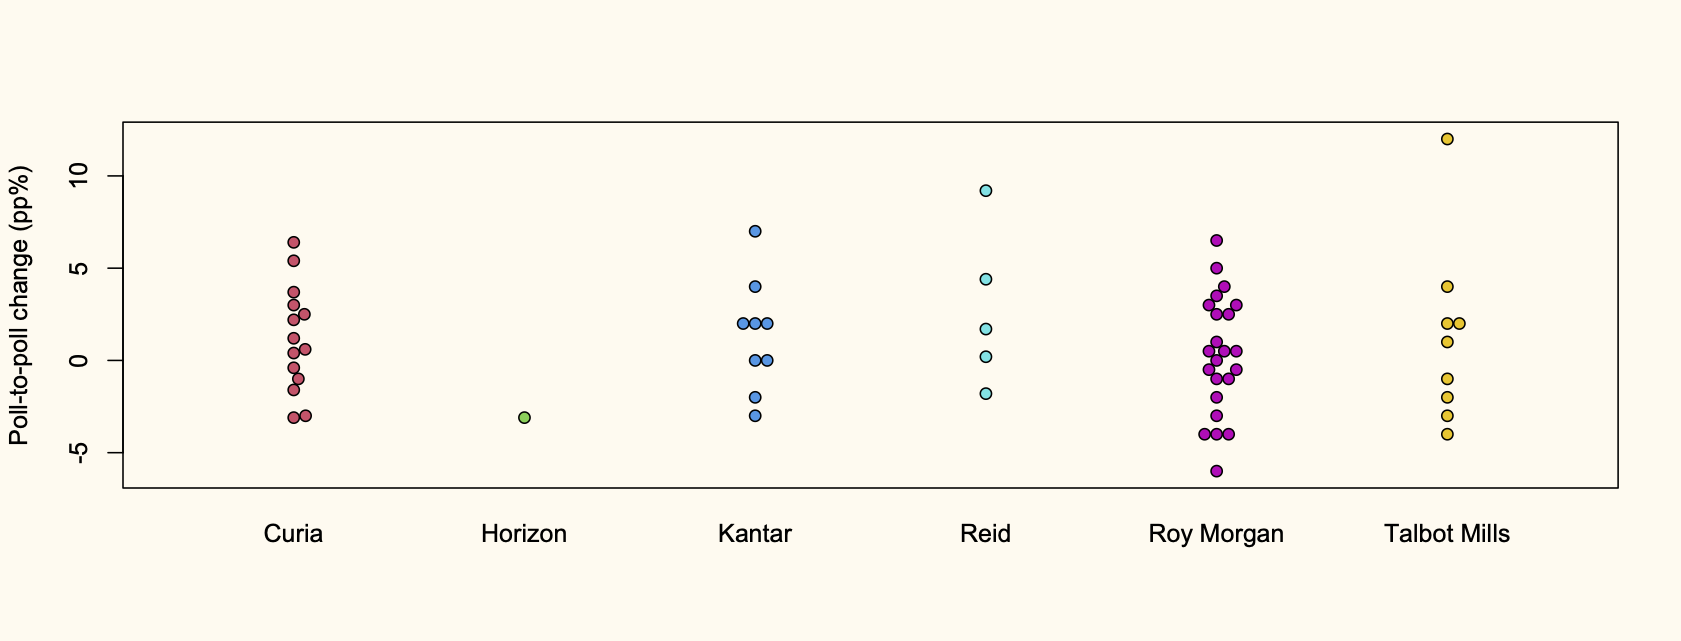
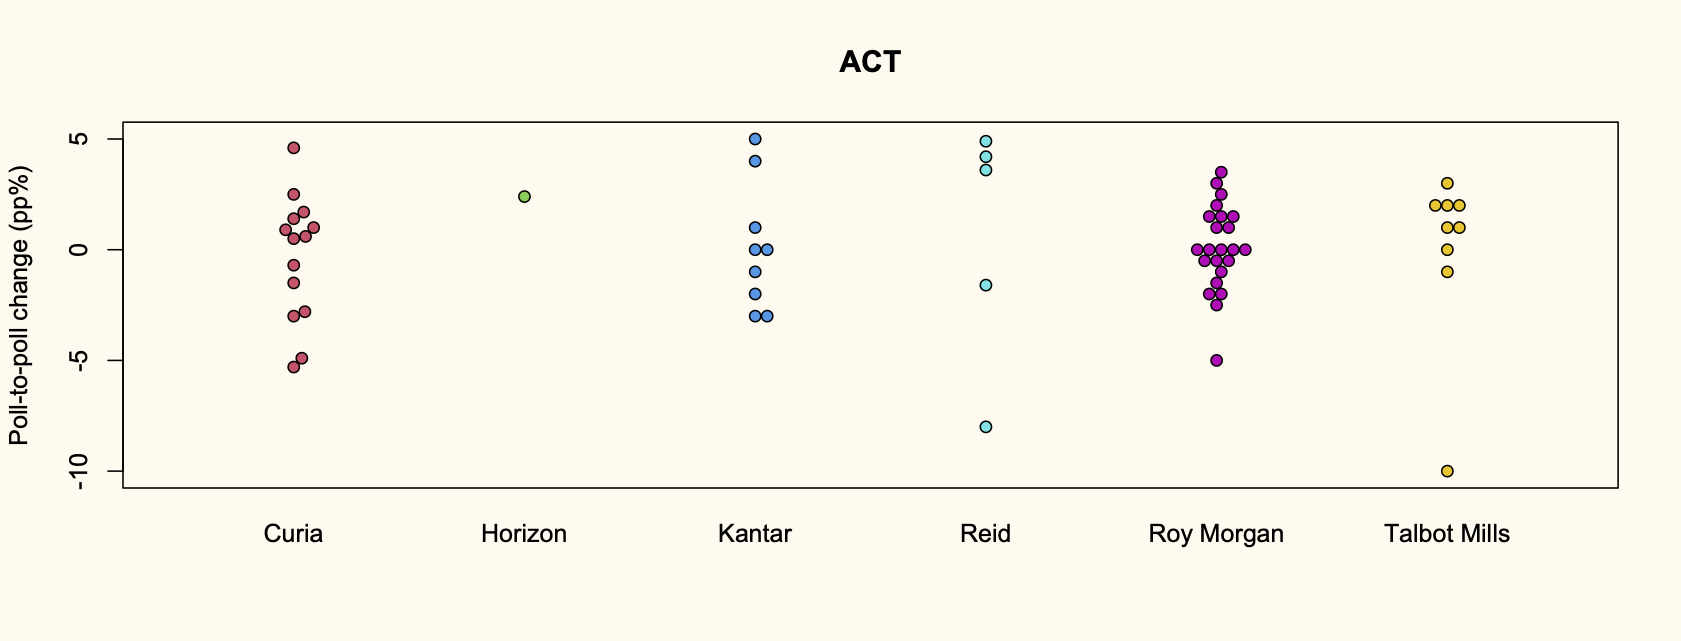
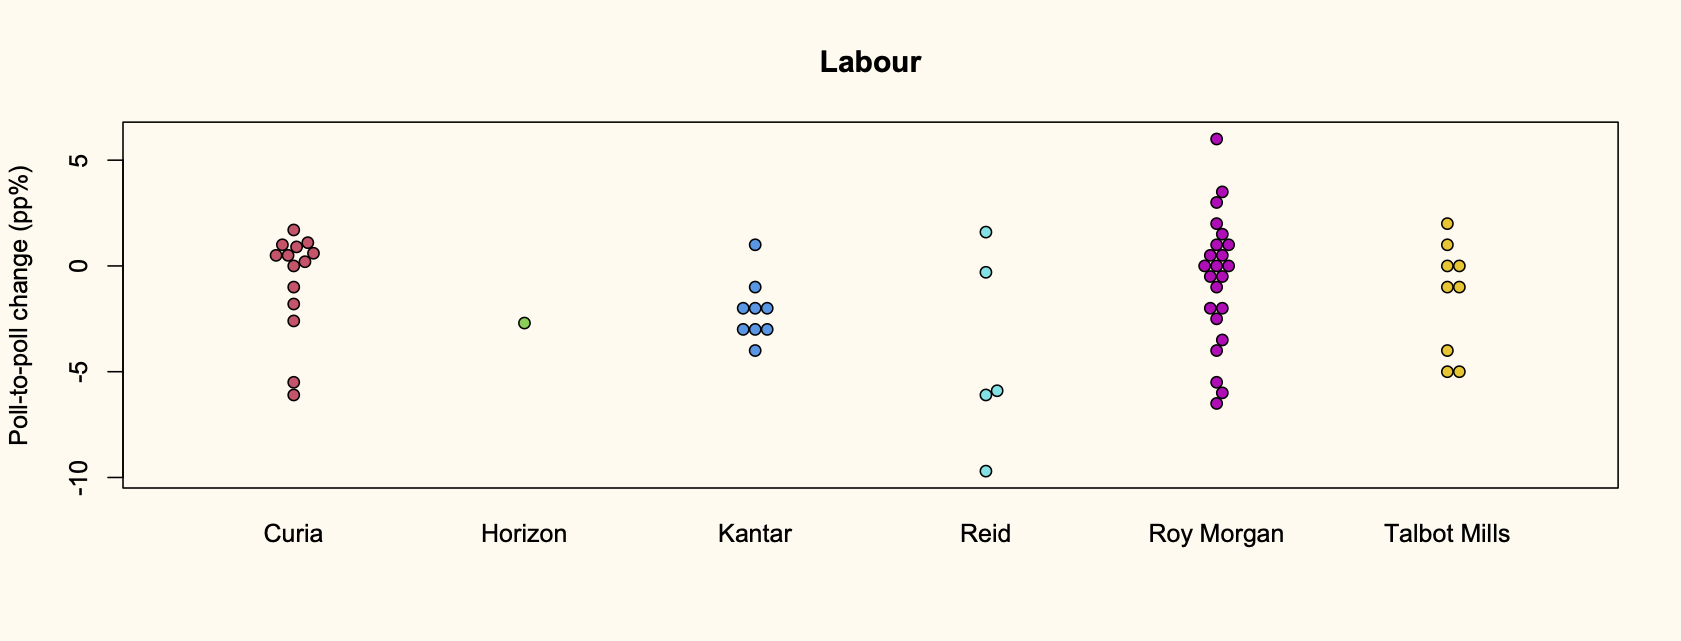
The other analysis I did was to look at poll-to-poll changes, without any modelling of trend. The units for these are just percentage points.

Next, the same things for Green Party support: departures from their overall trend

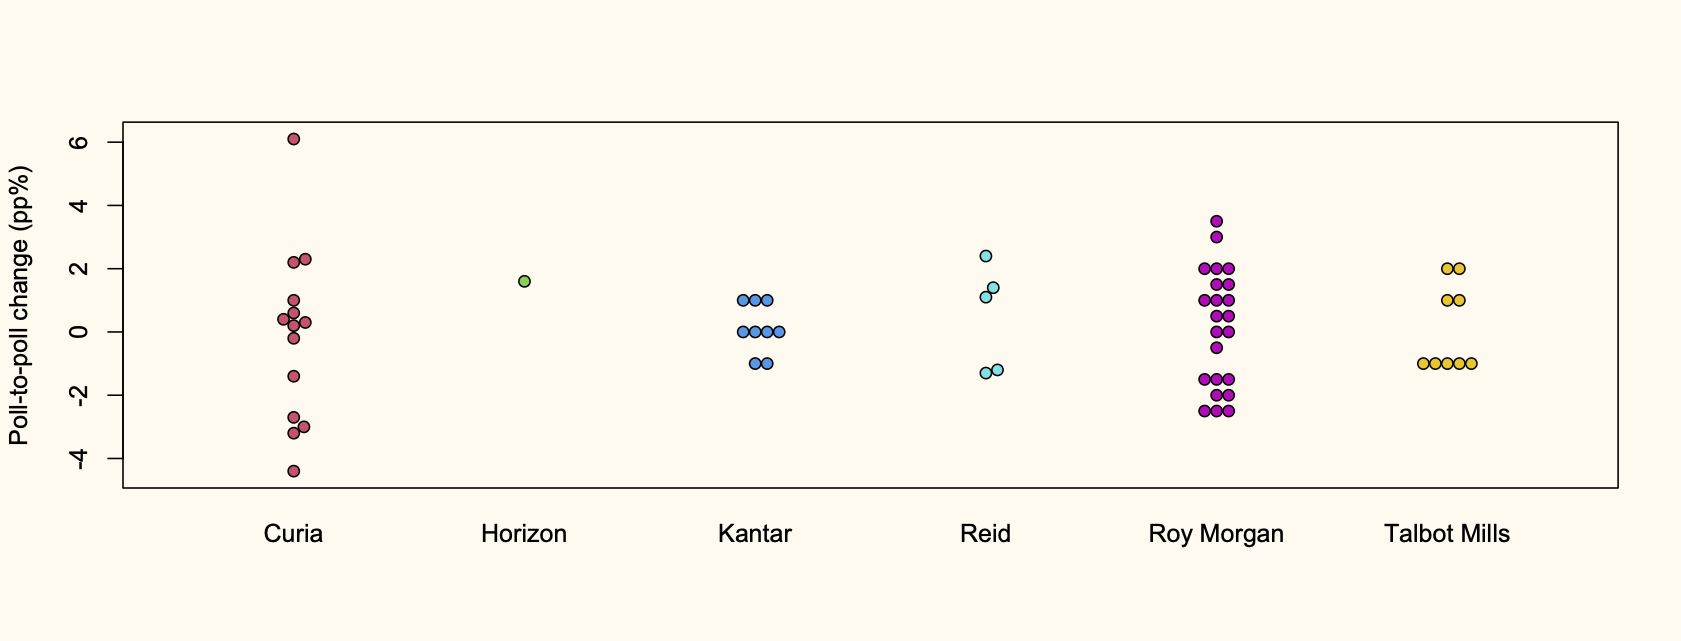
And poll-to-poll differences

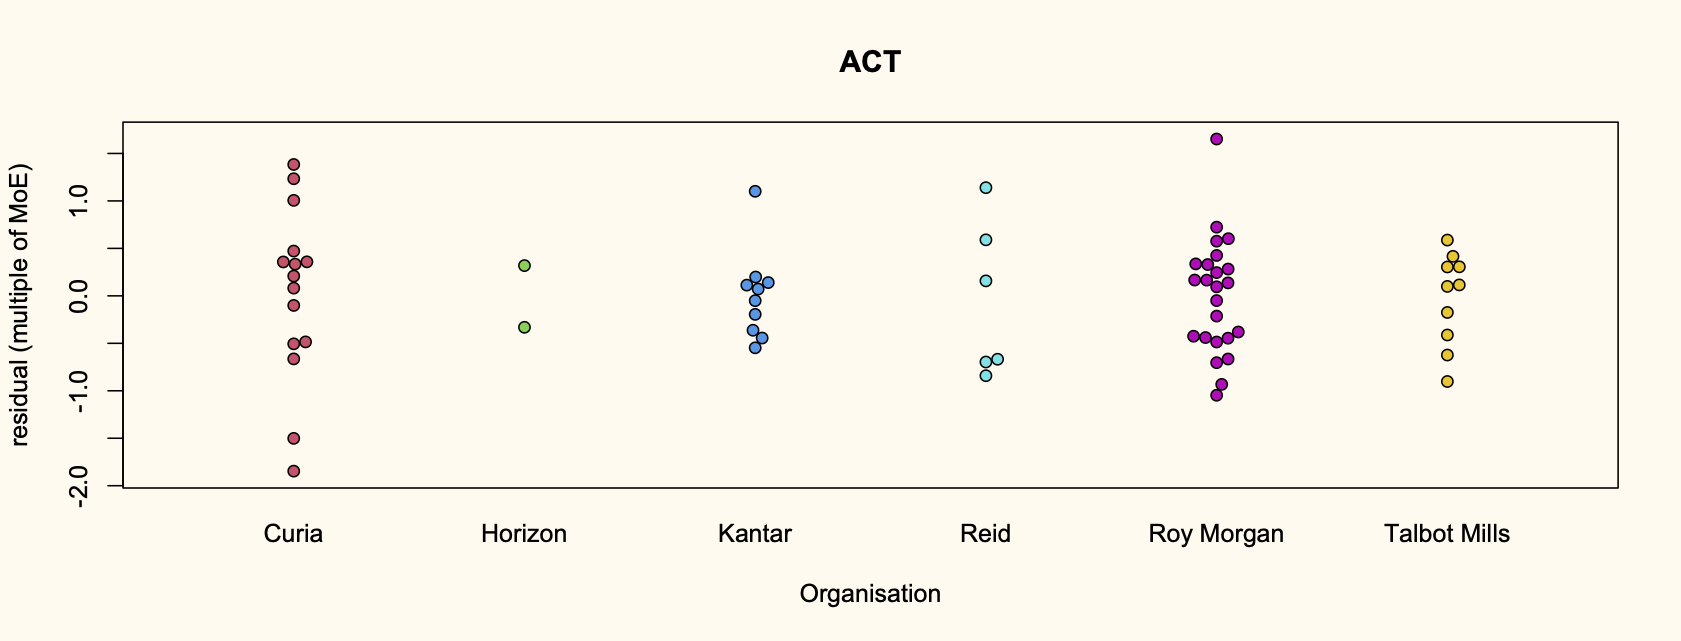
For ACT:

And finally for Labour


So, it’s complicated. The differences are mostly not huge, but for the Greens and Labour there does seem to be more variability in the Roy Morgan results. For National there isn’t, and probably not for ACT.  The Curia polls are also more variable for Green but not for Labour.  I think this makes Roy Morgan less weird than people usually say, but there does seem to be something there.

As an additional note, the trend models also confirm that the variance of poll results is about twice what you’d expect from a simple sampling model. This means the margin of error will be about 1.4 times what the pollers traditionally claim: about 4.5% near 50% and about 1% near the MMP threshold of 5%

November 15, 2022

Rugby Premiership Predictions for Round 11

Team Ratings for Round 11

The basic method is described on my Department home page.
Here are the team ratings prior to this week’s games, along with the ratings at the start of the season.

Current Rating Rating at Season Start Difference
Leicester Tigers 5.68 7.93 -2.20
Sale Sharks 4.96 4.14 0.80
Harlequins 3.62 3.92 -0.30
Exeter Chiefs 3.31 3.67 -0.40
Gloucester 3.25 5.92 -2.70
Northampton Saints 1.86 3.99 -2.10
Saracens 1.10 -5.00 6.10
Wasps -0.18 0.77 -1.00
London Irish -1.27 -1.65 0.40
Bristol -4.85 -2.43 -2.40
Bath -6.27 -9.15 2.90
Newcastle Falcons -8.46 -8.76 0.30
Worcester Warriors -11.69 -12.27 0.60


Performance So Far

So far there have been 49 matches played, 31 of which were correctly predicted, a success rate of 63.3%.
Here are the predictions for last week’s games.

Game Date Score Prediction Correct
1 Bath vs. Leicester Tigers Nov 12 19 – 18 -8.50 FALSE
2 Gloucester vs. Newcastle Falcons Nov 13 21 – 27 18.70 FALSE
3 Exeter Chiefs vs. London Irish Nov 13 22 – 17 9.70 TRUE
4 Saracens vs. Northampton Saints Nov 14 45 – 39 3.30 TRUE


Predictions for Round 11

Here are the predictions for Round 11. The prediction is my estimated expected points difference with a positive margin being a win to the home team, and a negative margin a win to the away team.

Game Date Winner Prediction
1 Harlequins vs. Gloucester Nov 26 Harlequins 4.90
2 Newcastle Falcons vs. Exeter Chiefs Nov 26 Exeter Chiefs -7.30
3 Sale Sharks vs. Bristol Nov 27 Sale Sharks 14.30
4 Leicester Tigers vs. London Irish Nov 28 Leicester Tigers 11.50


November 8, 2022

United Rugby Championship Predictions for Week 8

Team Ratings for Week 8

The basic method is described on my Department home page.
Here are the team ratings prior to this week’s games, along with the ratings at the start of the season.

Current Rating Rating at Season Start Difference
Leinster 17.43 16.79 0.60
Ulster 10.22 9.27 1.00
Bulls 7.52 7.84 -0.30
Stormers 7.40 7.14 0.30
Munster 7.04 9.78 -2.70
Sharks 5.64 6.95 -1.30
Edinburgh 5.52 3.58 1.90
Glasgow 0.39 -0.00 0.40
Connacht 0.04 -1.60 1.60
Lions -0.81 -1.74 0.90
Ospreys -1.90 -0.83 -1.10
Scarlets -4.08 -1.23 -2.80
Benetton -5.42 -3.68 -1.70
Cardiff Rugby -6.20 -7.42 1.20
Dragons -10.19 -11.81 1.60
Zebre -16.57 -16.99 0.40


Performance So Far

So far there have been 53 matches played, 40 of which were correctly predicted, a success rate of 75.5%.
Here are the predictions for last week’s games.

Game Date Score Prediction Correct
1 Glasgow vs. Benetton Oct 29 37 – 0 8.20 TRUE
2 Scarlets vs. Leinster Oct 29 5 – 35 -15.70 TRUE
3 Lions vs. Stormers Oct 30 22 – 31 -3.00 TRUE
4 Dragons vs. Zebre Oct 30 47 – 7 8.70 TRUE
5 Munster vs. Ulster Oct 30 14 – 15 1.30 FALSE
6 Ospreys vs. Connacht Oct 30 19 – 22 3.90 FALSE
7 Bulls vs. Sharks Oct 31 40 – 27 5.00 TRUE
8 Cardiff Rugby vs. Edinburgh Oct 31 17 – 25 -7.00 TRUE


Predictions for Week 8

Here are the predictions for Week 8. The prediction is my estimated expected points difference with a positive margin being a win to the home team, and a negative margin a win to the away team.

Game Date Winner Prediction
1 Stormers vs. Scarlets Nov 26 Stormers 16.00
2 Ulster vs. Zebre Nov 26 Ulster 31.30
3 Benetton vs. Edinburgh Nov 26 Edinburgh -6.40
4 Bulls vs. Ospreys Nov 26 Bulls 13.90
5 Leinster vs. Glasgow Nov 27 Leinster 21.50
6 Munster vs. Connacht Nov 27 Munster 11.00
7 Lions vs. Dragons Nov 28 Lions 13.90
8 Sharks vs. Cardiff Rugby Nov 28 Sharks 16.30


Top 14 Predictions for Round 11

Team Ratings for Round 11

The basic method is described on my Department home page.
Here are the team ratings prior to this week’s games, along with the ratings at the start of the season.

Current Rating Rating at Season Start Difference
Stade Toulousain 8.34 6.34 2.00
La Rochelle 5.75 6.88 -1.10
Racing 92 4.47 4.86 -0.40
Montpellier 4.23 4.18 0.00
Toulon 3.82 4.09 -0.30
Bordeaux Begles 3.59 5.27 -1.70
Clermont 3.46 4.05 -0.60
Castres Olympique 2.70 2.87 -0.20
Stade Francais 2.30 -1.05 3.40
Lyon 2.14 3.10 -1.00
Section Paloise -0.82 -2.12 1.30
Aviron Bayonnais -2.08 -4.26 2.20
USA Perpignan -4.65 -2.75 -1.90
Brive -5.99 -4.20 -1.80


Performance So Far

So far there have been 70 matches played, 51 of which were correctly predicted, a success rate of 72.9%.
Here are the predictions for last week’s games.

Game Date Score Prediction Correct
1 Brive vs. La Rochelle Nov 06 17 – 19 -5.60 TRUE
2 Clermont vs. Aviron Bayonnais Nov 06 20 – 25 13.20 FALSE
3 Lyon vs. Castres Olympique Nov 06 26 – 20 5.90 TRUE
4 Racing 92 vs. USA Perpignan Nov 06 44 – 20 14.70 TRUE
5 Stade Toulousain vs. Stade Francais Nov 06 16 – 16 13.50 FALSE
6 Section Paloise vs. Bordeaux Begles Nov 07 33 – 7 0.50 TRUE
7 Toulon vs. Montpellier Nov 07 16 – 26 7.20 FALSE


Predictions for Round 11

Here are the predictions for Round 11. The prediction is my estimated expected points difference with a positive margin being a win to the home team, and a negative margin a win to the away team.

Game Date Winner Prediction
1 La Rochelle vs. Castres Olympique Nov 27 La Rochelle 9.60
2 Montpellier vs. Aviron Bayonnais Nov 27 Montpellier 12.80
3 Section Paloise vs. Brive Nov 27 Section Paloise 11.70
4 Stade Francais vs. Toulon Nov 27 Stade Francais 5.00
5 USA Perpignan vs. Bordeaux Begles Nov 27 Bordeaux Begles -1.70
6 Lyon vs. Stade Toulousain Nov 28 Lyon 0.30
7 Racing 92 vs. Clermont Nov 28 Racing 92 7.50


Rugby Premiership Predictions for Round 10

Team Ratings for Round 10

The basic method is described on my Department home page.
Here are the team ratings prior to this week’s games, along with the ratings at the start of the season.

Current Rating Rating at Season Start Difference
Leicester Tigers 6.23 7.93 -1.70
Sale Sharks 4.96 4.14 0.80
Gloucester 4.47 5.92 -1.40
Harlequins 3.62 3.92 -0.30
Exeter Chiefs 3.61 3.67 -0.10
Northampton Saints 2.07 3.99 -1.90
Saracens 0.89 -5.00 5.90
Wasps -0.18 0.77 -1.00
London Irish -1.57 -1.65 0.10
Bristol -4.85 -2.43 -2.40
Bath -6.82 -9.15 2.30
Newcastle Falcons -9.68 -8.76 -0.90
Worcester Warriors -11.69 -12.27 0.60


Performance So Far

So far there have been 45 matches played, 29 of which were correctly predicted, a success rate of 64.4%.
Here are the predictions for last week’s games.

Game Date Score Prediction Correct
1 Northampton Saints vs. Exeter Chiefs Nov 05 26 – 19 2.40 TRUE
2 Sale Sharks vs. Gloucester Nov 05 27 – 17 4.30 TRUE
3 Newcastle Falcons vs. Bath Nov 06 10 – 17 2.70 FALSE
4 Bristol vs. Saracens Nov 06 10 – 25 0.40 FALSE


Predictions for Round 10

Here are the predictions for Round 10. The prediction is my estimated expected points difference with a positive margin being a win to the home team, and a negative margin a win to the away team.

Game Date Winner Prediction
1 Bath vs. Leicester Tigers Nov 12 Leicester Tigers -8.50
2 Gloucester vs. Newcastle Falcons Nov 13 Gloucester 18.70
3 Exeter Chiefs vs. London Irish Nov 13 Exeter Chiefs 9.70
4 Saracens vs. Northampton Saints Nov 14 Saracens 3.30