Posts from July 2021 (14)

July 31, 2021

Viral load

You might have seen, on social media (or asocial or antisocial media) claims that the Delta variant of Covid can be spread by vaccinated people just as easily as unvaccinated people.  It’s not true, but if you strip out the two big reasons it’s not true, what’s left is still worrying. Here’s two relatively careful stories: WaPo, NYTimes.

We know that vaccination dramatically reduces the chance that you’ll spread Covid to someone else by dramatically reducing the chance you’ll be infected if you’re exposed.  Vaccination of people you come into contact with also reduces the chance you’ll be exposed, because they are less likely to be infected.

If vaccination reduces your chance of infection with Delta by 80%, it’s going to reduce your chance of transmitting Delta by around 80%. Reducing the uncertainty on that number is important in public health planning: the chance of transmitting Delta affects how much community protection we get from a given vaccination rate, and so affects what other precautions (MIQ, lockdown, masks, etc) need to be taken to get to an acceptable level of risk.  For example, the modelling of community protection by researchers at Te Punaha Matatini had a baseline assumption that ‘breakthrough’ infections were half as likely to transmit the disease as infections in unvaccinated people (though they also used a lower estimate of vaccine effectiveness in preventing infection than I think we’d use now, so it cancels out to some extent).

Estimating ‘secondary transmission’ is hard. Ideally, you’d trace all the contacts of each infected person and determine how many people they actually transmitted the virus to.  In practice, that won’t work.  In countries like Australia and New Zealand we don’t have enough free-range infections (or vaccination) to get reliable quantitative estimates information. Somewhere like the US or Britain, where you can get a sample of hundreds of cases, you can’t easily track down who infected whom.  There’s some information from comparing high and low vaccination regions in a country such as Israel, and from cluster-randomised trials that vaccinate whole communities at once, but not enough.

Logically, breakthrough infections might be about the same as unvaccinated infections (an infection is an infection), or less transmissible (your immune system reduces the viral load) or even more transmissible (only the people who are especially susceptible get infected).  Reason unaided won’t get us any further; we need data.

One approach is to estimate the transmission from the amount of virus people are shedding.  This roughly works — viral load explains the extra transmissibility of Delta.  If we find that ‘breakthrough’ infections shed a lot less virus, they’re probably less transmissible; if they shed about the same, they’re probably about the same.  According to the CDC, they’re about the same.  This doesn’t mean the vaccine has no effect on viral load — it could easily be that the people who get breakthrough infections would have had higher than average viral load without the vaccine, and the vaccine has reduced it to only average. It doesn’t mean that vaccination isn’t preventing infections — vaccination absolutely is.  It does mean the relationship between number of cases walking  around in the population and risk of new infections is about the same.  Knowing this will allow better estimates of population risk and better choices of precautions.
July 30, 2021

The missing $30,000

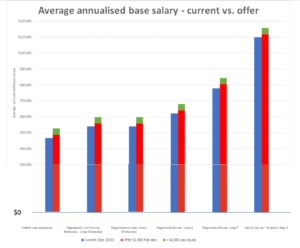
A graph about the current salary negotiations for nurses, tweeted by Andrew Little, the Minister of Health:

There are many situations when it is entirely proper to draw a graph with a y-axis starting somewhere other than zero.  There are essentially no situations where a bar chart should have the axis starting somewhere other than zero (the very occasional exception is when ‘zero’ basically is a number other than zero).  There’s a reason for this: in a bar chart, the area (length) of the bar conveys the information, and cutting the feet out from under the bar changes the information.

That’s all very well and good, you say, but is there empirical evidence that real people are misled by truncated bar charts? I’m glad you asked! Yes, there was a research paper published last year, titled “Truncating Bar Graphs Persistently Misleads Viewers”, which found …well, what it says on the label.  A truncated graph was misleading; it was still misleading for graphically-sophisticated nerds; and it was still misleading when accompanied by a warning. Truncated bar charts are bad. Don’t use them.

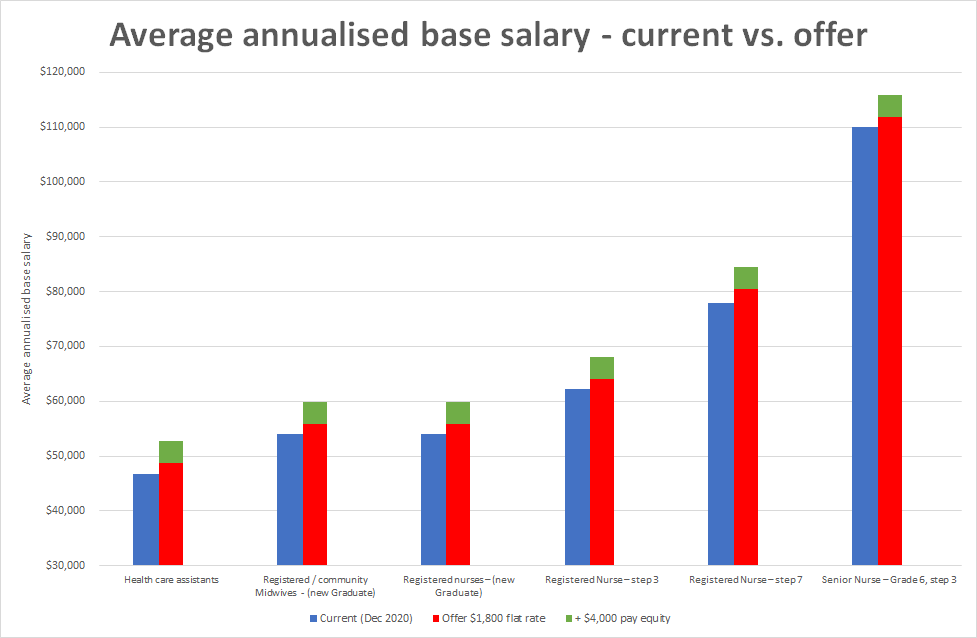
Sticking the missing $30,000 into the bottom of the Minister’s graph gives this:

July 29, 2021

Briefly

  • Queueing theory is a branch of applied probability and so is StatsChat relevant. Tava Olsen, a professor in the UoA business school, was interviewed on RadioNZ about the MIQ booking system and wrote for The Spinoff.   (disclaimer: I recommended her to RadioNZ)
  • Matt Nippert writes in the Herald about Pharmac and — unusually for a story about Pharmac — looks at the tradeoffs involved in what they choose to fund.
  • Via Axios: JAMA, the medical journal, requested revisions to the research paper with data supporting approval of aducanumab for Alzheimer’s disease. That’s pretty standard.  Apparently the company said “Nope” and will look for a different journal.  This isn’t unheard of — sometimes, reviewers are just wrong and you try another journal — but it is another unusual occurrence.
  • Mediawatch reported that economic forecasts are often wrong.  That’s not really surprising: economics says that (a) recessions are unpredictable and (b) if economists benefit from their forecasts being mentioned in the news they will tend to produce newsworthy forecasts. I suggested that the forecasts should come with uncertainty intervals, so we have some ability to tell if they’re bad at forecasting or it’s just that the economy is uncertain.
July 27, 2021

NRL Predictions for Round 20

Team Ratings for Round 20

The basic method is described on my Department home page.
Here are the team ratings prior to this week’s games, along with the ratings at the start of the season.

Current Rating Rating at Season Start Difference
Storm 22.69 14.53 8.20
Panthers 12.30 8.88 3.40
Rabbitohs 9.52 7.73 1.80
Eels 9.43 1.68 7.70
Sea Eagles 8.42 -4.77 13.20
Roosters 4.24 10.25 -6.00
Raiders -0.76 6.98 -7.70
Sharks -3.08 -0.76 -2.30
Titans -3.17 -7.22 4.10
Wests Tigers -5.03 -3.07 -2.00
Warriors -5.93 -1.84 -4.10
Dragons -6.63 -4.95 -1.70
Knights -7.36 -2.61 -4.80
Cowboys -10.24 -8.05 -2.20
Broncos -12.93 -11.16 -1.80
Bulldogs -13.45 -7.62 -5.80


Performance So Far

So far there have been 144 matches played, 104 of which were correctly predicted, a success rate of 72.2%.
Here are the predictions for last week’s games.

Game Date Score Prediction Correct
1 Eels vs. Raiders Jul 22 10 – 12 12.80 FALSE
2 Roosters vs. Knights Jul 23 28 – 8 9.80 TRUE
3 Cowboys vs. Storm Jul 23 16 – 20 -35.20 TRUE
4 Rabbitohs vs. Warriors Jul 24 60 – 22 10.80 TRUE
5 Sea Eagles vs. Wests Tigers Jul 24 44 – 24 12.00 TRUE
6 Panthers vs. Broncos Jul 24 18 – 12 25.60 TRUE
7 Dragons vs. Titans Jul 25 10 – 32 -3.20 TRUE
8 Bulldogs vs. Sharks Jul 25 24 – 44 -8.30 TRUE


Predictions for Round 20

Here are the predictions for Round 20. The prediction is my estimated expected points difference with a positive margin being a win to the home team, and a negative margin a win to the away team.

Game Date Winner Prediction
1 Roosters vs. Eels Jul 29 Eels -5.20
2 Wests Tigers vs. Warriors Jul 30 Wests Tigers 0.90
3 Broncos vs. Cowboys Jul 30 Broncos 0.30
4 Dragons vs. Rabbitohs Jul 31 Rabbitohs -16.10
5 Knights vs. Raiders Jul 31 Raiders -6.60
6 Storm vs. Panthers Jul 31 Storm 10.40
7 Bulldogs vs. Titans Aug 01 Titans -13.30
8 Sharks vs. Sea Eagles Aug 01 Sea Eagles -11.50


Currie Cup Predictions for Round 8

Team Ratings for Round 8

The basic method is described on my Department home page.
Here are the team ratings prior to this week’s games, along with the ratings at the start of the season.


Current Rating Rating at Season Start Difference
Sharks 5.96 5.19 0.80
Bulls 4.43 5.14 -0.70
Western Province 2.96 3.28 -0.30
Lions 1.51 3.74 -2.20
Cheetahs -3.12 -2.17 -0.90
Pumas -4.70 -5.67 1.00
Griquas -7.02 -9.50 2.50


Performance So Far

So far there have been 15 matches played, 9 of which were correctly predicted, a success rate of 60%.
Here are the predictions for last week’s games.


Game Date Score Prediction Correct
1 Cheetahs vs. Sharks Jul 24 30 – 47 -5.10 TRUE
2 Pumas vs. Western Province Jul 25 23 – 37 -3.70 TRUE
3 Bulls vs. Lions Jul 25 40 – 21 4.80 TRUE


Predictions for Round 8

Here are the predictions for Round 8. The prediction is my estimated expected points difference with a positive margin being a win to the home team, and a negative margin a win to the away team.


Game Date Winner Prediction
1 Lions vs. Pumas Jul 30 Lions 9.20
2 Western Province vs. Bulls Jul 31 Western Province 1.50
3 Sharks vs. Griquas Jul 31 Sharks 16.00


July 25, 2021

Currie Cup Predictions for Round 7

Team Ratings for Round 7

I got caught out with the Round 6 games being played midweek so missed out on predicting one game prior to it being played. As always my predictions are not altered even though made after the game has been played. The Currie Cup is proving difficult to predict however.

The basic method is described on my Department home page.
Here are the team ratings prior to this week’s games, along with the ratings at the start of the season.

Current Rating Rating at Season Start Difference
Sharks 5.45 5.19 0.30
Bulls 3.85 5.14 -1.30
Western Province 2.50 3.28 -0.80
Lions 2.08 3.74 -1.70
Cheetahs -2.61 -2.17 -0.40
Pumas -4.24 -5.67 1.40
Griquas -7.02 -9.50 2.50


Performance So Far

So far there have been 12 matches played, 6 of which were correctly predicted, a success rate of 50%.
Here are the predictions for last week’s games.

Game Date Score Prediction Correct
1 Lions vs. Griquas Jul 21 31 – 41 13.80 FALSE
2 Cheetahs vs. Western Province Jul 21 38 – 21 -3.60 FALSE


Predictions for Round 7

Here are the predictions for Round 7. The prediction is my estimated expected points difference with a positive margin being a win to the home team, and a negative margin a win to the away team.

Game Date Winner Prediction
1 Cheetahs vs. Sharks Jul 24 Sharks -5.10
2 Pumas vs. Western Province Jul 25 Western Province -3.70
3 Bulls vs. Lions Jul 25 Bulls 4.80


July 20, 2021

NRL Predictions for Round 19

Team Ratings for Round 19

The basic method is described on my Department home page.
Here are the team ratings prior to this week’s games, along with the ratings at the start of the season.

Current Rating Rating at Season Start Difference
Storm 25.32 14.53 10.80
Panthers 13.99 8.88 5.10
Eels 10.72 1.68 9.00
Sea Eagles 7.70 -4.77 12.50
Rabbitohs 7.21 7.73 -0.50
Roosters 3.33 10.25 -6.90
Raiders -2.05 6.98 -9.00
Warriors -3.63 -1.84 -1.80
Sharks -4.12 -0.76 -3.40
Wests Tigers -4.31 -3.07 -1.20
Titans -4.79 -7.22 2.40
Dragons -5.01 -4.95 -0.10
Knights -6.45 -2.61 -3.80
Bulldogs -12.41 -7.62 -4.80
Cowboys -12.87 -8.05 -4.80
Broncos -14.62 -11.16 -3.50


Performance So Far

So far there have been 136 matches played, 97 of which were correctly predicted, a success rate of 71.3%.
Here are the predictions for last week’s games.

Game Date Score Prediction Correct
1 Titans vs. Eels Jul 16 8 – 26 -11.30 TRUE
2 Sea Eagles vs. Dragons Jul 16 32 – 18 12.40 TRUE
3 Raiders vs. Sharks Jul 17 34 – 18 -0.90 FALSE
4 Cowboys vs. Roosters Jul 17 18 – 34 -12.50 TRUE
5 Storm vs. Knights Jul 17 48 – 4 29.20 TRUE
6 Warriors vs. Panthers Jul 18 16 – 30 -18.40 TRUE
7 Broncos vs. Wests Tigers Jul 18 24 – 42 -5.00 TRUE
8 Rabbitohs vs. Bulldogs Jul 18 32 – 24 22.10 TRUE


Predictions for Round 19

Here are the predictions for Round 19. The prediction is my estimated expected points difference with a positive margin being a win to the home team, and a negative margin a win to the away team.

Game Date Winner Prediction
1 Eels vs. Raiders Jul 22 Eels 12.80
2 Roosters vs. Knights Jul 23 Roosters 9.80
3 Cowboys vs. Storm Jul 23 Storm -35.20
4 Rabbitohs vs. Warriors Jul 24 Rabbitohs 10.80
5 Sea Eagles vs. Wests Tigers Jul 24 Sea Eagles 12.00
6 Panthers vs. Broncos Jul 24 Panthers 25.60
7 Dragons vs. Titans Jul 25 Titans -3.20
8 Bulldogs vs. Sharks Jul 25 Sharks -8.30


Currie Cup Predictions for Round 6

Team Ratings for Round 6

No actual games played last weekend so previous week results are for two weekends ago. Whether games will be played this weekend, who knows.

The basic method is described on my Department home page.
Here are the team ratings prior to this week’s games, along with the ratings at the start of the season.

Current Rating Rating at Season Start Difference
Sharks 5.45 5.19 0.30
Bulls 3.85 5.14 -1.30
Western Province 3.25 3.28 -0.00
Lions 2.91 3.74 -0.80
Cheetahs -3.36 -2.17 -1.20
Pumas -4.24 -5.67 1.40
Griquas -7.85 -9.50 1.70


Performance So Far

So far there have been 10 matches played, 6 of which were correctly predicted, a success rate of 60%.
Here are the predictions for last week’s games.

Game Date Score Prediction Correct
1 Western Province vs. Griquas Jul 07 28 – 30 15.40 FALSE
2 Cheetahs vs. Pumas Jul 09 17 – 16 4.50 TRUE


Predictions for Round 6

Here are the predictions for Round 6. The prediction is my estimated expected points difference with a positive margin being a win to the home team, and a negative margin a win to the away team.

Game Date Winner Prediction
1 Lions vs. Griquas Jul 21 Lions 13.80
2 Cheetahs vs. Western Province Jul 21 Western Province -3.60
3 Sharks vs. Bulls Jul 22 Sharks 4.60


July 15, 2021

Briefly

  • From Radio NZ: an exegesis of the non-quantitative weakly graph-like thing that accompanied information about NZ vaccine rollout plans in March.  This was unusually bad for a graph from the NZ public service, but I think the story is overthinking it.
  • The FDA approval of aducanumab for Alzheimer’s disease seems may have been procedurally a bit dodgy as well as scientifically dubious. (STAT($), Washington Post)
  • photochrome.io will take a word or phrase and give you a colour palette based on photos found using the word/phrase
  • “Why are gamers so much better at catching fraud than scientists?”  (I don’t think they are; they just care about it more)
  • The US is having problems getting new electorates laid out because of the Census delays.  In NZ, one of the constraints on the Census 2018 data quality improvement process was that it absolutely positively had to be done in time for the Representation Commission to make electorates.
  • A twitter thread on finding evidence of secret US flights into Australia. Only not.
  • Why housing costs aren’t in the Consumer Price Index (but are in other indexes, which you might want to use instead)
July 13, 2021

NRL Predictions for Round 18

Team Ratings for Round 18

Please note that I have treated most games as being played on neutral grounds, the exceptions being the Titans, Cowboys and Broncos home games. The NRL has announced that all clubs will be moved to Queensland and the games will be played at the same dates and times. However many of the games have their location still listed as TBA on the NRL website. I may have to issue an update later this week if the supposition of neutral grounds turns out to not be true. The most likely game where this might be the case is the Storm versus Knights game.

The basic method is described on my Department home page.
Here are the team ratings prior to this week’s games, along with the ratings at the start of the season.

Current Rating Rating at Season Start Difference
Storm 24.02 14.53 9.50
Panthers 14.40 8.88 5.50
Eels 10.11 1.68 8.40
Rabbitohs 8.45 7.73 0.70
Sea Eagles 7.54 -4.77 12.30
Roosters 3.00 10.25 -7.20
Sharks -2.66 -0.76 -1.90
Raiders -3.51 6.98 -10.50
Warriors -4.04 -1.84 -2.20
Titans -4.18 -7.22 3.00
Dragons -4.85 -4.95 0.10
Knights -5.15 -2.61 -2.50
Wests Tigers -5.45 -3.07 -2.40
Cowboys -12.55 -8.05 -4.50
Broncos -13.48 -11.16 -2.30
Bulldogs -13.65 -7.62 -6.00


Performance So Far

So far there have been 128 matches played, 90 of which were correctly predicted, a success rate of 70.3%.
Here are the predictions for last week’s games.

Game Date Score Prediction Correct
1 Sea Eagles vs. Raiders Jul 08 16 – 30 19.70 FALSE
2 Rabbitohs vs. Cowboys Jul 09 46 – 18 23.10 TRUE
3 Bulldogs vs. Roosters Jul 10 16 – 22 -15.30 TRUE
4 Sharks vs. Warriors Jul 11 20 – 12 3.60 TRUE


Predictions for Round 18

Here are the predictions for Round 18. The prediction is my estimated expected points difference with a positive margin being a win to the home team, and a negative margin a win to the away team.

Game Date Winner Prediction
1 Titans vs. Eels Jul 16 Eels -11.30
2 Sea Eagles vs. Dragons Jul 16 Sea Eagles 15.40
3 Raiders vs. Sharks Jul 17 Raiders 2.10
4 Cowboys vs. Roosters Jul 17 Roosters -12.50
5 Storm vs. Knights Jul 17 Storm 32.20
6 Warriors vs. Panthers Jul 18 Panthers -21.40
7 Broncos vs. Wests Tigers Jul 18 Wests Tigers -5.00
8 Rabbitohs vs. Bulldogs Jul 18 Rabbitohs 25.10