Archives (240)

September 16, 2020

Briefly

  • Good piece at Stuff, from The Conversation about COVID statistics
  • “The BSA said the decision highlights the importance of data literacy, particularly in a news and current affairs context.” Broadcasting Standards Authority decision, on a complaint about Mike Hosking.
  • Two StatsChat-relevant new books: “How to Make the World Add Up” by Tim Harford, and “Calling Bullshit” by Carl Bergstrom and Jevin West
  • “Forecast models”…are typically designed with a single goal in mind: to make a specific, quantitative prediction about an event that will be observed in the future….Other infectious-disease “scenario models” are designed to explore multiple “what if” hypothetical futures”.  From the Washington Post
  • A story at the Herald, from the Daily Telegraph: low-level exposure to coronavirus through masks  could be giving people immunity. It could be, but there’s little  to no evidence that it actually is.  And we know it isn’t in New Zealand, because there’s almost no coronavirus here to have low-level exposure to, a point that might have been worth mentioning.

Covid restrictions

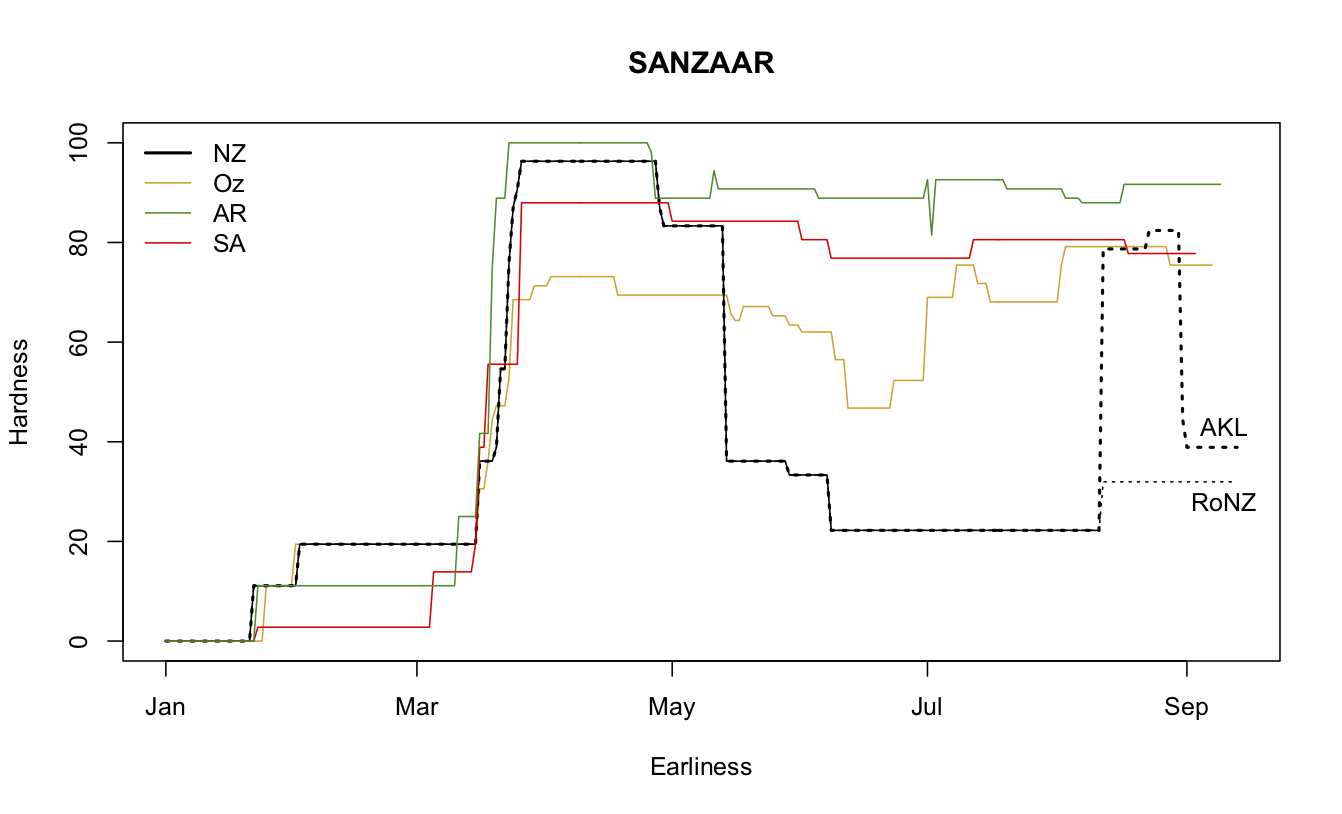
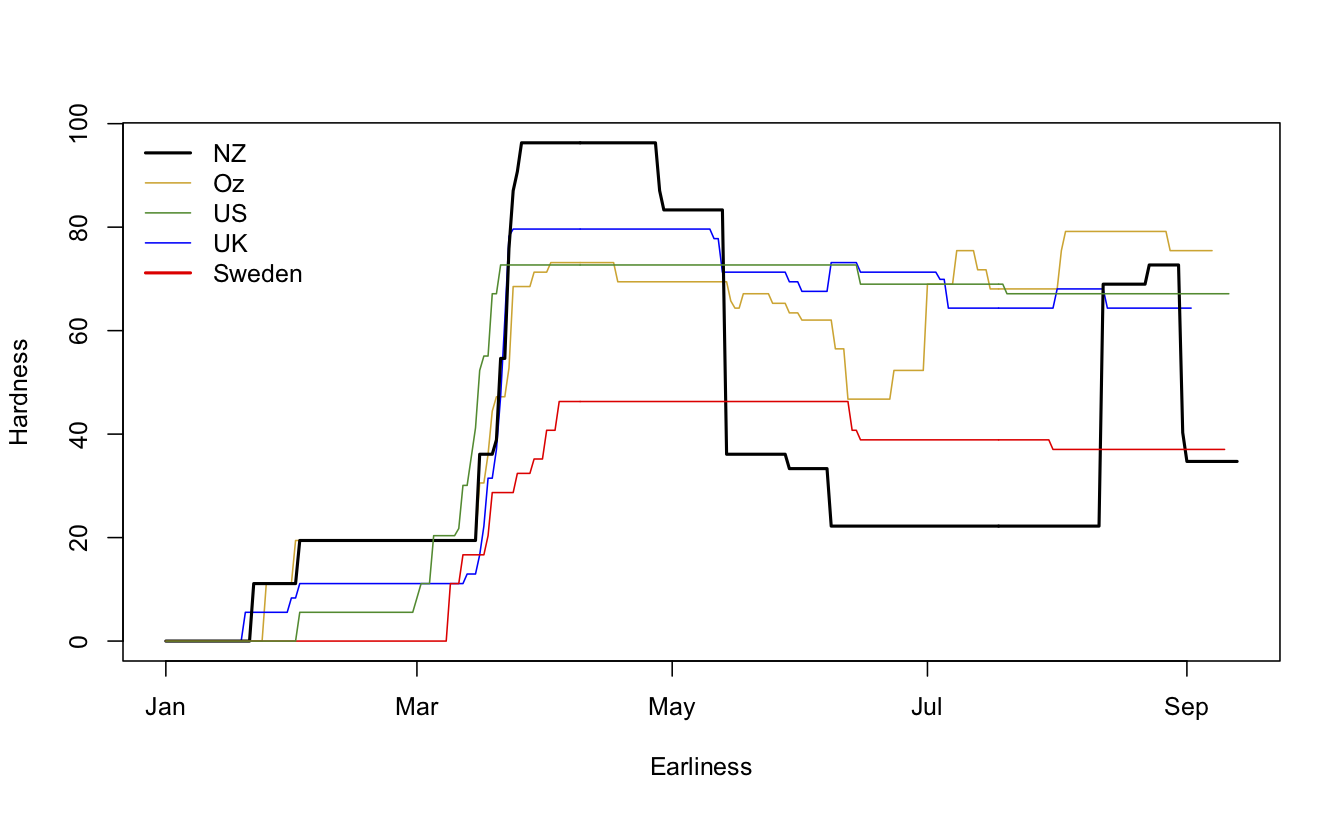
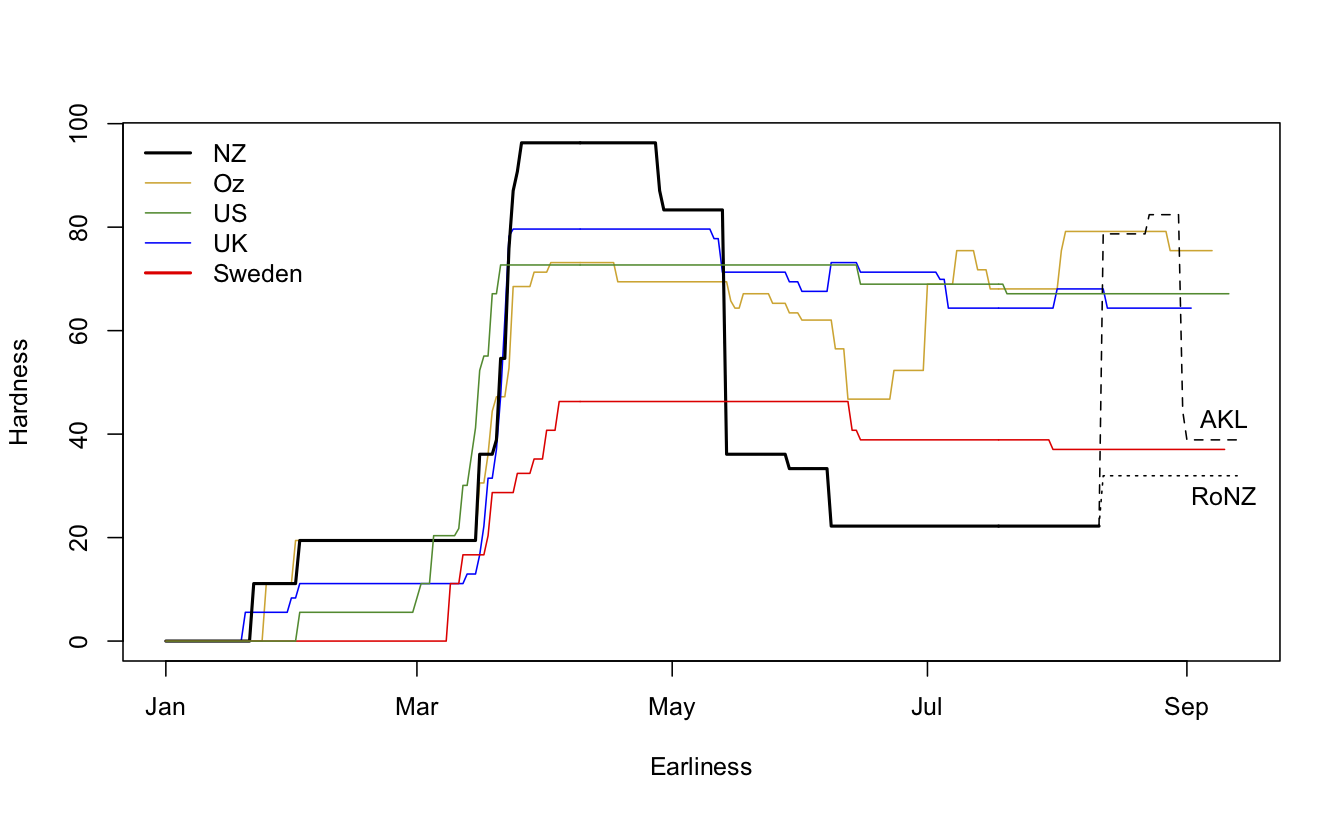
Some graphs of the stringency of NZ covid restrictions (from the Oxford Coronavirus Government Response Tracker) because it’s easy to forget what the  rest of the world is like if you don’t  talk to them regularly.

Here is  New Zealand and some countries we get compared to:

That’s not an ideal graph because it’s based on the maximum severity anywhere in the country,  with just a small offset for not being national. Here I’ve tried to work it out as  if Auckland and the Rest of NZ were separate countries. It’s still  not perfect, because other countries also have sub-national variation.

And there is the same comparison for another relevant group of countries

September 15, 2020

Bogus skincare surveys

As a bit of light relief from Covid, let’s look at this story at Stuff. It’s mostly about maternity wear (correctly disparaging the maternal-industrial complex), but there’s this

There’s having a face. Yes, you should be ashamed of your natural face. Luckily, there’s all manner of products to correct it, and makeup to cover it up. You’ll need both, to adequately conceal that shameful natural face of yours. It’ll cost the average woman about $400,000 over her lifetime.

If that were true, it would  leave avocado toast in the dust.  Where  does this figure come from?

The story doesn’t say, but there’s a similar figure that’s quite popular, eg at Buzzfeed,

A new survey from Skin Store of more than 3,000 women found that the average woman in the US spends around $300,000 on makeup in her lifetime.

The increase from $300k to $400k looks like it could easily be a currency conversion.  Buzzfeed (of course) doesn’t link to information about  the actual survey, but it is available.

The first thing to notice is

When you take into consideration how much the daily face costs of our New York women, they can spend up to $300,000 per lifetime on skincare products and cosmetics.

So the figure has been misquoted in translation, moving from New York women to US women to NZ women.  It’s probably not true even there — Skin Store don’t give any information about methodology.

We can see how badly off the number must be with a bit of simple arithmetic and a few Google queries. Skin Store says they surveyed women aged 16 to 75. There are about 100 million women aged 18 and over in the US. That’s not quite  the right age range, but it will do as an approximation.  Multiplying by US$300k per lifetime gives US$30 thousand billion.  Dividing by the 60-year ‘make-up lifetime’ gives half a trillion per year.  Total US GDP  is about $20 trillion.  The claim is that more than 2% of total US GDP goes on face-care products. For comparison, the US spends about 0.75 trillion on primary and secondary education, 1.7 trillion on all food.

The Bureau of Labor Statistics, who actually care about getting this sort of thing roughly right, estimate an average annual expenditure of less than US$800 per ‘consumer unit’ on all ‘Personal care products and services’. A ‘consumer unit’ is roughly what normal people would call a household or  family, and $800/year (which includes a lot more than just makeup, and not just women) comes to $48,000 per 60 years.  The Skin Store number looks to be off by around a factor of ten.   Just making things up would be more accurate than that.

Super Rugby Australia Predictions for The Final

Team Ratings for The Final

The basic method is described on my Department home page.
Here are the team ratings prior to this week’s games, along with the ratings at the start of the season.

Current Rating Rating at Season Start Difference
Reds 1.75 -0.31 2.10
Brumbies 1.74 4.67 -2.90
Rebels -4.03 -5.52 1.50
Waratahs -4.64 -7.12 2.50
Force -13.11 -10.00 -3.10


Performance So Far

So far there have been 21 matches played, 18 of which were correctly predicted, a success rate of 85.7%.
Here are the predictions for last week’s games.

Game Date Score Prediction Correct
1 Reds vs. Rebels Sep 12 25 – 13 9.90 TRUE


Predictions for The Final

Here are the predictions for The Final. The prediction is my estimated expected points difference with a positive margin being a win to the home team, and a negative margin a win to the away team.

Game Date Winner Prediction
1 Brumbies vs. Reds Sep 19 Brumbies 4.50


Rugby Premiership Predictions for Round 21

Team Ratings for Round 21

The basic method is described on my Department home page.
Here are the team ratings prior to this week’s games, along with the ratings at the start of the season.


Current Rating Rating at Season Start Difference
Exeter Chiefs 10.17 7.99 2.20
Saracens 8.20 9.34 -1.10
Sale Sharks 6.09 0.17 5.90
Wasps 5.79 0.31 5.50
Bath 3.29 1.10 2.20
Bristol 1.39 -2.77 4.20
Gloucester -0.50 0.58 -1.10
Harlequins -0.56 -0.81 0.20
Northampton Saints -3.12 0.25 -3.40
Leicester Tigers -6.33 -1.76 -4.60
Worcester Warriors -7.96 -2.69 -5.30
London Irish -10.23 -5.51 -4.70


Performance So Far

So far there have been 120 matches played, 79 of which were correctly predicted, a success rate of 65.8%.
Here are the predictions for last week’s games.


Game Date Score Prediction Correct
1 Wasps vs. Bristol Sep 13 59 – 35 7.10 TRUE
2 Leicester Tigers vs. Northampton Saints Sep 13 28 – 24 0.80 TRUE
3 London Irish vs. Worcester Warriors Sep 14 25 – 40 4.20 FALSE
4 Sale Sharks vs. Bath Sep 14 22 – 37 9.80 FALSE
5 Saracens vs. Exeter Chiefs Sep 14 40 – 17 0.30 TRUE
6 Gloucester vs. Harlequins Sep 15 15 – 28 6.60 FALSE


Predictions for Round 21

Here are the predictions for Round 21. The prediction is my estimated expected points difference with a positive margin being a win to the home team, and a negative margin a win to the away team.


Game Date Winner Prediction
1 Bath vs. Gloucester Sep 23 Bath 8.30
2 Bristol vs. Leicester Tigers Sep 29 Bristol 12.20
3 Exeter Chiefs vs. London Irish Sep 30 Exeter Chiefs 24.90
4 Harlequins vs. Wasps Oct 01 Wasps -1.80
5 Northampton Saints vs. Sale Sharks Oct 01 Sale Sharks -4.70
6 Worcester Warriors vs. Saracens Oct 01 Saracens -11.70


NRL Predictions for Round 19

Team Ratings for Round 19

The basic method is described on my Department home page.
Here are the team ratings prior to this week’s games, along with the ratings at the start of the season.

Current Rating Rating at Season Start Difference
Storm 14.06 12.73 1.30
Roosters 12.92 12.25 0.70
Panthers 7.15 -0.13 7.30
Raiders 6.79 7.06 -0.30
Rabbitohs 5.40 2.85 2.60
Eels 2.79 2.80 -0.00
Sharks -0.13 1.81 -1.90
Knights -1.21 -5.92 4.70
Wests Tigers -2.63 -0.18 -2.40
Warriors -2.78 -5.17 2.40
Sea Eagles -2.81 1.05 -3.90
Dragons -5.26 -6.14 0.90
Cowboys -6.66 -3.95 -2.70
Bulldogs -7.45 -2.52 -4.90
Titans -9.89 -12.99 3.10
Broncos -12.30 -5.53 -6.80


Performance So Far

So far there have been 144 matches played, 100 of which were correctly predicted, a success rate of 69.4%.
Here are the predictions for last week’s games.

Game Date Score Prediction Correct
1 Wests Tigers vs. Rabbitohs Sep 10 24 – 26 -6.70 TRUE
2 Bulldogs vs. Sea Eagles Sep 11 20 – 32 -1.50 TRUE
3 Panthers vs. Eels Sep 11 20 – 2 5.00 TRUE
4 Dragons vs. Raiders Sep 12 8 – 37 -8.10 TRUE
5 Titans vs. Broncos Sep 12 18 – 6 3.40 TRUE
6 Roosters vs. Knights Sep 12 42 – 12 14.60 TRUE
7 Storm vs. Cowboys Sep 13 36 – 20 21.40 TRUE
8 Sharks vs. Warriors Sep 13 22 – 14 6.90 TRUE


Predictions for Round 19

Here are the predictions for Round 19. The prediction is my estimated expected points difference with a positive margin being a win to the home team, and a negative margin a win to the away team.

Game Date Winner Prediction
1 Rabbitohs vs. Bulldogs Sep 17 Rabbitohs 14.90
2 Cowboys vs. Panthers Sep 18 Panthers -11.80
3 Eels vs. Broncos Sep 18 Eels 17.10
4 Sea Eagles vs. Titans Sep 19 Sea Eagles 9.10
5 Storm vs. Wests Tigers Sep 19 Storm 16.70
6 Roosters vs. Sharks Sep 19 Roosters 15.00
7 Raiders vs. Warriors Sep 20 Raiders 14.10
8 Knights vs. Dragons Sep 20 Knights 6.10


Mitre 10 Cup Predictions for Round 2

Team Ratings for Round 2

The basic method is described on my Department home page.
Here are the team ratings prior to this week’s games, along with the ratings at the start of the season.

Current Rating Rating at Season Start Difference
Tasman 14.85 15.13 -0.30
Canterbury 9.20 8.40 0.80
Auckland 8.26 6.75 1.50
Bay of Plenty 7.12 8.21 -1.10
Wellington 4.81 6.47 -1.70
Waikato 2.97 1.31 1.70
North Harbour 2.08 2.87 -0.80
Hawke’s Bay -0.26 0.91 -1.20
Taranaki -3.33 -4.42 1.10
Otago -5.53 -4.03 -1.50
Northland -7.88 -8.71 0.80
Counties Manukau -7.90 -8.18 0.30
Manawatu -11.41 -10.57 -0.80
Southland -12.87 -14.04 1.20


Performance So Far

So far there have been 7 matches played, 4 of which were correctly predicted, a success rate of 57.1%.
Here are the predictions for last week’s games.

Game Date Score Prediction Correct
1 North Harbour vs. Canterbury Sep 11 29 – 43 -2.50 TRUE
2 Waikato vs. Wellington Sep 12 53 – 28 -2.20 FALSE
3 Otago vs. Auckland Sep 12 6 – 38 -7.80 TRUE
4 Counties Manukau vs. Tasman Sep 12 24 – 41 -20.30 TRUE
5 Northland vs. Manawatu Sep 13 43 – 26 4.90 TRUE
6 Taranaki vs. Bay of Plenty Sep 13 36 – 29 -9.60 FALSE
7 Southland vs. Hawke’s Bay Sep 13 16 – 10 -11.90 FALSE


Predictions for Round 2

Here are the predictions for Round 2. The prediction is my estimated expected points difference with a positive margin being a win to the home team, and a negative margin a win to the away team.

Game Date Winner Prediction
1 Tasman vs. Northland Sep 18 Tasman 25.70
2 Waikato vs. North Harbour Sep 19 Waikato 3.90
3 Canterbury vs. Taranaki Sep 19 Canterbury 15.50
4 Bay of Plenty vs. Southland Sep 19 Bay of Plenty 23.00
5 Hawke’s Bay vs. Counties Manukau Sep 20 Hawke’s Bay 10.60
6 Manawatu vs. Otago Sep 20 Otago -2.90
7 Auckland vs. Wellington Sep 20 Auckland 6.40


September 14, 2020

Not quite alarmed

There’s a Herald story, from the NYT headlined Covid 19 coronavirus: Vaccine-makers keep safety details quiet, alarming scientists.

The headline  is a bit misleading. The lead says

Researchers say drug companies need to be more open about how vaccine trials are run to reassure people who are skittish about getting a coronavirus vaccine.

which is much more accurate. In fact, the information being sought isn’t mostly about safety but about how effectiveness will be judged

Another front-runner in the vaccine race, Pfizer, made a similarly terse announcement Saturday: The company is proposing to expand its clinical trial to include thousands more participants, but it gave few other details about its plan, including how it would determine the effectiveness of the vaccine in its larger study.

I wrote a bit about early stopping of trials last week. One of the main pieces of information being sought is just how the various trials will handle an unexpectedly good vaccine: how dramatic will the effect of the vaccine have to be to stop the trial early?  Normally, this wouldn’t be public information; there isn’t any compelling reason why it has to  be, but there isn’t any very good reason why not.  This case is different: the political situation has raised a real possibility that  the President of the USA would try to make the FDA authorise a vaccine without convincing evidence that it works. I don’t use words like ‘disaster’ lightly, but this would be a  disaster, both for COVID prevention and for the long-term credibility of vaccination.  We need a vaccine that works, and we need people to know that it works.

Fortunately, the FDA and the pharmaceutical companies are a bit more long-sighted (Pharma, considered as multinational public-stock corporations, is greedy, but they’re not stupid).  If the current administration tries to push a vaccine through without displaying good evidence, there will be resistance from scientists inside and outside the FDA. There are even encouraging signs that the drug companies wouldn’t ask for authorisation without evidence that at least looks moderately convincing from a safe distance.

Even so, it would be good to know the details in advance. We have the FDA Guidance document, which goes some way to nailing the FDA’s colours to the mast. There’s some public information about an NIH working group that seems to have made sensible design recommendations. But in this particular setting it would be helpful to release the details of how the trials will define success — measurements, diagnosis definitions, guidelines for early stopping — so that dozens of scientists with no connection to the trials could say, hand on heart, “that’s not exactly how I would have done it, but it’s 100% a reasonable way to define a successful vaccine”.


Update: in case it isn’t clear, I’m not saying it’s impossible for President Trump to push an ineffective vaccine through the FDA. I’m saying it’s impossible for him to do it without it being obvious to researchers in the US and around the world who he doesn’t control. And that if he doesn’t and the vaccine really works, it’s important for you and everyone else to know that.
Gut instinct

Winston Peters, disagreeing with the continued level 2 restrictions (via the Herald)

“Travelling around the South Island has reinforced that people are not observing social distancing in the absence of any registered or real threat of Covid-19 exposure since late April.

“Not because they are against the Government’s Covid-19 response, but because they have applied their own ‘common sense’ test to their risk of exposure to the virus.”

He’s probably right. But that’s the problem.

Our own commonsense understanding of risk is pretty good.  If you’re deciding how fast it’s safe to take a winding road in bad weather, you can do well with commonsense perceptions  (unless you’re drunk or 16, and even  then you’ll probably make it).  If you’re deciding about your personal COVID risk you don’t have as much specific experience to fall back on, but there has been advice around for months and you’ve been watching the daily case counts. So, again, probably yes. The risk is low tomorrow.

But that’s not the question.  We don’t have restrictions because the risk is high. We have them because any COVID transmission will make the risk increase, slowly at first, then faster and faster over time. Since there’s a lag of a week or two in seeing the consequences, things would look the same whether we have a  long  trail dribbling off into nothing, or  a second wave all across the country. I can’t tell the difference. You can’t tell the difference.  Even Siouxsie or Ashley can’t tell the  difference!  In one case, you all in the South Island  have another moderately restricted week; in the other,  you and we go back to lockdown at huge expense and inconvenience, and potentially a bunch of people die or become chronically ill.

Because  the risk is not an immediate and visible and individual one, but a delayed and invisible and community one, commonsense and experience just doesn’t work on its own.   I don’t know whether the decision to extend level 2 was correct or not, because I don’t have all the information and modelling. Mr Peters has seen months of the best scientific and economic advice the country has to offer. He may know. But he’s not arguing based on his special knowledge  but on general commonsense risk perception. That won’t tell you.

September 11, 2020

Rugby Premiership Predictions for Round 20

Team Ratings for Round 20

The basic method is described on my Department home page.
Here are the team ratings prior to this week’s games, along with the ratings at the start of the season.

Current Rating Rating at Season Start Difference
Exeter Chiefs 11.30 7.99 3.30
Sale Sharks 7.32 0.17 7.10
Saracens 7.06 9.34 -2.30
Wasps 4.90 0.31 4.60
Bristol 2.28 -2.77 5.10
Bath 2.06 1.10 1.00
Gloucester 0.50 0.58 -0.10
Harlequins -1.56 -0.81 -0.80
Northampton Saints -2.86 0.25 -3.10
Leicester Tigers -6.59 -1.76 -4.80
Worcester Warriors -8.94 -2.69 -6.30
London Irish -9.24 -5.51 -3.70


Performance So Far

So far there have been 114 matches played, 76 of which were correctly predicted, a success rate of 66.7%.
Here are the predictions for last week’s games.

Game Date Score Prediction Correct
1 Bristol vs. Northampton Saints Sep 09 47 – 10 6.70 TRUE
2 Wasps vs. Leicester Tigers Sep 10 54 – 7 12.80 TRUE
3 Exeter Chiefs vs. Gloucester Sep 10 35 – 22 15.70 TRUE
4 London Irish vs. Harlequins Sep 10 15 – 38 -1.00 TRUE
5 Sale Sharks vs. Saracens Sep 10 24 – 17 4.30 TRUE
6 Bath vs. Worcester Warriors Sep 10 40 – 15 14.30 TRUE


Predictions for Round 20

Here are the predictions for Round 20. The prediction is my estimated expected points difference with a positive margin being a win to the home team, and a negative margin a win to the away team.

Game Date Winner Prediction
1 Wasps vs. Bristol Sep 13 Wasps 7.10
2 Leicester Tigers vs. Northampton Saints Sep 13 Leicester Tigers 0.80
3 London Irish vs. Worcester Warriors Sep 14 London Irish 4.20
4 Sale Sharks vs. Bath Sep 14 Sale Sharks 9.80
5 Saracens vs. Exeter Chiefs Sep 14 Saracens 0.30
6 Gloucester vs. Harlequins Sep 15 Gloucester 6.60