Archives (240)

October 27, 2020

Super Rugby Unlocked Predictions for Round 4

Team Ratings for Round 4

The basic method is described on my Department home page.
Here are the team ratings prior to this week’s games, along with the ratings at the start of the season.

Current Rating Rating at Season Start Difference
Sharks 1.46 4.01 -2.50
Stormers 0.54 1.00 -0.50
Bulls -0.57 -1.45 0.90
Lions -3.76 -4.82 1.10
Cheetahs -8.43 -10.00 1.60
Pumas -10.19 -10.00 -0.20
Griquas -10.31 -10.00 -0.30


Performance So Far

So far there have been 8 matches played, 5 of which were correctly predicted, a success rate of 62.5%.
Here are the predictions for last week’s games.

Game Date Score Prediction Correct
1 Pumas vs. Stormers Oct 23 37 – 42 -6.50 TRUE
2 Bulls vs. Sharks Oct 24 41 – 14 -1.20 FALSE


Predictions for Round 4

Here are the predictions for Round 4. The prediction is my estimated expected points difference with a positive margin being a win to the home team, and a negative margin a win to the away team.

Game Date Winner Prediction
1 Lions vs. Griquas Oct 30 Lions 11.10
2 Pumas vs. Sharks Oct 31 Sharks -7.10
3 Bulls vs. Stormers Oct 31 Bulls 3.40


October 23, 2020

Compared to what?

From Radio NZ (and ODT)

Analysis by the consultancy firm Dot Loves Data shows that over a five-year period the rate of assaults in Wellington was 10 times higher than the national average.

It considered all reported crimes over a five-year period, and found in the capital there were 2056 counts of assault and 176 counts of sexual assault reported.

It’s pretty clear that Wellington is not going to have a rate of assaults 10 times higher than the national average in any very useful sense.  Unfortunately, I don’t have the report that Dot loves Data are said to have published,  and it’s not clear from the story exactly what comparisons they did, so I’ll have to do this the hard way. The advantage is that you can see what I did, and also see some of the limitations in the data.

Crime data can be found  on policedata.nz.  I looked at ‘Victimisations by Time and Place: Trends’, ie, people who reported getting crimed, regardless of whether the offender was caught and prosecuted, for the five years ending 2020-8-31 (since that’s the end of the data) and where the place of the assault was reported. Having the place reported is a surprising strong restriction: in the last 12 months about 60% of the assaults aren’t assigned to a location* for confidentiality reasons, because they occurred in dwellings. The lack of location data is actually a problem when the point of the story is to compare locations, but let’s pass over it for now and just note that we’re comparing assaults occurring in public rather than all assaults.

For the category  “Acts intended to cause injury”  there were 91472 in New Zealand, 4337 in Wellington City, and 10303 in Wellington Region.   The 91472 acts intended to cause injury that happened in public were about 50,000 ‘common assault’, 17,000 ‘serious assault resulting in injury’ and 23,000 ‘serious assault not resulting in injury’. These aren’t the names of NZ crimes, because (a) they are standardised official-statistics categories and (b) if no-one is arrested or prosecuted it’s a bit hard to be precise about what crime a court would find had occurred. The ‘intended to cause injury’ categories don’t include sexual assault, which is in a separate group and is left as an exercise for the reader.  My figures for assault  don’t accurately match the reported ones, but they probably aren’t exactly the same time frame and might be different in other ways.

The population of New Zealand is about 4.9 million,  of the Wellington Region is about 500,000, and of Wellington City is about 200,000.  Wellington City has about a 9% higher rate per capita of assault victimisation than the country as a whole. Not ten times, 1.09 times. Wellington Region is about 4% higher than the  country as a whole.

Now, since the story was focused on Courtenay Place and Cuba St, maybe the ‘ten times’ claim was supposed to apply there, rather than to ‘the capital’ as a whole and we should narrow down the geographic focus. The Census Area Unit covering Courtenay Place and Cuba St is “573101 Willis St – Cambridge Terrace”

In that area, there were 1858 ‘acts intended to cause injury’ over five years that happened in public, in an area with a population of 9230. On a per capita population basis that’s  10.8 times the rate for NZ as a whole, suggesting something like this is the analysis being reported.

But why are we dividing by the resident population of Te Aro? Most of the people out partying there don’t live there — they live all over the city and the Wellington region — but they, not the residents, are the relevant denominator. In fact, a lot of assaults of residents will not be in the statistics, because they will happen in someone’s home. At the other extreme, you could leave out population entirely and compare the 1858 assaults in the area unit to the average of 45 for census area units all over NZ — a factor of 40.   That also doesn’t answer any really useful question.

There seem to be two implied statistical questions that are more relevant to the news stories:

  1. Is going out to Te Aro substantially more dangerous than going to bars and nightclubs elsewhere in the country, on an individual party-goer basis?
  2. Would cracking down on the Courtenay Place/Cuba precinct reduce assaults?

Neither question can be answered with administrative data.  For the first question you’d need data on number of visitors to  the area on, say, Friday and Saturday nights and to other areas in the Wellington region and around the country.  For Wellington City it might be feasible to estimate this from parking, rideshare,  and public transport usage, or from cellphone densities, but it would be harder to get data for smaller centres.

The second question depends on the alternative. It’s pretty clear that if we banned going out  to bars and nightclubs the reported assault rate would fall  — we tried that, in April/May, and had about 25% fewer cases nationwide than in 2019 or 2018, and about 50% in the Courtenay Place/Cuba area. It’s also pretty clear we’re not actually going to tackle assaults with nationwide lockdowns.

If we just cracked down on unlawful behaviour in that area, or reduced the number of places selling alcohol, it’s not clear what would happen. It might be that people drink less and fight less. It might be that they just move the party to some other central area. It might be that they spread out across the city. Or, people might get drunk and fight in the comfort and safety of their own homes and streets — we know that assault and sexual assault in the home are badly under-reported (under-reported to police as well as not being in the public data set).

The right comparison will depend on what individual risk or potential policy change you are trying to evaluate, but it’s not likely to be this one.


* I emailed the NZ Police data address to ask about where the missing assaults were; my request is being actioned pursuant to the Official Information Act**

** Yes, I realise that just answering would count as actioning it pursuant to the Official Information Act, but the email still doesn’t make me expect*** a rapid reply

*** And I need to confess to having completely misjudged the police data people, who got back to me the next morning and were extremely helpful

October 22, 2020

Briefly

October 20, 2020

Super Rugby Unlocked Predictions for Round 3

Team Ratings for Round 3

The basic method is described on my Department home page.
Here are the team ratings prior to this week’s games, along with the ratings at the start of the season.

Current Rating Rating at Season Start Difference
Sharks 3.27 4.01 -0.70
Stormers 0.68 1.00 -0.30
Bulls -2.38 -1.45 -0.90
Lions -3.76 -4.82 1.10
Cheetahs -8.43 -10.00 1.60
Griquas -10.31 -10.00 -0.30
Pumas -10.33 -10.00 -0.30


Performance So Far

So far there have been 6 matches played, 4 of which were correctly predicted, a success rate of 66.7%.
Here are the predictions for last week’s games.

Game Date Score Prediction Correct
1 Cheetahs vs. Bulls Oct 10 19 – 17 -2.30 FALSE
2 Griquas vs. Pumas Oct 11 21 – 27 6.20 FALSE
3 Stormers vs. Lions Oct 11 23 – 17 9.60 TRUE


Predictions for Round 3

Here are the predictions for Round 3. The prediction is my estimated expected points difference with a positive margin being a win to the home team, and a negative margin a win to the away team.

Game Date Winner Prediction
1 Pumas vs. Stormers Oct 23 Stormers -6.50
2 Lions vs. Cheetahs Oct 24 Lions 9.20
3 Bulls vs. Sharks Oct 24 Sharks -1.20


Super Rugby Unlocked Predictions for Round 2

Team Ratings for Round 2

The basic method is described on my Department home page.
Here are the team ratings prior to this week’s games, along with the ratings at the start of the season.

Current Rating Rating at Season Start Difference
Sharks 3.27 4.01 -0.70
Stormers 1.00 1.00 0.00
Bulls -1.99 -1.45 -0.50
Lions -4.08 -4.82 0.70
Cheetahs -8.82 -10.00 1.20
Griquas -9.46 -10.00 0.50
Pumas -11.18 -10.00 -1.20


Performance So Far

So far there have been 3 matches played, 3 of which were correctly predicted, a success rate of 100%.
Here are the predictions for last week’s games.

Game Date Score Prediction Correct
1 Sharks vs. Lions Oct 17 19 – 16 13.30 TRUE
2 Cheetahs vs. Pumas Oct 18 53 – 31 4.50 TRUE
3 Bulls vs. Griquas Oct 18 30 – 23 13.10 TRUE


Predictions for Round 2

Here are the predictions for Round 2. The prediction is my estimated expected points difference with a positive margin being a win to the home team, and a negative margin a win to the away team.

Game Date Winner Prediction
1 Cheetahs vs. Bulls Oct 10 Bulls -2.30
2 Griquas vs. Pumas Oct 11 Griquas 6.20
3 Stormers vs. Lions Oct 11 Stormers 9.60


Super Rugby Unlocked Predictions for Round 1

Team Ratings for Round 1

Another competition where I missed the start. I am surprised my South African readers didn’t alert me, or perhaps it crept up on them. I had been checking on whether the Currie Cup would be running but hadn’t got wind of this competition.

As before when I have missed the start, for completeness I will post my predictions for the games missed.

Note that there are difficulties with this competition due to the presence of three teams without recent Super Rugby results. I have followed my usual practice of assigning a rating of -10 in such cases. (As was done with the Force in Super Rugby Australia for example.)

The basic method is described on my Department home page.
Here are the team ratings prior to this week’s games, along with the ratings at the start of the season.

Current Rating Rating at Season Start Difference
Sharks 4.01 4.01 0.00
Stormers 1.00 1.00 0.00
Bulls -1.45 -1.45 0.00
Lions -4.82 -4.82 0.00
Cheetahs -10.00 -10.00 0.00
Griquas -10.00 -10.00 0.00
Pumas -10.00 -10.00 0.00


Predictions for Round 1

Here are the predictions for Round 1. The prediction is my estimated expected points difference with a positive margin being a win to the home team, and a negative margin a win to the away team.

Game Date Winner Prediction
1 Sharks vs. Lions Oct 17 Sharks 13.30
2 Cheetahs vs. Pumas Oct 18 Cheetahs 4.50
3 Bulls vs. Griquas Oct 18 Bulls 13.10


NRL Predictions for the Grand Final

Team Ratings for the Grand Final

The basic method is described on my Department home page.
Here are the team ratings prior to this week’s games, along with the ratings at the start of the season.

Current Rating Rating at Season Start Difference
Storm 14.32 12.73 1.60
Roosters 10.25 12.25 -2.00
Panthers 9.10 -0.13 9.20
Rabbitohs 7.73 2.85 4.90
Raiders 6.98 7.06 -0.10
Eels 1.68 2.80 -1.10
Sharks -0.76 1.81 -2.60
Warriors -1.84 -5.17 3.30
Knights -2.61 -5.92 3.30
Wests Tigers -3.07 -0.18 -2.90
Sea Eagles -4.77 1.05 -5.80
Dragons -4.95 -6.14 1.20
Titans -7.22 -12.99 5.80
Bulldogs -7.62 -2.52 -5.10
Cowboys -8.05 -3.95 -4.10
Broncos -11.16 -5.53 -5.60


Performance So Far

So far there have been 168 matches played, 116 of which were correctly predicted, a success rate of 69%.
Here are the predictions for last week’s games.

Game Date Score Prediction Correct
1 Storm vs. Raiders Oct 16 30 – 10 5.90 TRUE
2 Panthers vs. Rabbitohs Oct 17 20 – 16 3.20 TRUE


Predictions for the Grand Final

Here are the predictions for the Grand Final. The prediction is my estimated expected points difference with a positive margin being a win to the home team, and a negative margin a win to the away team.

Game Date Winner Prediction
1 Panthers vs. Storm Oct 25 Storm -3.20


Mitre 10 Cup Predictions for Round 7

Team Ratings for Round 7

The basic method is described on my Department home page.
Here are the team ratings prior to this week’s games, along with the ratings at the start of the season.

Current Rating Rating at Season Start Difference
Tasman 13.29 15.13 -1.80
Auckland 9.08 6.75 2.30
Canterbury 7.68 8.40 -0.70
Wellington 6.22 6.47 -0.20
Waikato 4.31 1.31 3.00
North Harbour 3.87 2.87 1.00
Bay of Plenty 3.76 8.21 -4.40
Hawke’s Bay 0.17 0.91 -0.70
Taranaki -3.15 -4.42 1.30
Otago -3.26 -4.03 0.80
Northland -7.50 -8.71 1.20
Southland -10.24 -14.04 3.80
Counties Manukau -10.36 -8.18 -2.20
Manawatu -13.77 -10.57 -3.20


Performance So Far

So far there have been 42 matches played, 28 of which were correctly predicted, a success rate of 66.7%.
Here are the predictions for last week’s games.

Game Date Score Prediction Correct
1 Hawke’s Bay vs. Northland Oct 16 33 – 17 9.70 TRUE
2 Manawatu vs. Bay of Plenty Oct 17 35 – 53 -13.90 TRUE
3 Auckland vs. Tasman Oct 17 31 – 10 -4.30 FALSE
4 Southland vs. Taranaki Oct 17 9 – 17 -3.40 TRUE
5 Canterbury vs. Waikato Oct 18 15 – 16 7.60 FALSE
6 Otago vs. Counties Manukau Oct 18 40 – 22 8.80 TRUE
7 Wellington vs. North Harbour Oct 18 25 – 20 5.40 TRUE


Predictions for Round 7

Here are the predictions for Round 7. The prediction is my estimated expected points difference with a positive margin being a win to the home team, and a negative margin a win to the away team.

Game Date Winner Prediction
1 Otago vs. Northland Oct 23 Otago 7.20
2 Bay of Plenty vs. Canterbury Oct 24 Canterbury -0.90
3 Hawke’s Bay vs. Manawatu Oct 24 Hawke’s Bay 16.90
4 North Harbour vs. Auckland Oct 24 Auckland -2.20
5 Counties Manukau vs. Wellington Oct 25 Wellington -13.60
6 Tasman vs. Southland Oct 25 Tasman 26.50
7 Waikato vs. Taranaki Oct 25 Waikato 10.50


October 19, 2020

How did the polls do?

There were two (or possibly three) features of the preliminary election results on Saturday being discussed as surprising: the large Labour margin, the win in Auckland Central by Chlöe Swarbrick of the Green Party, and possibly the win in Waiariki by Rawiri Waititi of the Māori Party.  How do these really compare to pre-election polling? I’m going to use Peter Ellis’s poll aggregator, to save having to think about it myself. It’s an obviously sensible approach and has done well in the past.

To start with, I do want to point out that the polls got the broad message correct,  in a way that you would probably not be able to do just by listening to the news and doomscrolling on social media.  The polls said that Labour would do much better than in 2017, and that ACT would do much better than in 2017 and that National would do much worse, and that the miscellaneous new parties would go the way of most miscellaneous new parties.  It’s the details that were off.

In the aggregated polls, Labour were expected to get 59 seats, plus or minus about 3, and National about 42 with similar uncertainties.  In reality, Labour are at 64 and National at 35, way out in the tail of the predictions.  Even taking the uncertainty in the model into account, Labour did surprisingly well.   The predictions for  ACT and NZ First, on the other hand, were spot-on, and for the Greens were well within the predicted range.

In Auckland Central I know of two electorate polls, which had  Chlöe Swarbrick at 24% and 26% — the latter taken 24-30 September, very close to the start of voting.  In reality, she got 34.1% and, if history can be trusted, is likely to move up slightly on special votes.  This wasn’t a straightforward swing away from National; the Labour candidate also did better in polls than in the election. It will be interesting to see if much of Swarbrick’s performance can be explained by improved turnout when we have the final numbers.

Single-electorate polling is always hard, and it’s likely to be even harder for an electorate with a young population that includes many students, and for a three-way race. Hard-to-predict electorates, though, are the only ones where polling is interesting.  Given that two polls were both off by 10+% for the winning candidate, single-electorate polling may just not be worth the effort.

By contrast, I don’t think the Waiariki result should really be surprising — the polling was indicating a good chance of one or two electorates for the Māori Party, and I’m told that people in Māori media had discussed it as plausible.

So why were the polls off nationally? It doesn’t help that the number of polling companies has fallen, but that would be incorporated in the model uncertainty, so it doesn’t explain everything.  Some of it is probably just 2020. Because opinion polls get a low response rate — and worse, a response rate that’s lower for some groups of people than others — pollers have to have ways to correct for the bias.  On top of that, they need ways to estimate who will actually vote in the election.  Given the huge change in people’s working patterns this year, and especially during August and September in Auckland, it would not be even slightly surprising if the relationship between political views and responding to an opinion poll had changed.

In the future, as things settle down, polling companies will be able to adapt to the new normal and get more accurate results (or at least better estimates of error). For now, though, polls may be working less well than they have in the past.

October 18, 2020

‘Close’ counts in horseshoes and clinical trials

Elections are designed  to  produce a  result: someone wins. The losing side doesn’t get to enact a fair share of their program just for getting close.

Clinical trials aren’t like that.  They do feed into regulatory decisions, which may be  yes/no in a similar way, but when we talk about what was learned in a trial it isn’t just binary, or shouldn’t be.  Unfortunately, there’s a tendency for “the trial did not provide convincing evidence of mortality  reductions” to get simplified to “the trial did not provide any evidence of  mortality reductions”  and then to  “the treatment  does not reduce mortality”.

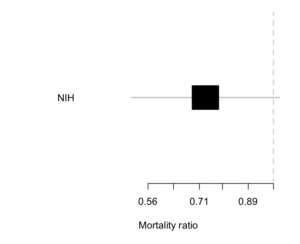
The NIH trial of remdesivir for Covid was a typical example. Here’s the result.

The estimated reduction is about 25% — not a cure, but quite worthwhile if true.  There’s a lot of uncertainty: the trial data are consistent with there being no benefit (a ratio of 1; the vertical line) and equally consistent with a 50% mortality reduction.  The results still got described as “remdesivir does not reduce mortality”.

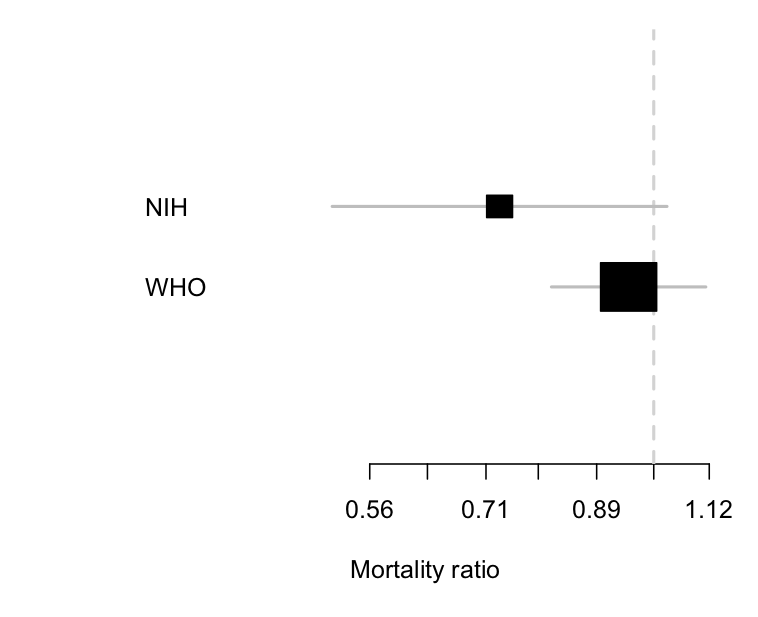
This matters, because we need to distinguish an inconclusive but moderately favourable result from the other sort of negative trial. This week we got results from the larger  SOLIDARITY trial, coordinated by  the WHO.  Here’s a comparison of the two

The two trials are clearly consistent with each other, but the uncertainty around the results is a lot smaller with the WHO  trial.  Importantly,  the estimated  benefit in the WHO trial is a much less impressive 5% reduction, and the lower limit is about 20%.  The WHO trial can reasonably be summarised as  saying ‘there is no substantial reduction in mortality with remdesivir’, and it wouldn’t be too much of a stretch to say ‘remdesivir doesn’t reduce mortality’  (in patients similar to these ones).

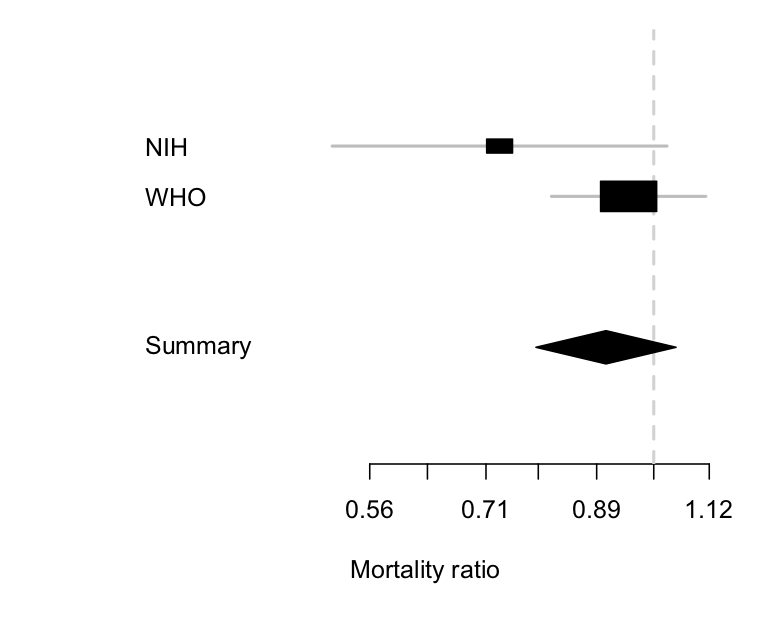
We can combine the two sets of information:

The  diamond is the uncertainty interval for the combination of the two trials (it’s a different shape so you  don’t think it’s a third trial).  It mostly follows the larger WHO trial, where most of the information is, but it’s shifted a little to the left because of the more positive information from the NIH trial.  The takeaway point is the same as from just the WHO trial, though: remdesivir doesn’t reduce mortality much, if at all.