Archives (240)

June 16, 2020

Super Rugby Aotearoa Predictions for Round 2

Team Ratings for Round 2

The basic method is described on my Department home page.
Here are the team ratings prior to this week’s games, along with the ratings at the start of the season.

Current Rating Rating at Season Start Difference
Crusaders 15.15 15.15 0.00
Hurricanes 7.55 8.31 -0.80
Chiefs 7.52 7.94 -0.40
Blues 6.15 5.39 0.80
Highlanders 0.20 -0.22 0.40


Performance So Far

So far there have been 2 matches played, 1 of which were correctly predicted, a success rate of 50%.
Here are the predictions for last week’s games.

Game Date Score Prediction Correct
1 Highlanders vs. Chiefs Jun 13 28 – 27 -3.70 FALSE
2 Blues vs. Hurricanes Jun 14 30 – 20 1.60 TRUE


Predictions for Round 2

Here are the predictions for Round 2. The prediction is my estimated expected points difference with a positive margin being a win to the home team, and a negative margin a win to the away team.

Game Date Winner Prediction
1 Chiefs vs. Blues Jun 20 Chiefs 5.90
2 Hurricanes vs. Crusaders Jun 21 Crusaders -3.10


NRL Predictions for Round 6

Team Ratings for Round 6

The basic method is described on my Department home page.
Here are the team ratings prior to this week’s games, along with the ratings at the start of the season.

Current Rating Rating at Season Start Difference
Roosters 13.85 12.25 1.60
Storm 11.90 12.73 -0.80
Raiders 7.20 7.06 0.10
Eels 4.74 2.80 1.90
Sea Eagles 1.99 1.05 0.90
Rabbitohs 1.92 2.85 -0.90
Panthers 1.01 -0.13 1.10
Sharks 0.76 1.81 -1.00
Wests Tigers -1.22 -0.18 -1.00
Knights -2.64 -5.92 3.30
Bulldogs -4.09 -2.52 -1.60
Cowboys -4.18 -3.95 -0.20
Warriors -5.40 -5.17 -0.20
Broncos -6.57 -5.53 -1.00
Dragons -7.16 -6.14 -1.00
Titans -14.08 -12.99 -1.10


Performance So Far

So far there have been 40 matches played, 26 of which were correctly predicted, a success rate of 65%.
Here are the predictions for last week’s games.

Game Date Score Prediction Correct
1 Sea Eagles vs. Broncos Jun 11 20 – 18 11.70 TRUE
2 Warriors vs. Cowboys Jun 12 37 – 26 -2.60 FALSE
3 Eels vs. Panthers Jun 12 16 – 10 5.70 TRUE
4 Rabbitohs vs. Titans Jun 13 32 – 12 17.60 TRUE
5 Knights vs. Storm Jun 13 12 – 26 -12.20 TRUE
6 Wests Tigers vs. Raiders Jun 13 6 – 14 -6.00 TRUE
7 Bulldogs vs. Roosters Jun 14 6 – 42 -16.00 TRUE
8 Dragons vs. Sharks Jun 14 30 – 16 -10.10 FALSE


Predictions for Round 6

Here are the predictions for Round 6. The prediction is my estimated expected points difference with a positive margin being a win to the home team, and a negative margin a win to the away team.

Game Date Winner Prediction
1 Knights vs. Broncos Jun 18 Knights 5.90
2 Rabbitohs vs. Warriors Jun 19 Rabbitohs 11.80
3 Panthers vs. Storm Jun 19 Storm -8.90
4 Titans vs. Dragons Jun 20 Dragons -4.90
5 Wests Tigers vs. Cowboys Jun 20 Wests Tigers 5.00
6 Eels vs. Roosters Jun 20 Roosters -7.10
7 Raiders vs. Sea Eagles Jun 21 Raiders 5.20
8 Sharks vs. Bulldogs Jun 21 Sharks 4.90


Testing for COVID after the protests

I was referred on Twitter to this story from Twin Cities Pioneer Press, about COVID testing of people participating in the Minneapolis protests over the killing of George Floyd.

The headline is Early test results show few protesters caught COVID-19.  I think that’s a bit premature, though the story itself is fine and it makes sense to share whatever information there is about.

More than 3,300 people who participated in protests and community events after Floyd’s death were tested for the coronavirus …

Results from about 40 percent of the coronavirus tests done in St. Paul and Minneapolis this week show 1.4 percent of participants who were tested had contracted COVID-19. Health officials are awaiting the rest of the test results and are encouraging anyone who participated in mass gatherings to get tested — regardless of symptoms.

As a first reaction, it’s really good news that the health officials are trying to get everyone tested,  to mitigate any effects of the protest.  Because this is the internet, I probably also need to say that, yes, the protesters are imposing a infection risk on people who didn’t volunteer for it, but being killed by police is also a risk substantially imposed on people who don’t do anything to volunteer for it. And I should probably also say that this viewpoint may not be the policy of the University of Auckland (but it should be).

Getting back to the actual numbers, 1.4% seems quite a lot.  The story compares it to the 3.7% positive rate in current testing, but correctly points out that the usual testing is of people who are much more likely than average to have the virus.  Another possible comparison is that about 30,000 of Minnesota’s 5.6 million population have tested positive so far, or about 0.5%.   It’s easy to imagine that Minnesota has missed 2/3 of its cases (I could believe that NZ has missed 2/3 of its cases), so 1.4% isn’t looking so bad. On the other hand, that proportion in Minnesota as a whole is over the entire duration of the epidemic, not at one point in time.  And the 1.4% will, to some extent, be an underestimate of infections in those tested, since the accuracy of the test before you develop symptoms is not wonderful.  So, yes, 1.4% looks like some infections due to the protests.

Minnesota currently has about 4000 active COVID cases.  If (extrapolating wildly from the tests) there are 100 or so from the protests, and most of these people get diagnosed and are willing and able to isolate while infectious, the impact doesn’t really qualify as a ‘spike’.  If there hadn’t been proactive testing, most of these people would have had no reason to suspect they were carriers and a serious increase in cases would be more likely.

June 9, 2020

Super Rugby Aotearoa Predictions for Round 1

Team Ratings for Round 1

The basic method is described on my Department home page.
Here are the team ratings prior to this week’s games, along with the ratings at the start of the season.

Current Rating Rating at Season Start Difference
Crusaders 15.15 15.15 0.00
Hurricanes 8.31 8.31 0.00
Chiefs 7.94 7.94 0.00
Blues 5.39 5.39 0.00
Highlanders -0.22 -0.22 0.00


Predictions for Round 1

Here are the predictions for Round 1. The prediction is my estimated expected points difference with a positive margin being a win to the home team, and a negative margin a win to the away team.

Game Date Winner Prediction
1 Highlanders vs. Chiefs Jun 13 Chiefs -3.70
2 Blues vs. Hurricanes Jun 14 Blues 1.60


NRL Predictions for Round 5

Team Ratings for Round 5

The basic method is described on my Department home page.
Here are the team ratings prior to this week’s games, along with the ratings at the start of the season.

Current Rating Rating at Season Start Difference
Roosters 12.90 12.25 0.70
Storm 11.72 12.73 -1.00
Raiders 7.00 7.06 -0.10
Eels 4.70 2.80 1.90
Sea Eagles 2.53 1.05 1.50
Sharks 1.85 1.81 0.00
Rabbitohs 1.73 2.85 -1.10
Panthers 1.05 -0.13 1.20
Wests Tigers -1.02 -0.18 -0.80
Knights -2.46 -5.92 3.50
Bulldogs -3.15 -2.52 -0.60
Cowboys -3.47 -3.95 0.50
Warriors -6.11 -5.17 -0.90
Broncos -7.12 -5.53 -1.60
Dragons -8.25 -6.14 -2.10
Titans -13.89 -12.99 -0.90


Performance So Far

So far there have been 32 matches played, 20 of which were correctly predicted, a success rate of 62.5%.
Here are the predictions for last week’s games.

Game Date Score Prediction Correct
1 Broncos vs. Roosters Jun 04 0 – 59 -14.60 TRUE
2 Panthers vs. Warriors Jun 05 26 – 0 10.10 TRUE
3 Storm vs. Rabbitohs Jun 05 22 – 8 11.60 TRUE
4 Eels vs. Sea Eagles Jun 06 19 – 16 4.50 TRUE
5 Cowboys vs. Sharks Jun 06 16 – 26 -2.40 TRUE
6 Raiders vs. Knights Jun 07 18 – 34 11.90 FALSE
7 Titans vs. Wests Tigers Jun 07 28 – 23 -12.60 FALSE
8 Bulldogs vs. Dragons Jun 08 22 – 2 3.50 TRUE


Predictions for Round 5

Here are the predictions for Round 5. The prediction is my estimated expected points difference with a positive margin being a win to the home team, and a negative margin a win to the away team.

Game Date Winner Prediction
1 Sea Eagles vs. Broncos Jun 11 Sea Eagles 11.70
2 Warriors vs. Cowboys Jun 12 Cowboys -2.60
3 Eels vs. Panthers Jun 12 Eels 5.70
4 Rabbitohs vs. Titans Jun 13 Rabbitohs 17.60
5 Knights vs. Storm Jun 13 Storm -12.20
6 Wests Tigers vs. Raiders Jun 13 Raiders -6.00
7 Bulldogs vs. Roosters Jun 14 Roosters -16.00
8 Dragons vs. Sharks Jun 14 Sharks -10.10


June 6, 2020

Looking clueless

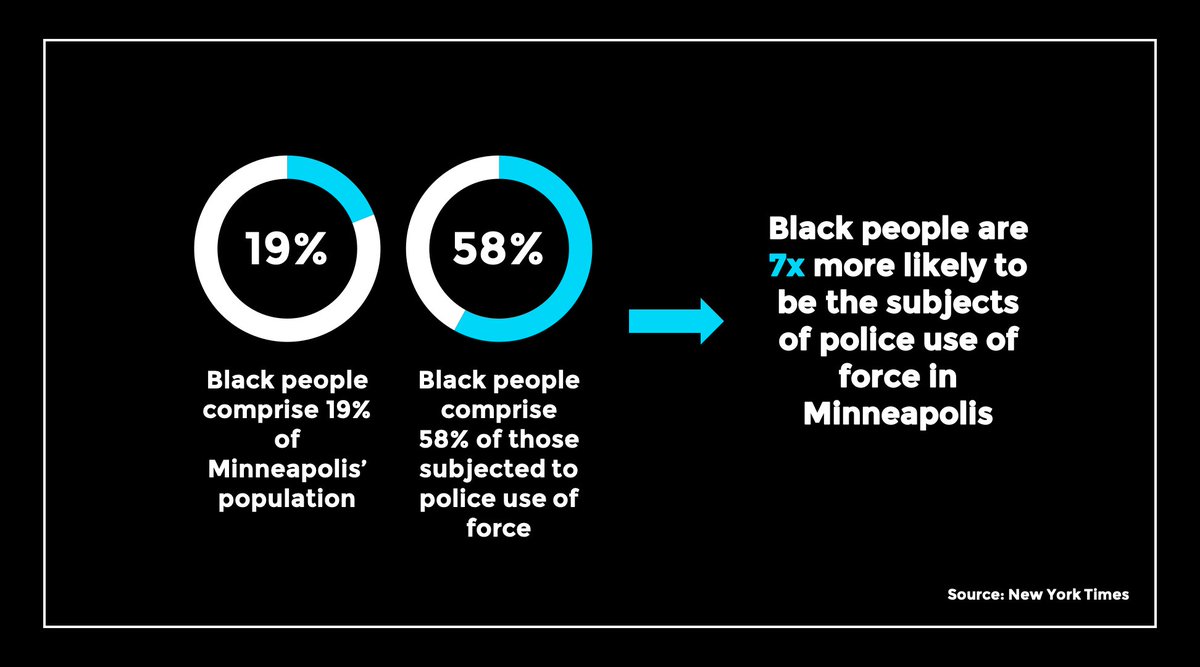
I saw this ‘infographic’ on the Twitter feed of a civil rights lawyer in the US

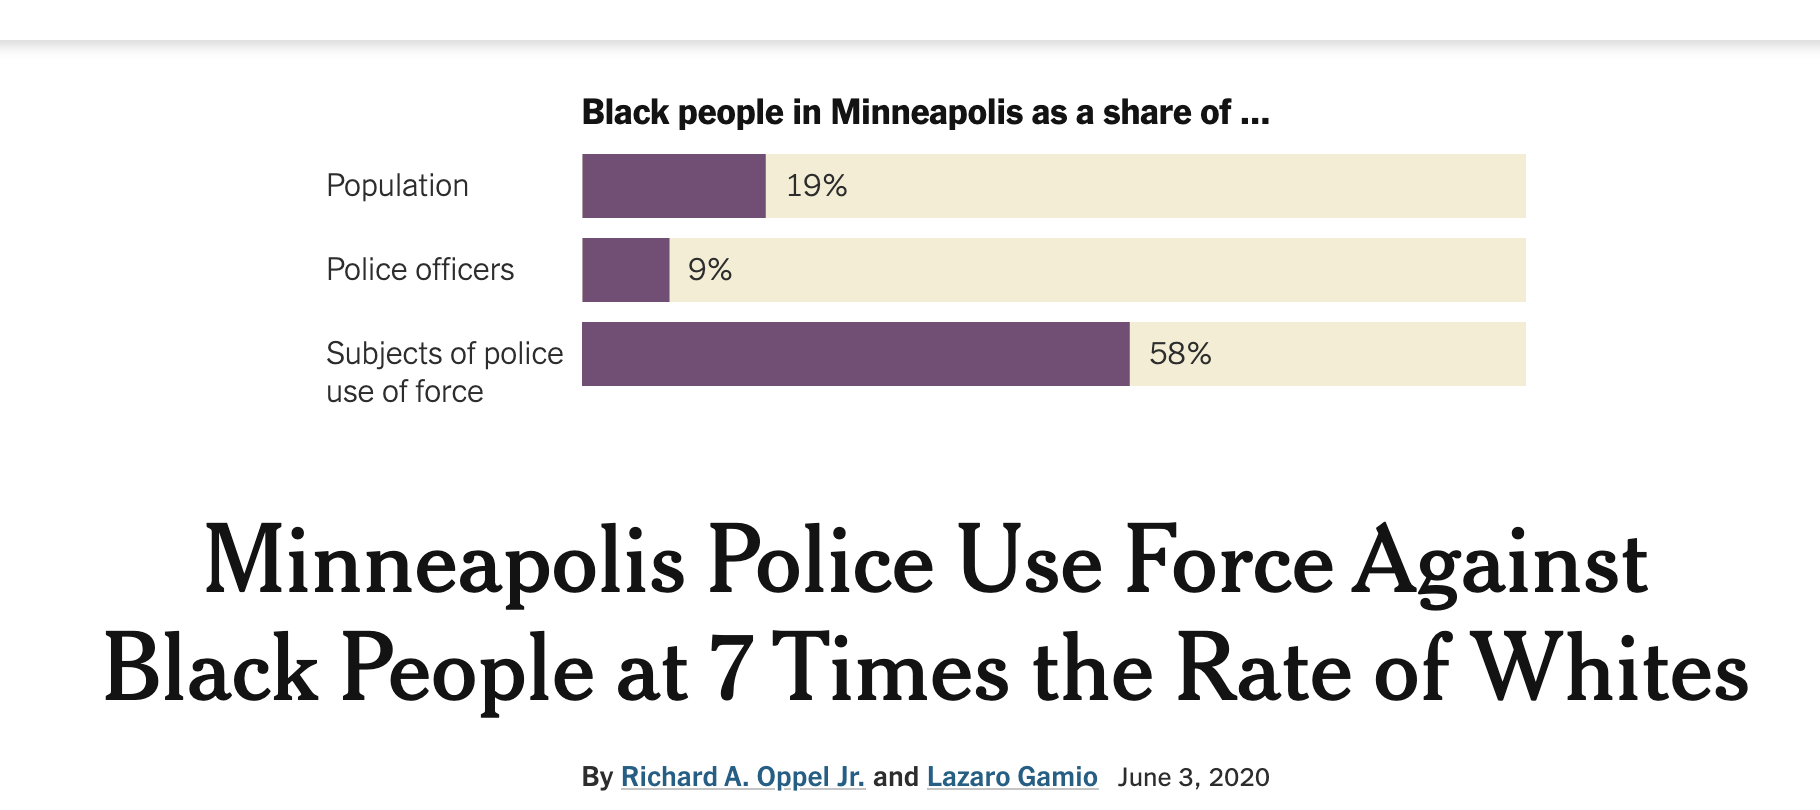
The implication is so obviously wrong that you’d wonder how someone would fail to notice: 58% is about three times 19%, not seven times.  I wondered if this was a confusion of rate ratios and odds ratios, but that didn’t explain it either. So I went to the New York Times story, and saw this at the top of the page

Same numbers in the graph: a three-fold difference. Almost the same claim in the text —  a seven-fold difference — but now with a reference group.

If you read carefully, they are both right.  The graph (and all the graphs in the story) compare Blacks (20% of the populaton) to non-Blacks (80%).  The headline compares Black and white (60%), and the relative rate there is a bit above seven.  To find the numbers for this comparison, you just need to read the sections highlighted in red here

That’s three separate paragraphs, with a map in the middle.

Both the graph and the headline are very suited to social media (‘clickbait’ is a bit strong, since it’s actually good data). They will be circulated by lots of progressive US people who, like the lawyer whose tweet I first noticed, will look numerically clueless.   That can’t be good for the Times.

June 5, 2020

And again

The Surgisphere papers on COVID (the chloroquine one I mentioned yesterday, and one on the safety of blood pressure drugs that affect the angiotensin system) have been retracted, at the request of three of the four authors. They had organised an independent review of the data, but:

Our independent peer reviewers informed us that Surgisphere would not transfer the full dataset, client contracts, and the full ISO audit report to their servers for analysis as such transfer would violate client agreements and confidentiality requirements. As such, our reviewers were not able to conduct an independent and private peer review and therefore notified us of their withdrawal from the peer-review process

With the combination of widespread concern about the data veracity and the unequivocal evidence from the Guardian that the Australian data were misrepresented or falsified, they didn’t have much choice.   The charitable (and quite plausible) assumption is that those three authors were dupes: someone offered them the ability to do (or at least publish) valuable analyses of COVID treatment options, and they didn’t check up on the provenance.

Ben Goldacre says this incident shows the importance of publishing code. I’m not convinced.  If I were faking a 90,000 person data set and sophisticated data analyses, I’d actually do the work of faking the data, not just the results.  Then I could publish the code perfectly safely, claim the data were confidential, but still be tripped up by someone willing to call up all the major hospitals in Australia and check whether they were involved.

June 4, 2020

Chloroquine, yet again

Two and a half important things today.

First, a reasonably-sized, well-conducted trial of chloroquine after exposure to prevent disease found no real evidence of benefit (NYTimes) The  original research paper is supposed to be here, but isn’t up yet.

Second, Melissa Davey, Stephanie Kirchgaessner, and Sarah Boseley, in the Guardian have followed up on the concerns about that large multinational observational study.   If you missed it so far, the paper claimed to have data on over 90,000 hospitalised patients in six continents, and found patients getting chloroquine had substantially mortality. The data were supposed to have been collected from the hospitals electronically, more or less in real time, and sent to a server in the USA, but data use agreements supposedly meant that the hospitals (or even the countries they were in) couldn’t be identified — only the continents.  The Guardian journalists had the same idea as I had, that the Australian data (5 hospitals, 63 patients) was the weak point for checking: Australia is a small continent, with a small COVID outbreak, and a highly concentrated population, so you’d only have to call a fairly small number of hospitals and get them to deny sending their data to Surgisphere.  Unlike me, they actually did it:

The Guardian has since contacted five hospitals in Melbourne and two in Sydney, whose cooperation would have been essential for the Australian patient numbers in the database to be reached. All denied any role in such a database, and said they had never heard of Surgisphere. Desai did not respond to requests to comment on their statements.

So, the Australian data, after being obviously impossible and being corrected, are impossible again.  Australian patients make up only a tiny fraction of the claimed database — less than one in one thousand — but as Mies van der Rohe said, “God is in the details”

The additional half topic is that Surgisphere says they are having the data audited 

We believe that an independent academic audit that validates those three functions as it relates to our papers in the New England Journal of Medicine and The Lancet will bring further transparency to our work, further highlight the quality of our work, and also continue to deserve the confidence of our work by our colleagues.

This process will follow strict boundaries as it relates to our data use agreements, among other considerations. We are pursuing such an independent audit with all due haste while ensuring compliance with various legal and regulatory concerns.

That’s good, but they don’t say by whom. Also “This process will follow strict boundaries as it relates to our data use agreements, among other considerations” is potentially a problem. Surgisphere have claimed that the data use agreements do not allow the hospitals to be identified. An audit that does not verify the participation of at least an auditor-determined sample of the hospitals is not worth much — and ideally there would be some checks of data against records in those hospitals. A proper audit would be a lot of work, but Surgisphere claim to have carried out some such checks themselves: they say in the research paper

Collection of a 100% sample from each health-care entity is validated against financial records and external databases to minimise selection bias.

Auditing, and data access in general, are expensive and annoying if you have to do them, but so is getting the wrong answer on treatment effectiveness in COVID-19.
June 2, 2020

NRL Predictions for Round 4

Team Ratings for Round 4

The basic method is described on my Department home page.
Here are the team ratings prior to this week’s games, along with the ratings at the start of the season.

Current Rating Rating at Season Start Difference
Storm 11.52 12.73 -1.20
Roosters 11.18 12.25 -1.10
Raiders 8.21 7.06 1.20
Eels 4.85 2.80 2.00
Sea Eagles 2.39 1.05 1.30
Rabbitohs 1.92 2.85 -0.90
Sharks 1.39 1.81 -0.40
Panthers 0.25 -0.13 0.40
Wests Tigers -0.16 -0.18 0.00
Cowboys -3.02 -3.95 0.90
Knights -3.67 -5.92 2.30
Bulldogs -3.97 -2.52 -1.50
Warriors -5.32 -5.17 -0.20
Broncos -5.40 -5.53 0.10
Dragons -7.43 -6.14 -1.30
Titans -14.75 -12.99 -1.80


Performance So Far

So far there have been 24 matches played, 14 of which were correctly predicted, a success rate of 58.3%.
Here are the predictions for last week’s games.

Game Date Score Prediction Correct
1 Broncos vs. Eels May 28 6 – 34 -6.20 TRUE
2 Cowboys vs. Titans May 29 36 – 6 12.00 TRUE
3 Roosters vs. Rabbitohs May 29 28 – 12 8.30 TRUE
4 Dragons vs. Warriors May 30 0 – 18 4.40 FALSE
5 Sharks vs. Wests Tigers May 30 16 – 28 3.10 FALSE
6 Storm vs. Raiders May 30 6 – 22 7.40 FALSE
7 Panthers vs. Knights May 31 14 – 14 4.50 FALSE
8 Sea Eagles vs. Bulldogs May 31 32 – 6 6.50 TRUE


Predictions for Round 4

Here are the predictions for Round 4. The prediction is my estimated expected points difference with a positive margin being a win to the home team, and a negative margin a win to the away team.

Game Date Winner Prediction
1 Broncos vs. Roosters Jun 04 Roosters -14.60
2 Panthers vs. Warriors Jun 05 Panthers 10.10
3 Storm vs. Rabbitohs Jun 05 Storm 11.60
4 Eels vs. Sea Eagles Jun 06 Eels 4.50
5 Cowboys vs. Sharks Jun 06 Sharks -2.40
6 Raiders vs. Knights Jun 07 Raiders 11.90
7 Titans vs. Wests Tigers Jun 07 Wests Tigers -12.60
8 Bulldogs vs. Dragons Jun 08 Bulldogs 3.50


June 1, 2020

It’s raining rain (hallelujah)

Not for the first time in history, but it hasn’t been happening nearly enough this year.

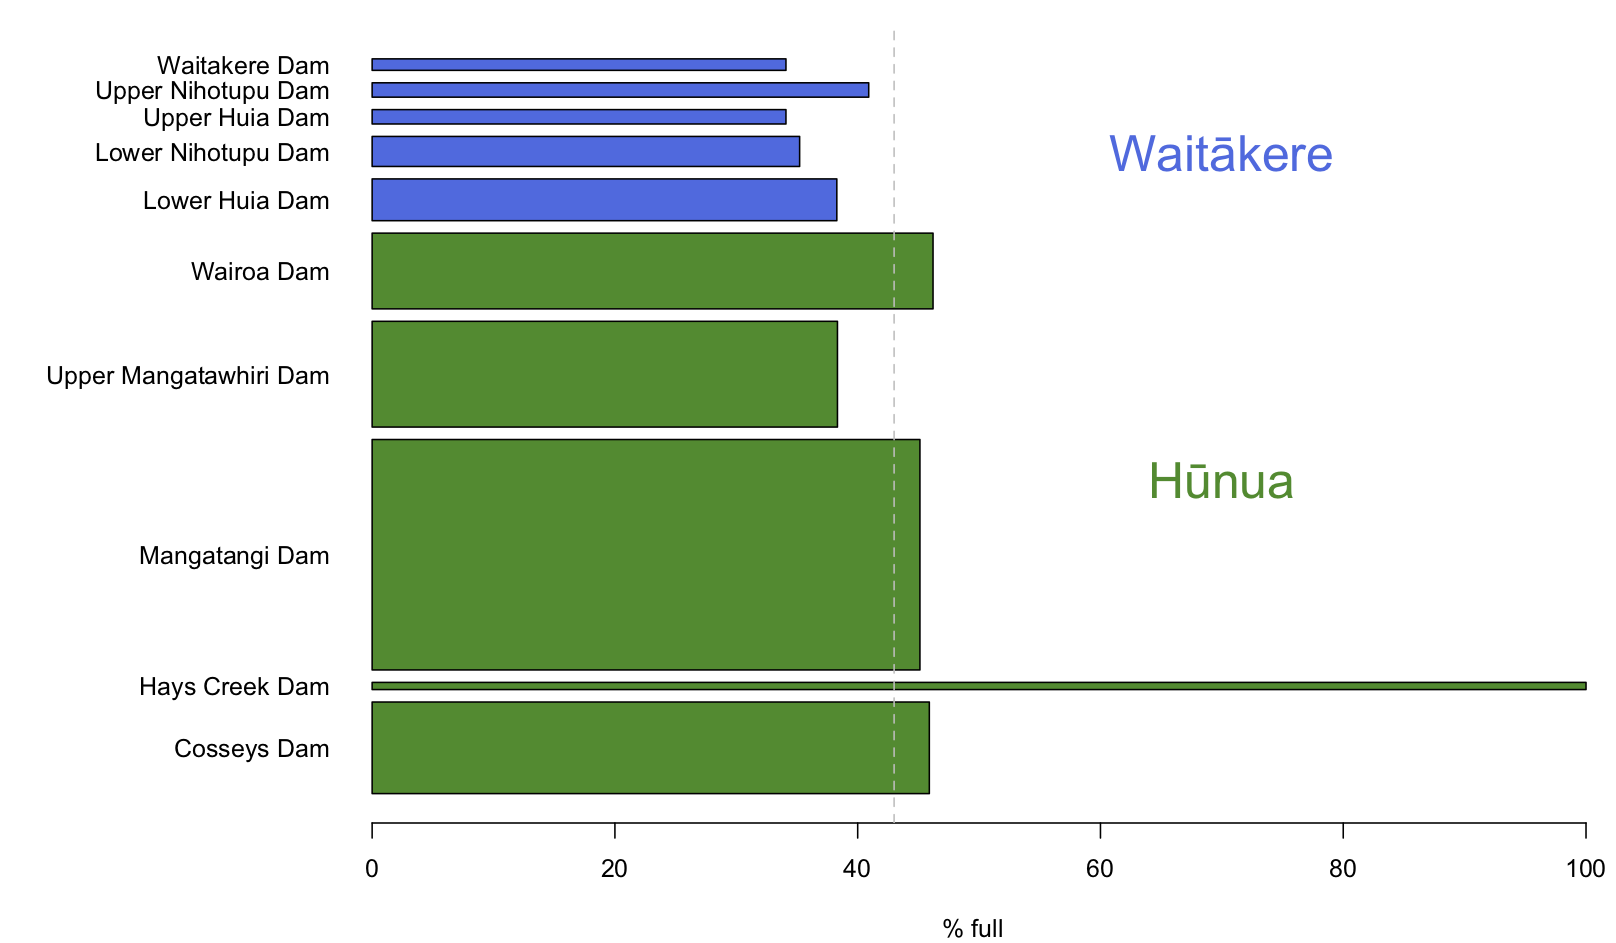
Here’s the state of Auckland’s water storage: the width of the bars is proportional to the capacity of the dam

I got the data from aucklandwatersupply.co.nz, which uses data from Watercare to produce graphics over time.  Auckland’s total stored water today is basically the same as it was on Friday.

[Auckland also has real-time water from the Waikato and from the Onehunga spring, but having to rely on those would be bad.]