Posts from September 2020 (31)

September 8, 2020

Pro14 Predictions for the Final

Team Ratings for the Final

The basic method is described on my Department home page.
Here are the team ratings prior to this week’s games, along with the ratings at the start of the season.

Current Rating Rating at Season Start Difference
Leinster 16.53 12.20 4.30
Munster 11.18 10.73 0.50
Glasgow Warriors 6.87 9.66 -2.80
Ulster 4.12 1.89 2.20
Edinburgh 3.82 1.24 2.60
Scarlets 3.16 3.91 -0.70
Connacht 0.34 2.68 -2.30
Cardiff Blues -0.36 0.54 -0.90
Cheetahs -0.46 -3.38 2.90
Ospreys -3.38 2.80 -6.20
Treviso -4.11 -1.33 -2.80
Dragons -8.03 -9.31 1.30
Zebre -14.76 -16.93 2.20
Southern Kings -14.92 -14.70 -0.20


Performance So Far

So far there have been 103 matches played, 79 of which were correctly predicted, a success rate of 76.7%.
Here are the predictions for last week’s games.

Game Date Score Prediction Correct
1 Leinster vs. Munster Sep 05 13 – 3 10.40 TRUE
2 Edinburgh vs. Ulster Sep 06 19 – 22 7.10 FALSE


Predictions for the Final

Here are the predictions for the Final. The prediction is my estimated expected points difference with a positive margin being a win to the home team, and a negative margin a win to the away team.

Game Date Winner Prediction
1 Leinster vs. Ulster Sep 13 Leinster 17.40


NRL Predictions for Round 18

Team Ratings for Round 18

The basic method is described on my Department home page.
Here are the team ratings prior to this week’s games, along with the ratings at the start of the season.

Current Rating Rating at Season Start Difference
Storm 14.42 12.73 1.70
Roosters 12.14 12.25 -0.10
Panthers 6.47 -0.13 6.60
Raiders 5.81 7.06 -1.20
Rabbitohs 5.72 2.85 2.90
Eels 3.48 2.80 0.70
Sharks -0.23 1.81 -2.00
Knights -0.43 -5.92 5.50
Warriors -2.68 -5.17 2.50
Wests Tigers -2.95 -0.18 -2.80
Sea Eagles -3.40 1.05 -4.40
Dragons -4.28 -6.14 1.90
Bulldogs -6.86 -2.52 -4.30
Cowboys -7.01 -3.95 -3.10
Titans -10.39 -12.99 2.60
Broncos -11.80 -5.53 -6.30


Performance So Far

So far there have been 136 matches played, 92 of which were correctly predicted, a success rate of 67.6%.
Here are the predictions for last week’s games.

Game Date Score Prediction Correct
1 Broncos vs. Panthers Sep 03 12 – 25 -16.80 TRUE
2 Knights vs. Sharks Sep 04 38 – 10 -0.70 FALSE
3 Rabbitohs vs. Storm Sep 04 16 – 22 -6.90 TRUE
4 Bulldogs vs. Titans Sep 05 14 – 18 6.70 FALSE
5 Sea Eagles vs. Wests Tigers Sep 05 32 – 34 2.10 FALSE
6 Raiders vs. Roosters Sep 05 6 – 14 -3.70 TRUE
7 Eels vs. Warriors Sep 06 24 – 18 11.40 TRUE
8 Cowboys vs. Dragons Sep 06 23 – 22 -1.10 FALSE


Predictions for Round 18

Here are the predictions for Round 18. The prediction is my estimated expected points difference with a positive margin being a win to the home team, and a negative margin a win to the away team.

Game Date Winner Prediction
1 Wests Tigers vs. Rabbitohs Sep 10 Rabbitohs -6.70
2 Bulldogs vs. Sea Eagles Sep 11 Sea Eagles -1.50
3 Panthers vs. Eels Sep 11 Panthers 5.00
4 Dragons vs. Raiders Sep 12 Raiders -8.10
5 Titans vs. Broncos Sep 12 Titans 3.40
6 Roosters vs. Knights Sep 12 Roosters 14.60
7 Storm vs. Cowboys Sep 13 Storm 21.40
8 Sharks vs. Warriors Sep 13 Sharks 6.90


Mitre 10 Cup Predictions for Round 1

Team Ratings for Round 1

The basic method is described on my Department home page.
Here are the team ratings prior to this week’s games, along with the ratings at the start of the season.

Current Rating Rating at Season Start Difference
Tasman 15.13 15.13 0.00
Canterbury 8.40 8.40 -0.00
Bay of Plenty 8.21 8.21 0.00
Auckland 6.75 6.75 -0.00
Wellington 6.47 6.47 0.00
North Harbour 2.87 2.87 -0.00
Waikato 1.31 1.31 -0.00
Hawke’s Bay 0.91 0.91 0.00
Otago -4.03 -4.03 -0.00
Taranaki -4.42 -4.42 -0.00
Counties Manukau -8.18 -8.18 -0.00
Northland -8.71 -8.71 0.00
Manawatu -10.57 -10.57 0.00
Southland -14.04 -14.04 -0.00


Predictions for Round 1

Here are the predictions for Round 1. The prediction is my estimated expected points difference with a positive margin being a win to the home team, and a negative margin a win to the away team.

Game Date Winner Prediction
1 North Harbour vs. Canterbury Sep 11 Canterbury -2.50
2 Waikato vs. Wellington Sep 12 Wellington -2.20
3 Otago vs. Auckland Sep 12 Auckland -7.80
4 Counties Manukau vs. Tasman Sep 12 Tasman -20.30
5 Northland vs. Manawatu Sep 13 Northland 4.90
6 Taranaki vs. Bay of Plenty Sep 13 Bay of Plenty -9.60
7 Southland vs. Hawke’s Bay Sep 13 Hawke’s Bay -11.90


September 7, 2020

Are we number two on COVID?

If you’ve been paying attention to the news you might have read that Forbes ranked NZ second in the world for COVID safety. If you chose more careful news sources, that you might instead have read that Forbes published a story about COVID safety ranking constructed by a company called Deep Knowledge Group.  It’s their second try; they published the first round in June.  And, of course, you might remember stories from the Before Times about New Zealand’s  poor ranking on the Global Health Security Index.

So, which of these indexes are right and which ones are wrong? It turns out that’s the wrong question, just as it is about rankings  of the most liveable city. These rankings aren’t trying to be predictive in a way that makes ‘right’ and ‘wrong’ objectively assessable.  What happens is that a group of people gathers together a whole lot of measurements.  These measurements range from ‘good’ to ‘bad’ on some scale. Points get awarded for how close you are to ‘good’ on each measurement and then added up. The experts then look at the rankings they got out, and probably adjust the points a bit to  make them look more plausible — there’s nothing wrong with this; the experts’ judgment is where there’s potentially value added by having this index.

There is a technical problem with reducing things to a sum of numbers in this way — and I say that as someone who likes numbers. We might all agree that, say, willingness to follow mask recommendations is positive, and that having a policy of mask recommendations when appropriate is positive. But these don’t add up: you need both of them.   Being more willing to follow government advice to wear masks does no good if the government is not giving that advice; having the government give the advice does no good if it isn’t followed.  You can’t represent A AND B as a weighted sum.  Weighted sums are a very limited subset of ways of combining ordered scales.

It’s clear how much opinion goes into the index construction when you see that the Global Health Security Index and the new COVID index share only two countries in their top ten: Australia and South Korea.  The United States and the UK top the GHS Index; Germany and NZ top the Deep one.  The real question is whether the indexes are useful, and they probably are — or, more precisely, whether the reports surrounding the indexes are useful, where the experts talk about the ways countries differ and their strengths and weaknesses.

If you wanted to think of the indexes as predictive, you’d want to look at the June edition and see how it’s fared.  Most of the top ten have done ok, but Israel, at number 3,  has had a bad few months, and now has 27,000 active cases in a country with less than twice the population of New Zealand.  They have been demoted to number 11: four places ahead of Taiwan, 21 ahead of Vietnam, and 83 ahead of Mongolia.

The index and its surrounding report contain useful information; for example they identify (admittedly with 2020 hindsight) the importance of political will to act and social acceptance of restrictions.  The ranking of NZ as the second-safest country is only meaningful if you don’t interpret ‘safest’ in some crudely reductive way as referring to the likely number of cases or hospitalisations or deaths.

September 5, 2020

How could we get a vaccine by November?

There are about forty COVID vaccine candidates now, with several heading to Phase 3 trials.   The  CDC has suggested there could be a vaccine before the US presidential election. How could that happen? There’s one obvious answer, sadly, but how else could it happen?

The FDA has said it would expect that a COVID-19 vaccine would prevent disease or decrease its severity in at least 50% of people who are vaccinated.  In the current circumstances, if your vaccine was that effective it would be false economy to run a trial that was too small — you’d want to be very confident of a positive result if your vaccine met the mark.

You might design a trial that ran until you had seen, say, 150 infections or symptomatic cases or whatever. If you ended up with a split of 50 vs 100, you’d estimate a 50% reduction with the vaccine, and the uncertainty interval (‘margin of error’) in would stretch to a 30% reduction, which correspond to the FDA’s guidance.   Only 150 cases perhaps doesn’t sound like much, but remember that at a very high infection rate of 1% you’d need 10,000 people in the control group and the same number in the treatment group. That’s a big trial.

It’s possible, though, that your vaccine is much better than just a 50% reduction in cases. If it actually prevents 90% of cases, you could have run a much smaller trial, at lower cost, finished earlier, and saved more lives.  On the other hand, if you ran the smaller trial and the effectiveness is only 50%, you are in big trouble — you won’t get approved, but you’ll find it harder to run another trial.

So, what we do is to set up a big trial that can detect a 50% benefit, and peek at the data part of the way through.  If the vaccine turns out to be 90% effective, you’ll be able to stop earlier than planned and declare victory.  You’ll still have recruited more people than if you were betting everything on 90% effectiveness, but you won’t be betting everything on 90% effectiveness.

Stopping early requires strong evidence.  It requires strong evidence because it’s easy to get fooled by randomness in early trends. It requires strong evidence because early stopping means less data on safety. And it  requires strong evidence because people are going to suspect political interference.  One popular guideline for designing early-stopping rules, to give us something concrete to look at, says that you take margin you’d need to be convinced at the end of the trial, and use that margin earlier on.  In our hypothetical example, we had 50 cases difference as the success criterion at the end of the trial, so you’d look for 50 cases difference at earlier timepoints as well.  That’s a much bigger relative difference early on:  if you only had 100 cases, a difference of 50 is 25 vs 75; with only 60 cases, it’s 5 vs 55.

My understanding is that a 90%-effective vaccine would be surprising, but not inconceivable and a 70%-effective vaccine isn’t at all unlikely, so interim analysis and the potential for early stopping do make sense.  Political interference doesn’t help, though: even more than most drugs, a vaccine only counts as effective if lots of people are willing to take it, and a trial that doesn’t engender that willingness is a failure no matter the statistical results.
September 4, 2020

Briefly

September 1, 2020

Perceptions of the level 3 alert in Auckland

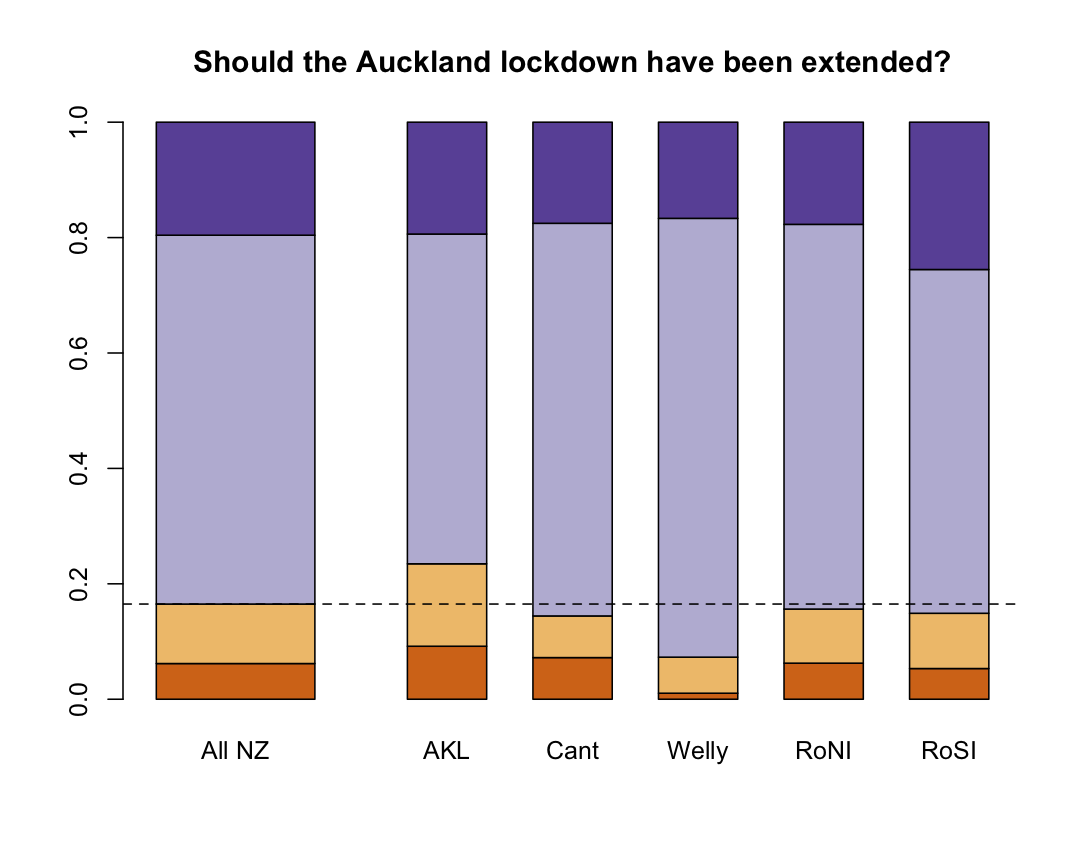
There’s an interesting poll in the NZ$ Herald asking whether the four-day extension to the Auckland level 3 ‘lockdown-lite’ was appropriate or not. Here’s a graph of the regional results (excluding the worryingly-small fration of “don’t knows”). The purples are ‘yes, should have been extended’, with the light purple being ‘the four day extension was appropriate’ and the dark being ‘longer would have been better’. The oranges are ‘no, should not’, with the light orange being ‘should not have been extended’ and the dark being ‘should not have happened at all’

As you can see, there’s pretty strong consensus across the country.  You’d expect people outside Auckland, who get the benefits but with less of the cost, to want tighter restrictions, and the patterns seem to fit that.

The Herald also explores differences by age, gender, and income. It’s hard to say anything too strong about many of the differences, because we’re only quoted a margin of error for the whole survey, not for any of the subgroups.  In some cases I can work it out: if Auckland and Canterbury were represented in the sample in proportion to their actual population sizes, the difference between the purple bars would be right about at the margin of error.  In general, though, the overall margin of error is pretty useless for most of what makes the story interesting.

Oh, and also.

Auckland is strongly divided over whether extending the lockdown was an appropriate response to the resurgence of Covid-19, a new poll shows.

But the exclusive new poll shows rest of the country was far more accepting of the Super City being kept in alert level 3 for almost three weeks – with many wanting it extended even longer.

Emphasis added.

No. That’s really not what the poll says

Super Rugby Australia Predictions for Round 10

Team Ratings for Round 10

As an indication of the care needed at present in determining home ground advantage, the comprehensive scores site flashscore.com.au still has the Rebels v Waratahs game as being played in Melbourne. (Click on the match result to see the scorers and times and match details at the bottom.) Fortunately I checked beforehand that it was to be played in Sydney so I gave the Waratahs home ground advantage and predicted them to win. Otherwise I would have predicted the Rebels, even if played on a neutral ground.

The basic method is described on my Department home page.
Here are the team ratings prior to this week’s games, along with the ratings at the start of the season.

Current Rating Rating at Season Start Difference
Brumbies 2.90 4.67 -1.80
Reds 0.41 -0.31 0.70
Rebels -3.26 -5.52 2.30
Waratahs -4.64 -7.12 2.50
Force -13.69 -10.00 -3.70


Performance So Far

So far there have been 18 matches played, 15 of which were correctly predicted, a success rate of 83.3%.
Here are the predictions for last week’s games.

Game Date Score Prediction Correct
1 Brumbies vs. Force Aug 28 31 – 14 22.00 TRUE
2 Waratahs vs. Rebels Aug 29 38 – 32 2.50 TRUE


Predictions for Round 10

Here are the predictions for Round 10. The prediction is my estimated expected points difference with a positive margin being a win to the home team, and a negative margin a win to the away team.

Game Date Winner Prediction
1 Rebels vs. Force Sep 04 Rebels 10.40
2 Reds vs. Brumbies Sep 05 Reds 2.00


Rugby Premiership Predictions for Round 18

Team Ratings for Round 18

The basic method is described on my Department home page.
Here are the team ratings prior to this week’s games, along with the ratings at the start of the season.

Current Rating Rating at Season Start Difference
Exeter Chiefs 11.90 7.99 3.90
Saracens 8.31 9.34 -1.00
Sale Sharks 6.97 0.17 6.80
Wasps 2.25 0.31 1.90
Bath 0.62 1.10 -0.50
Gloucester 0.27 0.58 -0.30
Bristol -0.21 -2.77 2.60
Northampton Saints -1.79 0.25 -2.00
Harlequins -1.83 -0.81 -1.00
Leicester Tigers -4.85 -1.76 -3.10
Worcester Warriors -7.31 -2.69 -4.60
London Irish -8.13 -5.51 -2.60


Performance So Far

So far there have been 102 matches played, 66 of which were correctly predicted, a success rate of 64.7%.
Here are the predictions for last week’s games.

Game Date Score Prediction Correct
1 Sale Sharks vs. Bristol Aug 30 40 – 7 9.30 TRUE
2 Harlequins vs. Northampton Saints Aug 30 30 – 17 3.40 TRUE
3 Exeter Chiefs vs. Worcester Warriors Aug 31 59 – 7 20.70 TRUE
4 Gloucester vs. Leicester Tigers Aug 31 46 – 30 8.80 TRUE
5 London Irish vs. Saracens Aug 31 12 – 40 -10.10 TRUE
6 Bath vs. Wasps Sep 01 23 – 27 3.80 FALSE


Predictions for Round 18

Here are the predictions for Round 18. The prediction is my estimated expected points difference with a positive margin being a win to the home team, and a negative margin a win to the away team.

Game Date Winner Prediction
1 Worcester Warriors vs. Bristol Sep 05 Bristol -2.60
2 Northampton Saints vs. Exeter Chiefs Sep 05 Exeter Chiefs -9.20
3 Saracens vs. Wasps Sep 05 Saracens 10.60
4 Harlequins vs. Bath Sep 05 Harlequins 2.10
5 Leicester Tigers vs. Sale Sharks Sep 06 Sale Sharks -7.30
6 Gloucester vs. London Irish Sep 06 Gloucester 12.90


Pro14 Predictions for the Semi-finals

Team Ratings for the Semi-finals

The basic method is described on my Department home page.
Here are the team ratings prior to this week’s games, along with the ratings at the start of the season.

Current Rating Rating at Season Start Difference
Leinster 16.57 12.20 4.40
Munster 11.14 10.73 0.40
Glasgow Warriors 6.87 9.66 -2.80
Edinburgh 4.28 1.24 3.00
Ulster 3.66 1.89 1.80
Scarlets 3.16 3.91 -0.70
Connacht 0.34 2.68 -2.30
Cardiff Blues -0.36 0.54 -0.90
Cheetahs -0.46 -3.38 2.90
Ospreys -3.38 2.80 -6.20
Treviso -4.11 -1.33 -2.80
Dragons -8.03 -9.31 1.30
Zebre -14.76 -16.93 2.20
Southern Kings -14.92 -14.70 -0.20


Performance So Far

So far there have been 101 matches played, 78 of which were correctly predicted, a success rate of 77.2%.
Here are the predictions for last week’s games.

Game Date Score Prediction Correct
1 Glasgow Warriors vs. Edinburgh Aug 29 15 – 3 6.60 TRUE
2 Dragons vs. Scarlets Aug 30 20 – 41 -4.90 TRUE
3 Ulster vs. Leinster Aug 30 10 – 28 -6.90 TRUE
4 Munster vs. Connacht Aug 31 49 – 12 14.20 TRUE
5 Cardiff Blues vs. Ospreys Aug 31 29 – 20 7.80 TRUE
6 Zebre vs. Treviso Aug 31 9 – 16 -5.40 TRUE


Predictions for the Semi-finals

Here are the predictions for the Semi-finals. The prediction is my estimated expected points difference with a positive margin being a win to the home team, and a negative margin a win to the away team.

Game Date Winner Prediction
1 Leinster vs. Munster Sep 05 Leinster 10.40
2 Edinburgh vs. Ulster Sep 06 Edinburgh 7.10