Posts from May 2020 (14)

May 3, 2020

What will COVID vaccine trials look like?

There are over 100 potential vaccines being developed, and several are already in preliminary testing in humans.  There are three steps to testing a vaccine: showing that it doesn’t have any common, nasty side effects; showing that it raises antibodies; showing that vaccinated people don’t get COVID-19.

The last step is the big one, especially if you want it fast. I knew that in principle, but I was prompted to run the numbers by hearing (from Hilda Bastian) of a Danish trial in 6000 people looking at whether wearing masks reduces infection risk.  With 3000 people in each group, and with the no-mask people having a 2% infection rate over two months, and with masks halving the infection rate, the trial would still have more than a 1 in 10 chance of missing the effect.  Reality is less favorable:  2% infections is more than 10 times the population percentage of confirmed cases so far in Denmark (more than 50 times the NZ rate), and halving the infection rate seems unreasonably optimistic.

That’s what we’re looking at for a vaccine. We don’t expect perfection, and if a vaccine truly reduces the infection rate by 50% it would be a serious mistake to discard it as useless. But if the control-group infection rate over a couple of months is a high-but-maybe-plausible 0.2%  that means 600,000 people in the trial — one of the largest clinical trials in history.

How can that be reduced?  If the trial was done somewhere with out-of-control disease transmission, the rate of infection in controls might be 5% and a moderately large trial would be sufficient. But doing a randomised trial in setting like that is hard — and ethically dubious if it’s a developing-world population that won’t be getting a successful vaccine any time soon.  If the trial took a couple of years, rather than a couple of months, the infection rate could be 3-4 times lower — but we can’t afford to wait a couple of years.

The other possibility is deliberate infection. If you deliberately exposed trial participants to the coronavirus, you could run a trial with only hundreds of participants, and no more COVID deaths, in total, than a larger trial. But signing people up for deliberate exposure to a potentially deadly infection when half of them are getting placebo is something you don’t want to do without very careful consideration and widespread consultation.  I’m fairly far out on the ‘individual consent over paternalism’ end of the bioethics spectrum, and even I’d be a bit worried that consenting to coronavirus infection could be a sign that you weren’t giving free, informed, consent.



May 2, 2020

Hype

This turned up via Twitter, with the headline Pitt researchers developing a nasal spray that could prevent covid-19

“The nice thing about Q-griffithsin is that it has a number of activities against other viruses and pathogens,” said Lisa Rohan, an associate professor in Pitt’s School of Pharmacy and one of the lead researchers in the collaboration, in a statement. “It’s been shown to be effective against Ebola, herpes and hepatitis, as well as a broad spectrum of coronaviruses, including SARS and MERS.”

The active ingredient is the synthetic form of protein extracted from a seaweed found in Australia and NZ. Guess how many human studies there have been of this treatment?

Clinicaltrials.gov reports one completed safety study of a vaginal gel, and one ongoing safety study of rectal administration, both aimed at HIV prevention. There appear to have been no studies against coronaviruses in humans, nor Ebola, herpes, or hepatitis. There appear to have been no studies of a nasal-spray version in humans (and I couldn’t even find any in animals, just studies of tissue samples in a lab). It’s not clear that a nasal spray would work even if it worked — eg, is preventing infection via the nose enough, or do you need to worry about the mouth.

Researchers should absolutely be trying all these things, but making claims of demonstrated effectiveness is not on.  We don’t want busy journalists having to ask Dr Bloomfield if we should stick seaweed up our noses.

Population density

With NZ’s good-so-far control of the coronavirus, there has been discussion on the internets as to whether New Zealand has high or low population density, and also on whether March/April is summer here or not.  The second question is easy. It’s not summer here. The first is harder.

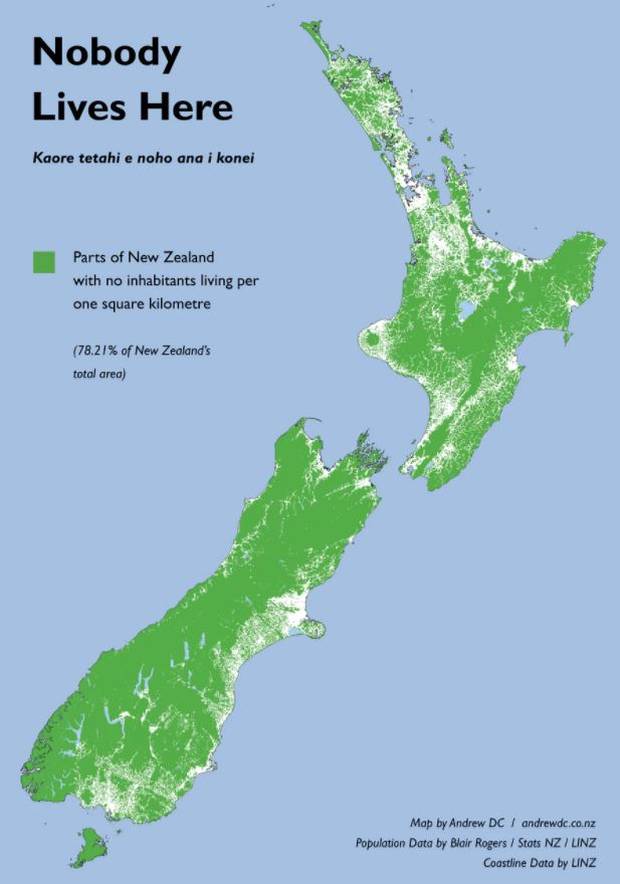
New Zealand’s average population density is very low.  It’s lower than the USA. It’s lower than the UK. It’s lower than Italy even if you count the sheep.  On the other hand, a lot of New Zealand has no people in it, so the density in places that have people is higher.  Here are a couple of maps: “Nobody Lives Here” by Andrew Douglas-Clifford, showing the 78% of the country’s land area with no inhabitants, and a 3-d map of population density by Alasdair Rae (@undertheraedar)

We really should be looking at the population density of inhabited areas. That’s harder than it sounds, because it makes a big difference where you draw the boundaries. Take Dunedin. The local government area goes on for ever in all directions. You can get on an old-fashioned train at the Dunedin station, and travel 75km through countryside and scenic gorges to the historic town of Middlemarch, and you’ll still be in Dunedin. The average population density is 40 people per square kilometre.  If you look just within the StatsNZ urban boundary, the average population density is 410/square kilometre — ten times higher.

A better solution is population-weighted density, where you work out the population density where each person lives and average them. Population-weighted density tells you how far away is the average person’s nearest neighbour; how far you can go within bumping into someone else’s bubble.The boundary problem doesn’t matter as much: hardly anyone lives in 90% of Dunedin, so it gets little weight — including or excluding the non-urban area doesn’t affect the average.  What does matter is the resolution.

If you work out population weighted densities using 1km squares you will get a larger number than if you use 2km squares, because the 1km square ignores density variation within 1km, and the 2km squares ignore density variation within 2km. If you use census meshblocks you will get a larger number than if you use electorates, and so on.  That can be an issue for international comparisons

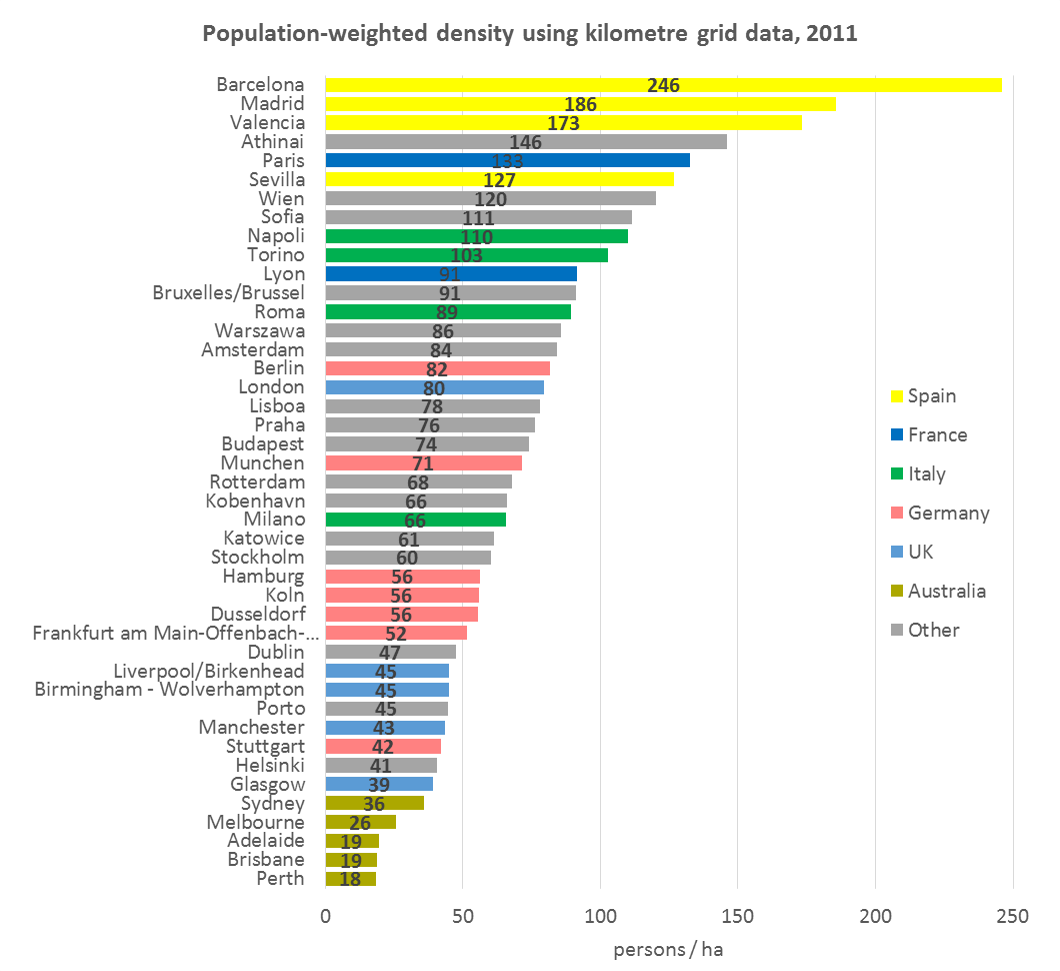
However, this is a graph of population-weighted density with 1km squares across a wide range of European and Australian cities using 1km square grids, in units of people per hectare:

If you compare the Australian and NZ cities using meshblocks, Auckland slots in just behind Melbourne, with Wellington following, and Christchurch is a little lower than Perth. The New York Metropolitan Area is at about 120.  Greater LA, the San Francisco Bay Area, and Honolulu, are in the mid-40s, based on Census Bureau data. New York City is at about 200.  I couldn’t find data for any Asian cities, but here’s a map of Singapore showing that a lot of people live in areas with population density well over 2000 people per square kilometre, or 200/hectare.

So, yes, New Zealand is more urban than foreigners might think, and Auckland is denser than many US metropolitan areas. But by world standards even Auckland and Wellington are pretty spacious.

May 1, 2020

The right word

Scientists often speak their own language. They sometimes use strange words, and they sometimes use normal words but mean something different by them.  Toby Morris & Siouxsie Wiles have an animation of some examples.

The goal of scientific language is usually to be precise, to make distinctions that aren’t important in everyday speech. Scientists aren’t trying to confuse you or keep you out, though those effects can happen  — and they aren’t always unwelcome.  I’ve written on my blog about two examples: bacteria vs virus (where the scientists are right) and organic (where they need to get over themselves).

This week’s example of conflict between trying to be approachable and trying to be precise is the phrase “false positive rate”.  When someone gets a COVID test, whether looking for the virus itself or looking for antibodies they’ve made in reaction to it, the test could be positive or negative.  We can also divide people up by whether they really have/had COVID infection or no infection. This gives four possibilities

  • True positives:  positive test, have/had COVID
  • True negatives: negative test, really no COVID
  • False positives: positive test, really no COVID
  • False negatives: negative test, have/had COVID

If you encounter something called the “false positive rate”, what is it? It obvious involves the false positives, divided by something, but it could be false positives as a proportion of all positive tests, or false positives as a proportion of people who don’t have COVID, or even false positives as a proportion of all tests.  It turns out that the first two of these definitions are both in common use.

Scientists (statisticians and epidemiologists) would define two pairs of accuracy summaries

  • Sensitivity:  true positives divided by people with COVID
  • Specificity: true negatives divided by people without COVID
  • Positive Predictive Value(PPV): true positives divided by all positives
  • Negative Predictive Value(NPV): true negatives divided by all negatives

The first ‘false positive rate’ definition is 1-PPV NPV; the second is 1-specificity.

If you write about the antibody studies carried out in the US, you can either use the precise terms, which will put off people who don’t know anything, or use the vague terms, and people who know a bit about the topic may misunderstand and think you’ve got them wrong.