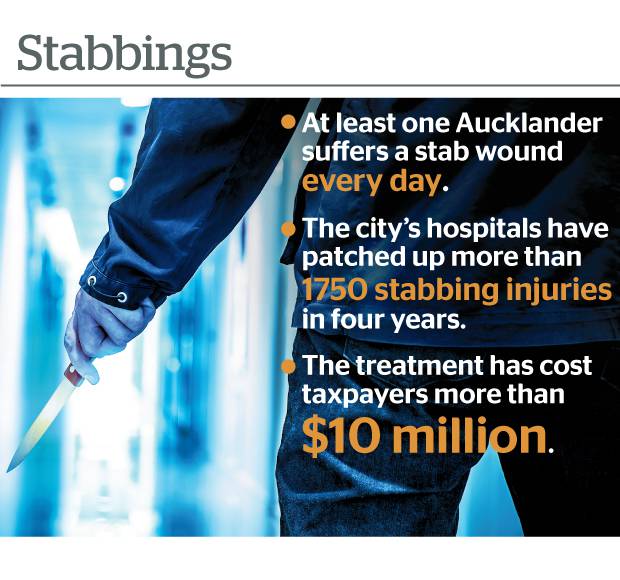
Stabbing stats
From the Herald (and from the front page in the squashed-trees edition)
I’m not disputing the basic message that people being stabbed is bad and we’d like less of it. And it’s good that numbers are being given, but there’s at least three issues with those numbers. On top of the familiar “quote a total over four years because it’s bigger”.
The first is that the numbers don’t refer exclusively to “Aucklanders”. As the story says
But a spokeswoman noted it was a regional 24/7 trauma centre for patients around Auckland and Northland, meaning many of the most serious trauma cases were directed to Auckland Hospital.
And secondly, the definition of ‘stabbing injury’ varies by DHB: Auckland DHB was reporting only stab wounds from assaults and self-harm, but
Counties Manukau chief executive Fepulea’i Margie Apa said the DHB’s figures included all stabbing injuries from any cause, “not only those from violence”.
Are there many cases of accidental stabbings? Well, we regularly get told about carving-knife accidents at Christmas, and about ‘avocado hand’, so there are some, but it’s hard to guess how many. If you were doing this seriously, you’d come up with a list of relevant ICD-10 categories and ask the DHBs for numbers in those categories, but that takes medical knowledge and might risk a ‘too hard’ refusal from the DHB.
The third issue is going from 1750 in four years to “at least one every day”. On average, there were about 1.2 events per day. At that rate it would be really surprising (and newsworthy) if there was at least one every day. You’d expect them to clump more than that.
The simplest mathematical model for counts of events is the Poisson process, which has no ‘built-in’ clumping: it describes a world where there are no high-risk days (hot, humid Saturday nights? Bad sports results?), and where all stabbings are independent (no multiple-stabbing fights or robberies). Even under the Poisson model, you would expect about 30% of days to have no stabbings. In the real world, you’d expect more days with two or more stabbings and more days with zero.
Getting less clumpiness than a Poisson model takes some sort of conspiracy. The best-known NZ example is two-dimensional (space) rather than one-dimensional (time), as in this photo by Flickr user Alexander Kesselaar
Glow worms in a cave spread out more evenly than a Poisson process would predict, because they keep away from each other. Stabbings probably don’t
Thomas Lumley (@tslumley) is Professor of Biostatistics at the University of Auckland. His research interests include semiparametric models, survey sampling, statistical computing, foundations of statistics, and whatever methodological problems his medical collaborators come up with. He also blogs at Biased and Inefficient See all posts by Thomas Lumley »


The clinical/accounting software that DHBs have run , in different versions over nearly 35 yrs, will have the ICD10 numbers fairly easily. Conversely put in a patient name and up comes the list of ICD numbers for that patient and the total cost of treatment. It should even give numbers for ‘stabbing or cutting wounds’ per week for say the last year, to see if there is any statistical patterns
5 years ago
Indeed. But from the journalist’s point of view, it has to be straightforward, but also the journalist has to know that it’s straightforward so there won’t be a legitimate OIA refusal.
5 years ago
Maybe 20 years – I still remember from around then having to convert between icd9 and icd10 codes and having huge problems as different DHBs treated ED data collection differently for non-admits.
5 years ago
That’s ~$5700 per patient, which, is approximately the cost of say, getting a cataract done privately.
Seems like, almost all of that has to be local anesthetic, cleaning, stitches, and just generally having hospitals exist with doctors and nurses in them for the time that took.
$10 million is not much money in four years. At all.
5 years ago