Posts from February 2020 (15)

February 18, 2020

Pro14 Predictions for Round 12

Team Ratings for Round 12

The basic method is described on my Department home page.
Here are the team ratings prior to this week’s games, along with the ratings at the start of the season.

Current Rating Rating at Season Start Difference
Leinster 16.23 12.20 4.00
Munster 8.93 10.73 -1.80
Glasgow Warriors 7.08 9.66 -2.60
Edinburgh 5.28 1.24 4.00
Ulster 4.71 1.89 2.80
Scarlets 3.01 3.91 -0.90
Connacht 1.25 2.68 -1.40
Cheetahs -0.16 -3.38 3.20
Cardiff Blues -0.39 0.54 -0.90
Ospreys -3.27 2.80 -6.10
Treviso -4.04 -1.33 -2.70
Dragons -8.38 -9.31 0.90
Zebre -14.89 -16.93 2.00
Southern Kings -15.35 -14.70 -0.70


Performance So Far

So far there have been 76 matches played, 58 of which were correctly predicted, a success rate of 76.3%.
Here are the predictions for last week’s games.

Game Date Score Prediction Correct
1 Glasgow Warriors vs. Zebre Feb 15 56 – 24 27.70 TRUE
2 Munster vs. Southern Kings Feb 15 68 – 3 28.50 TRUE
3 Leinster vs. Cheetahs Feb 16 36 – 12 22.60 TRUE
4 Scarlets vs. Edinburgh Feb 16 9 – 14 5.10 FALSE
5 Ospreys vs. Ulster Feb 16 26 – 24 -2.20 FALSE
6 Connacht vs. Cardiff Blues Feb 16 29 – 0 6.50 TRUE


Predictions for Round 12

Here are the predictions for Round 12. The prediction is my estimated expected points difference with a positive margin being a win to the home team, and a negative margin a win to the away team.

Game Date Winner Prediction
1 Ospreys vs. Leinster Feb 22 Leinster -13.00
2 Edinburgh vs. Connacht Feb 22 Edinburgh 10.50
3 Zebre vs. Munster Feb 22 Munster -17.30
4 Glasgow Warriors vs. Dragons Feb 23 Glasgow Warriors 22.00
5 Ulster vs. Cheetahs Feb 23 Ulster 11.40
6 Cardiff Blues vs. Treviso Feb 24 Cardiff Blues 10.20
7 Scarlets vs. Southern Kings Feb 24 Scarlets 24.90


Pro14 Predictions for Round 11

Team Ratings for Round 11

I missed posting predictions for this round thinking that there was a longer break between games. Because I use an algorithm and code and no subjective analysis, these predictions are exactly what I would have posted and I am posting them now for completeness.

The basic method is described on my Department home page.
Here are the team ratings prior to this week’s games, along with the ratings at the start of the season.

Current Rating Rating at Season Start Difference
Leinster 16.11 12.20 3.90
Munster 7.81 10.73 -2.90
Glasgow Warriors 6.69 9.66 -3.00
Ulster 5.09 1.89 3.20
Edinburgh 4.82 1.24 3.60
Scarlets 3.47 3.91 -0.40
Connacht 0.45 2.68 -2.20
Cardiff Blues 0.41 0.54 -0.10
Cheetahs -0.03 -3.38 3.30
Ospreys -3.65 2.80 -6.50
Treviso -4.04 -1.33 -2.70
Dragons -8.38 -9.31 0.90
Southern Kings -14.24 -14.70 0.50
Zebre -14.51 -16.93 2.40


Performance So Far

So far there have been 70 matches played, 54 of which were correctly predicted, a success rate of 77.1%.
Here are the predictions for last week’s games.

Game Date Score Prediction Correct
1 Cheetahs vs. Southern Kings 45 – 0 17.40 TRUE


Predictions for Round 11

Here are the predictions for Round 11. The prediction is my estimated expected points difference with a positive margin being a win to the home team, and a negative margin a win to the away team.

Game Date Winner Prediction
1 Glasgow Warriors vs. Zebre Glasgow Warriors 27.70
2 Munster vs. Southern Kings Munster 28.50
3 Leinster vs. Cheetahs Leinster 22.60
4 Scarlets vs. Edinburgh Scarlets 5.10
5 Ospreys vs. Ulster Ulster -2.20
6 Connacht vs. Cardiff Blues Connacht 6.50


February 11, 2020

Super Rugby Predictions for Round 3


Team Ratings for Round 3

The basic method is described on my Department home page.
Here are the team ratings prior to this week’s games, along with the ratings at the start of the season.

Current Rating Rating at Season Start Difference
Crusaders 15.36 17.10 -1.70
Jaguares 7.64 7.23 0.40
Hurricanes 7.59 8.79 -1.20
Chiefs 7.56 5.91 1.70
Highlanders 2.44 4.53 -2.10
Stormers 1.97 -0.71 2.70
Sharks 1.73 -0.87 2.60
Brumbies 1.19 2.01 -0.80
Blues 0.99 -0.04 1.00
Bulls 0.05 1.28 -1.20
Lions -1.08 0.39 -1.50
Waratahs -3.42 -2.48 -0.90
Reds -4.88 -5.86 1.00
Rebels -8.64 -7.84 -0.80
Sunwolves -17.51 -18.45 0.90


Performance So Far

So far there have been 14 matches played, 8 of which were correctly predicted, a success rate of 57.1%.
Here are the predictions for last week’s games.

Game Date Score Prediction Correct
1 Highlanders vs. Sharks Feb 07 20 – 42 10.90 FALSE
2 Brumbies vs. Rebels Feb 07 39 – 26 14.60 TRUE
3 Chiefs vs. Crusaders Feb 08 25 – 15 -5.40 FALSE
4 Waratahs vs. Blues Feb 08 12 – 32 4.80 FALSE
5 Lions vs. Reds Feb 08 27 – 20 10.40 TRUE
6 Stormers vs. Bulls Feb 08 13 – 0 5.00 TRUE
7 Jaguares vs. Hurricanes Feb 08 23 – 26 7.50 FALSE


Predictions for Round 3

Here are the predictions for Round 3. The prediction is my estimated expected points difference with a positive margin being a win to the home team, and a negative margin a win to the away team.

Game Date Winner Prediction
1 Blues vs. Crusaders Feb 14 Crusaders -9.90
2 Rebels vs. Waratahs Feb 14 Waratahs -0.70
3 Sunwolves vs. Chiefs Feb 15 Chiefs -19.10
4 Hurricanes vs. Sharks Feb 15 Hurricanes 11.90
5 Brumbies vs. Highlanders Feb 15 Brumbies 4.80
6 Lions vs. Stormers Feb 15 Lions 1.50
7 Jaguares vs. Reds Feb 15 Jaguares 18.50


February 4, 2020

Super Rugby Predictions for Round 2

Team Ratings for Round 2

The basic method is described on my Department home page.
Here are the team ratings prior to this week’s games, along with the ratings at the start of the season.

Current Rating Rating at Season Start Difference
Crusaders 16.42 17.10 -0.70
Jaguares 8.39 7.23 1.20
Hurricanes 6.84 8.79 -2.00
Chiefs 6.50 5.91 0.60
Highlanders 4.53 4.53 0.00
Brumbies 1.34 2.01 -0.70
Stormers 1.24 -0.71 1.90
Bulls 0.77 1.28 -0.50
Sharks -0.36 -0.87 0.50
Blues -0.63 -0.04 -0.60
Lions -0.77 0.39 -1.20
Waratahs -1.80 -2.48 0.70
Reds -5.19 -5.86 0.70
Rebels -8.79 -7.84 -0.90
Sunwolves -17.51 -18.45 0.90


Performance So Far

So far there have been 7 matches played, 5 of which were correctly predicted, a success rate of 71.4%.
Here are the predictions for last week’s games.

Game Date Score Prediction Correct
1 Blues vs. Chiefs Jan 31 29 – 37 -1.40 TRUE
2 Brumbies vs. Reds Jan 31 27 – 24 12.40 TRUE
3 Sharks vs. Bulls Jan 31 23 – 15 2.40 TRUE
4 Sunwolves vs. Rebels Feb 01 36 – 27 -4.60 FALSE
5 Crusaders vs. Waratahs Feb 01 43 – 25 25.60 TRUE
6 Stormers vs. Hurricanes Feb 01 27 – 0 -3.50 FALSE
7 Jaguares vs. Lions Feb 01 38 – 8 12.80 TRUE


Predictions for Round 2

Here are the predictions for Round 2. The prediction is my estimated expected points difference with a positive margin being a win to the home team, and a negative margin a win to the away team.

Game Date Winner Prediction
1 Highlanders vs. Sharks Feb 07 Highlanders 10.90
2 Brumbies vs. Rebels Feb 07 Brumbies 14.60
3 Chiefs vs. Crusaders Feb 08 Crusaders -5.40
4 Waratahs vs. Blues Feb 08 Waratahs 4.80
5 Lions vs. Reds Feb 08 Lions 10.40
6 Stormers vs. Bulls Feb 08 Stormers 5.00
7 Jaguares vs. Hurricanes Feb 08 Jaguares 7.50


February 2, 2020

Graphs don’t matter?

Back in early December, I wrote about a political ad authorised by Simon Bridges, showing the price of fuel.

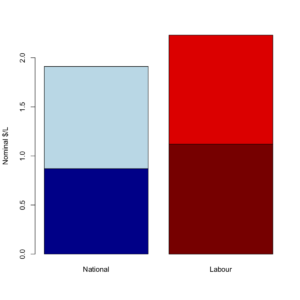
As I said the, the numbers do not remotely match the graph.  A graph using those numbers would look more like

Dylan Reeve and other people complained to the Advertising Standards Authority, both about the graph itself and about the choice of numbers, which (in his opinion and mine) was cherrypicked in a misleading way.

The ASA decided (in a split decision) that the graphic was not misleading

The majority said the data displayed was correct which saved the hyperbolic graphic from being misleading, given the political medium used and the principles of advocacy advertising.

I believe this is decision is bad in terms of norms for mainstream political advertising, and that it’s likely to be factually incorrect as to the impact of the graphic.

The cherrypicked numbers are misleading, but they are misleading in a way that is, sadly, routine in political advertising.  I’ve written about examples from both parties here since StatsChat started. My starting point for any political advocacy involving numerical comparisons is always that the numbers are likely to be correct as quoted, but chosen to mislead. Given the established norms,  I can understand the ASA not wanting to get involved.

The distorted graph, on the other hand, seems to be new.  I was genuinely surprised at the extent of the distortion — well beyond common tricks of perspective or false baseline.

If writing the numbers on a misleading graph was enough to stop it being misleading, there would be no point having data graphics.  The whole point of data graphics is that they provide a clearer and more forceful impression of the data than just tabulating the numbers.  Misleading graphs are misleading.