Posts from June 2019 (11)

June 25, 2019

Super Rugby Predictions for the Semi-finals

Team Ratings for the Semi-finals

The basic method is described on my Department home page.
Here are the team ratings prior to this week’s games, along with the ratings at the start of the season.

Current Rating Rating at Season Start Difference
Crusaders 17.72 17.67 0.10
Hurricanes 8.27 9.43 -1.20
Chiefs 5.91 8.56 -2.60
Jaguares 5.81 -0.26 6.10
Highlanders 4.28 4.01 0.30
Brumbies 3.57 0.00 3.60
Bulls 1.28 -3.79 5.10
Lions 0.40 8.28 -7.90
Blues -0.05 -3.42 3.40
Stormers -0.71 -0.39 -0.30
Sharks -0.85 0.45 -1.30
Waratahs -2.48 2.00 -4.50
Reds -5.86 -8.19 2.30
Rebels -7.82 -7.26 -0.60
Sunwolves -18.47 -16.08 -2.40


Performance So Far

So far there have been 123 matches played, 83 of which were correctly predicted, a success rate of 67.5%.
Here are the predictions for last week’s games.

Game Date Score Prediction Correct
1 Crusaders vs. Highlanders Jan 14 38 – 14 16.00 TRUE
2 Jaguares vs. Chiefs Jun 21 21 – 16 3.80 TRUE
3 Hurricanes vs. Bulls Jun 22 35 – 28 11.50 TRUE
4 Brumbies vs. Sharks Jun 22 38 – 13 6.20 TRUE


Predictions for the Semi-finals

Here are the predictions for the Semi-finals. The prediction is my estimated expected points difference with a positive margin being a win to the home team, and a negative margin a win to the away team.

Game Date Winner Prediction
1 Jaguares vs. Brumbies Jun 29 Jaguares 6.20
2 Crusaders vs. Hurricanes Jun 29 Crusaders 13.00


June 19, 2019

Summary offences

The NZ Police have put out a report “based on the most frequent data requests made by members of the public under the Official Information Act and is organised according to the largest areas of demand that Police responds to.” (via Nat Dudley on Twitter)

That’s great. There are numbers and tables and graphical summaries.  Very useful.

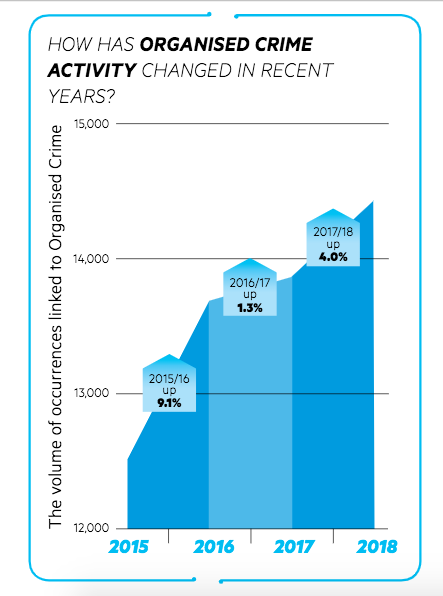
On the other hand, this is typical of the graphs

The report has a lot of charts like this, showing trends over time.  They look as if they are using areas to depict the data, but they all have truncated y-axes that make the year-to-year variation look more dramatic.  The bottom 75% of this chart has gone missing.

If you want to use a truncated y-axis you can, with a line chart and axis designs that don’t make the bottom of the graph look as if it’s zero.  For example, patterns in the Keeling Curve of atmospheric CO2 are more apparent if the whole range down to zero ppm isn’t shown. In this case, though, there’s no obvious benefit. It’s just misleading.

June 18, 2019

Super Rugby Predictions for the Quarter-finals

Team Ratings for the Quarter-finals

The basic method is described on my Department home page.
Here are the team ratings prior to this week’s games, along with the ratings at the start of the season.

Current Rating Rating at Season Start Difference
Crusaders 17.24 17.67 -0.40
Hurricanes 8.54 9.43 -0.90
Chiefs 5.98 8.56 -2.60
Jaguares 5.74 -0.26 6.00
Highlanders 4.76 4.01 0.80
Brumbies 2.44 0.00 2.40
Bulls 1.01 -3.79 4.80
Lions 0.40 8.28 -7.90
Sharks 0.28 0.45 -0.20
Blues -0.05 -3.42 3.40
Stormers -0.71 -0.39 -0.30
Waratahs -2.48 2.00 -4.50
Reds -5.86 -8.19 2.30
Rebels -7.82 -7.26 -0.60
Sunwolves -18.47 -16.08 -2.40


Performance So Far

So far there have been 119 matches played, 79 of which were correctly predicted, a success rate of 66.4%.
Here are the predictions for last week’s games.

Game Date Score Prediction Correct
1 Highlanders vs. Waratahs Jun 14 49 – 12 7.70 TRUE
2 Rebels vs. Chiefs Jun 14 8 – 59 -4.20 TRUE
3 Jaguares vs. Sunwolves Jun 14 52 – 10 26.30 TRUE
4 Hurricanes vs. Blues Jun 15 29 – 24 13.10 TRUE
5 Brumbies vs. Reds Jun 15 40 – 27 11.60 TRUE
6 Stormers vs. Sharks Jun 15 9 – 12 3.30 FALSE
7 Bulls vs. Lions Jun 15 48 – 27 1.80 TRUE


Predictions for the Quarter-finals

Here are the predictions for the Quarter-finals. The prediction is my estimated expected points difference with a positive margin being a win to the home team, and a negative margin a win to the away team.

Game Date Winner Prediction
1 Crusaders vs. Highlanders Jun 21 Crusaders 16.00
2 Jaguares vs. Chiefs Jun 21 Jaguares 3.80
3 Hurricanes vs. Bulls Jun 22 Hurricanes 11.50
4 Brumbies vs. Sharks Jun 22 Brumbies 6.20


NRL Predictions for Round 15

Team Ratings for Round 15

The basic method is described on my Department home page.
Here are the team ratings prior to this week’s games, along with the ratings at the start of the season.

Current Rating Rating at Season Start Difference
Storm 11.91 6.03 5.90
Roosters 6.56 8.72 -2.20
Raiders 5.63 1.81 3.80
Rabbitohs 3.97 3.89 0.10
Knights 0.73 -8.51 9.20
Sharks 0.51 3.90 -3.40
Broncos -1.14 2.63 -3.80
Eels -2.14 -6.17 4.00
Warriors -2.19 -0.27 -1.90
Cowboys -2.32 0.15 -2.50
Dragons -2.45 0.06 -2.50
Sea Eagles -2.81 -5.61 2.80
Panthers -3.43 0.93 -4.40
Titans -3.64 -3.36 -0.30
Wests Tigers -4.11 -5.57 1.50
Bulldogs -7.08 -0.61 -6.50


Performance So Far

So far there have been 108 matches played, 67 of which were correctly predicted, a success rate of 62%.
Here are the predictions for last week’s games.

Game Date Score Prediction Correct
1 Raiders vs. Sharks Jun 13 38 – 12 5.20 TRUE
2 Titans vs. Warriors Jun 14 20 – 24 4.20 FALSE
3 Cowboys vs. Wests Tigers Jun 14 26 – 27 5.70 FALSE
4 Storm vs. Knights Jun 15 34 – 4 11.60 TRUE
5 Rabbitohs vs. Panthers Jun 15 18 – 19 12.30 FALSE
6 Eels vs. Broncos Jun 15 38 – 10 -2.20 FALSE
7 Sea Eagles vs. Dragons Jun 16 22 – 20 2.70 TRUE
8 Roosters vs. Bulldogs Jun 16 34 – 14 16.10 TRUE


Predictions for Round 15

Here are the predictions for Round 15. The prediction is my estimated expected points difference with a positive margin being a win to the home team, and a negative margin a win to the away team.

Game Date Winner Prediction
1 Wests Tigers vs. Rabbitohs Jun 27 Rabbitohs -5.10
2 Dragons vs. Cowboys Jun 28 Dragons 2.90
3 Roosters vs. Storm Jun 28 Storm -2.30
4 Titans vs. Sea Eagles Jun 29 Titans 2.20
5 Knights vs. Broncos Jun 29 Knights 4.90
6 Eels vs. Raiders Jun 29 Raiders -4.80
7 Warriors vs. Panthers Jun 30 Warriors 5.70
8 Bulldogs vs. Sharks Jun 30 Sharks -4.60


June 13, 2019

Percentage not in care

From Newsroom, via Giovanni Tiso on Twitter

Oranga Tamariki chief executive Gráinne Moss defended her agency’s actions around uplifts to Parliament’s social services committee on Wednesday morning, saying 98.5 percent of Māori children were not in care.

First, that’s a really unnatural way to describe a small percent…

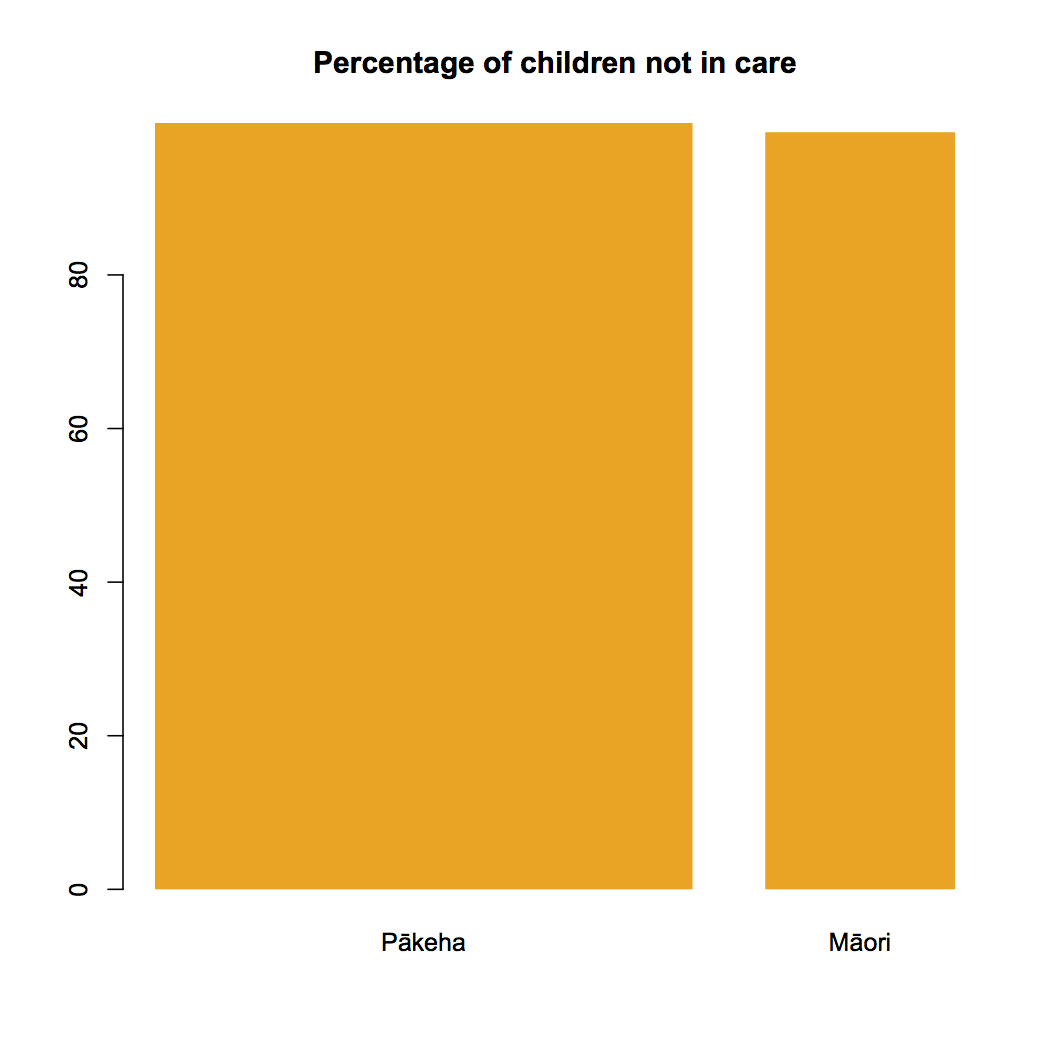
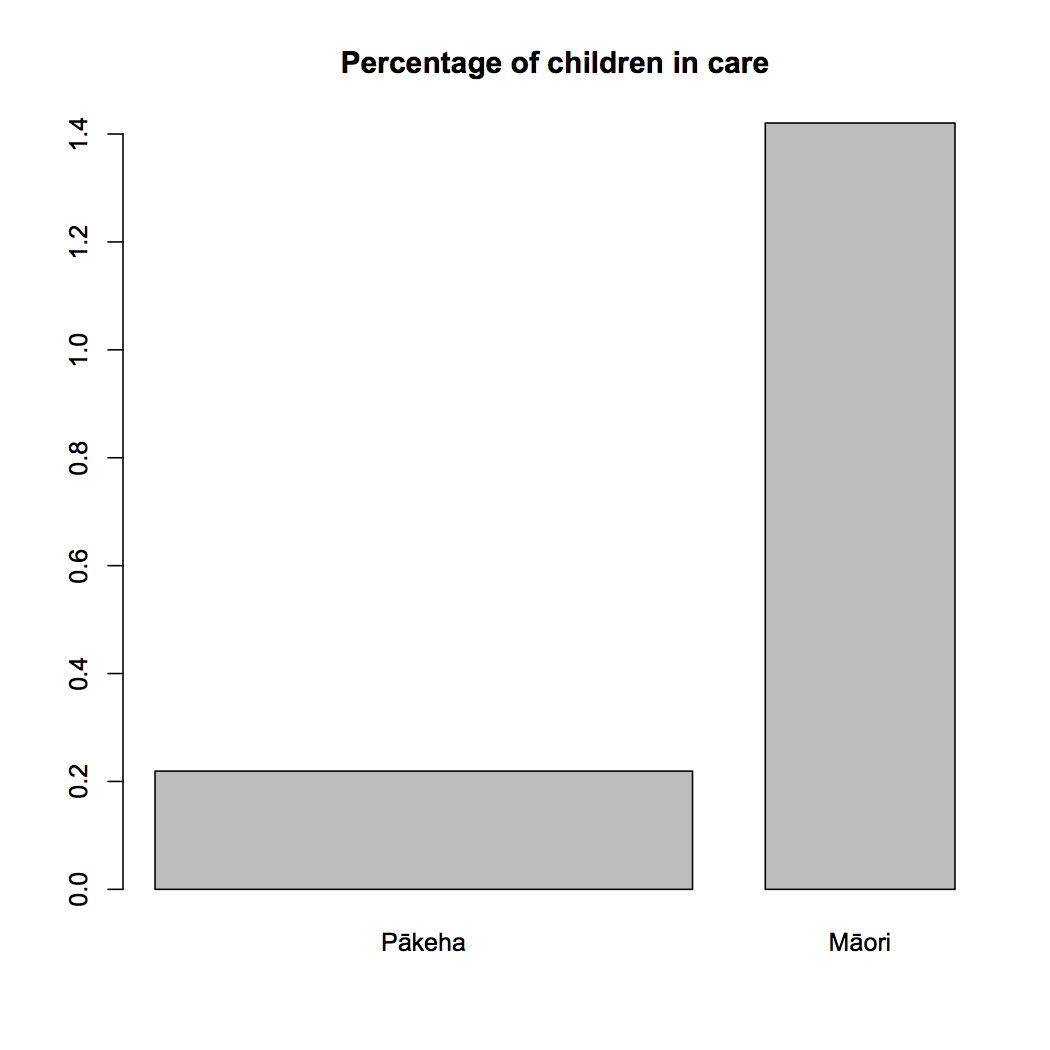
No, first, 1.5% is not a small percentage when you’re talking about proportion of “children and young people in the care of the Chief Executive”. It is, or should be, a shockingly large percentage.  I went and checked it against the June 2017 figures, the most recent I could find with an ethnicity breakdown: the spreadsheet said 3518 Māori, 1538 Pākehā.  Comparing that to 2013 census figures of about 270,000 children and young people reporting Māori ethnicity we get 1.3%, and the total number in care has gone up from 5708 in June 2017 to 6350 in the most recent annual report, so 1.5% is plausible.  Graeme Edgeler was similarly motivated to check.

Given that, though, describing the figure as 98.5% not in care rather than 1.5% in care is really unnatural.  While zero kids in care is unrealistically optimistic, it’s at least a meaningful reference point; zero kids not in care is a dystopian nightmare. It makes more sense to use the percentage in care if you’re trying to communicate accurately.

Here are two barplots:


Of course, these figures alone can’t answer questions about racism at Oranga Tamariki. Someone would need to talk to their staff, children in their care, families who have been separated from those children, and so on.  Newsroom has been doing that.


Update: I have been pointed to this OIA response, which gives numbers by ethnicity (for yet another different breakdown of ethnicities).  I had apportioned the increase since 2017 in proportion to the 2017 numbers, but it has mostly been an increase in tamariki Māori in the care of OT.  The graphs are basically right, but reality is slightly worse than they show.

June 11, 2019

Super Rugby Predictions for Round 18

Team Ratings for Round 18

The basic method is described on my Department home page.
Here are the team ratings prior to this week’s games, along with the ratings at the start of the season.

Current Rating Rating at Season Start Difference
Crusaders 17.24 17.67 -0.40
Hurricanes 9.02 9.43 -0.40
Jaguares 4.80 -0.26 5.10
Chiefs 3.17 8.56 -5.40
Highlanders 3.01 4.01 -1.00
Brumbies 2.36 0.00 2.40
Lions 1.55 8.28 -6.70
Sharks -0.10 0.45 -0.50
Bulls -0.15 -3.79 3.60
Stormers -0.33 -0.39 0.10
Blues -0.54 -3.42 2.90
Waratahs -0.72 2.00 -2.70
Rebels -5.02 -7.26 2.20
Reds -5.78 -8.19 2.40
Sunwolves -17.53 -16.08 -1.50


Performance So Far

So far there have been 112 matches played, 73 of which were correctly predicted, a success rate of 65.2%.
Here are the predictions for last week’s games.

Game Date Score Prediction Correct
1 Highlanders vs. Bulls Jun 07 24 – 24 8.10 FALSE
2 Reds vs. Blues Jun 07 29 – 28 -1.60 FALSE
3 Crusaders vs. Rebels Jun 08 66 – 0 20.80 TRUE
4 Waratahs vs. Brumbies Jun 08 24 – 35 2.00 FALSE
5 Lions vs. Hurricanes Jun 08 17 – 37 -1.20 TRUE
6 Stormers vs. Sunwolves Jun 08 31 – 18 22.30 TRUE
7 Jaguares vs. Sharks Jun 08 34 – 7 6.40 TRUE


Predictions for Round 18

Here are the predictions for Round 18. The prediction is my estimated expected points difference with a positive margin being a win to the home team, and a negative margin a win to the away team.

Game Date Winner Prediction
1 Highlanders vs. Waratahs Jun 14 Highlanders 7.70
2 Rebels vs. Chiefs Jun 14 Chiefs -4.20
3 Jaguares vs. Sunwolves Jun 14 Jaguares 26.30
4 Hurricanes vs. Blues Jun 15 Hurricanes 13.10
5 Brumbies vs. Reds Jun 15 Brumbies 11.60
6 Stormers vs. Sharks Jun 15 Stormers 3.30
7 Bulls vs. Lions Jun 15 Bulls 1.80


NRL Predictions for Round 14

Team Ratings for Round 14

The basic method is described on my Department home page.
Here are the team ratings prior to this week’s games, along with the ratings at the start of the season.

Current Rating Rating at Season Start Difference
Storm 10.62 6.03 4.60
Roosters 6.29 8.72 -2.40
Rabbitohs 4.90 3.89 1.00
Raiders 4.18 1.81 2.40
Knights 2.01 -8.51 10.50
Sharks 1.97 3.90 -1.90
Broncos 0.98 2.63 -1.60
Cowboys -1.85 0.15 -2.00
Dragons -2.50 0.06 -2.60
Sea Eagles -2.76 -5.61 2.80
Warriors -2.76 -0.27 -2.50
Titans -3.07 -3.36 0.30
Eels -4.25 -6.17 1.90
Panthers -4.36 0.93 -5.30
Wests Tigers -4.58 -5.57 1.00
Bulldogs -6.81 -0.61 -6.20


Performance So Far

So far there have been 100 matches played, 63 of which were correctly predicted, a success rate of 63%.
Here are the predictions for last week’s games.

Game Date Score Prediction Correct
1 Rabbitohs vs. Knights Jun 07 12 – 20 8.10 FALSE
2 Wests Tigers vs. Raiders Jun 07 0 – 28 -2.10 TRUE
3 Warriors vs. Storm Jun 08 10 – 32 -6.70 TRUE
4 Sharks vs. Eels Jun 08 42 – 22 7.50 TRUE
5 Cowboys vs. Sea Eagles Jun 08 20 – 22 4.90 FALSE
6 Broncos vs. Titans Jun 09 18 – 26 9.50 FALSE
7 Panthers vs. Roosters Jun 09 19 – 10 -10.40 FALSE
8 Bulldogs vs. Dragons Jun 10 12 – 36 2.40 FALSE


Predictions for Round 14

Here are the predictions for Round 14. The prediction is my estimated expected points difference with a positive margin being a win to the home team, and a negative margin a win to the away team.

Game Date Winner Prediction
1 Raiders vs. Sharks Jun 13 Raiders 5.20
2 Titans vs. Warriors Jun 14 Titans 4.20
3 Cowboys vs. Wests Tigers Jun 14 Cowboys 5.70
4 Storm vs. Knights Jun 15 Storm 11.60
5 Rabbitohs vs. Panthers Jun 15 Rabbitohs 12.30
6 Eels vs. Broncos Jun 15 Broncos -2.20
7 Sea Eagles vs. Dragons Jun 16 Sea Eagles 2.70
8 Roosters vs. Bulldogs Jun 16 Roosters 16.10


June 6, 2019

Trouble and strife

Q: Did you see that married people only pretend to be happier than single people?

A: Where’s that?

Q: Newshub. Or the USA, depending on what you’re asking.

A: Yeah nah

Q: “Married people are happier than other population subgroups, but only when their spouse is in the room when they’re asked how happy they are. When the spouse is not present: f**king miserable,” Dolan said while speaking at a book festival in Wales.

A: I’m not sure we’re allowed to say “f**king” on StatsChat.

Q: But the survey data are right?

A: Up to a point

Q: That means no, doesn’t it?

A: The survey data are right, but the question wasn’t anything like what he thought

Q: How do you get a simple question about happiness wrong?

A: The question about the spouse being in the room

Q: Ok, how do you get that wrong?

A: The question was about marital status and living arrangements, and it wasn’t about a particular point in time when happiness was being measured (or even from the same survey).  The possible values included “Never Married”, “Married – Spouse Present”, “Married -Spouse Absent”, “Divorced”, “Separated”.

Q: Wait, so married people are actually f**king miserable if they’re not living with their spouse? A long-distance relationship, or going through a bad patch or something?

A: Yes, only “f**king miserable” is a bit of an exaggeration.  They’re still happier than divorced or never married people.

Q: Well, that’s f**king unsatisfactory

A: Indeed.  After the problem was pointed out to him, Professor Dolan has withdrawn that part of his claim

Q: But not Newshub

A: No.

Briefly

  • Data is Personal. What We Learned from 42 Interviews in Rural America. at Medium (via Andrew Gelman)
  • Two posts on ways people display uncertainty in graphics (via Alberto Cairo)
  • From Casey Fiesler Scientists Like Me Are Studying Your Tweets—Are You OK With That?
  • Animated visualisation of what diseases were most studied over the past 70 years
  • Story from the Sydney Morning Herald about weather forecasting, including new 3-week weather outlook predictions that the Bureau of Meteorology is planning to produce
  • “Cancer drugs that speed onto the market based on encouraging preliminary studies often don’t show clear benefits when more careful follow-up trials are done,” from NPR
  • Pharmac’s top-20 expenditures from last year.  For anyone who wants to have an opinion on how Pharmac should spend its budget.
June 4, 2019

Super Rugby Predictions for Round 17

Team Ratings for Round 17

The basic method is described on my Department home page.
Here are the team ratings prior to this week’s games, along with the ratings at the start of the season.

Current Rating Rating at Season Start Difference
Crusaders 14.53 17.67 -3.10
Hurricanes 7.90 9.43 -1.50
Jaguares 3.56 -0.26 3.80
Highlanders 3.49 4.01 -0.50
Chiefs 3.17 8.56 -5.40
Lions 2.68 8.28 -5.60
Brumbies 1.58 0.00 1.60
Sharks 1.14 0.45 0.70
Stormers 0.23 -0.39 0.60
Waratahs 0.06 2.00 -1.90
Blues -0.38 -3.42 3.00
Bulls -0.63 -3.79 3.20
Rebels -2.31 -7.26 4.90
Reds -5.94 -8.19 2.20
Sunwolves -18.08 -16.08 -2.00


Performance So Far

So far there have been 105 matches played, 69 of which were correctly predicted, a success rate of 65.7%.
Here are the predictions for last week’s games.

Game Date Score Prediction Correct
1 Blues vs. Bulls May 31 22 – 22 4.80 FALSE
2 Rebels vs. Waratahs May 31 15 – 20 2.00 FALSE
3 Sunwolves vs. Brumbies Jun 01 19 – 42 -14.70 TRUE
4 Chiefs vs. Crusaders Jun 01 40 – 27 -14.70 FALSE
5 Reds vs. Jaguares Jun 01 23 – 34 -4.80 TRUE
6 Sharks vs. Hurricanes Jun 01 17 – 30 -1.40 TRUE
7 Lions vs. Stormers Jun 01 41 – 22 4.20 TRUE


Predictions for Round 17

Here are the predictions for Round 17. The prediction is my estimated expected points difference with a positive margin being a win to the home team, and a negative margin a win to the away team.

Game Date Winner Prediction
1 Highlanders vs. Bulls Jun 07 Highlanders 8.10
2 Reds vs. Blues Jun 07 Blues -1.60
3 Crusaders vs. Rebels Jun 08 Crusaders 20.80
4 Waratahs vs. Brumbies Jun 08 Waratahs 2.00
5 Lions vs. Hurricanes Jun 08 Hurricanes -1.20
6 Stormers vs. Sunwolves Jun 08 Stormers 22.30
7 Jaguares vs. Sharks Jun 08 Jaguares 6.40