Posts from May 2019 (27)

May 7, 2019

NRL Predictions for Round 9

Team Ratings for Round 9

The basic method is described on my Department home page.
Here are the team ratings prior to this week’s games, along with the ratings at the start of the season.


Current Rating Rating at Season Start Difference
Roosters 11.00 8.72 2.30
Rabbitohs 6.54 3.89 2.70
Storm 6.42 6.03 0.40
Raiders 3.81 1.81 2.00
Sharks 1.30 3.90 -2.60
Dragons 0.09 0.06 0.00
Broncos 0.03 2.63 -2.60
Eels -0.56 -6.17 5.60
Sea Eagles -1.62 -5.61 4.00
Cowboys -2.30 0.15 -2.50
Panthers -3.21 0.93 -4.10
Warriors -3.50 -0.27 -3.20
Bulldogs -3.98 -0.61 -3.40
Titans -5.22 -3.36 -1.90
Knights -5.24 -8.51 3.30
Wests Tigers -5.53 -5.57 0.00


Performance So Far

So far there have been 64 matches played, 47 of which were correctly predicted, a success rate of 73.4%.
Here are the predictions for last week’s games.


Game Date Score Prediction Correct
1 Rabbitohs vs. Broncos May 02 38 – 6 5.80 TRUE
2 Cowboys vs. Titans May 03 28 – 14 4.60 TRUE
3 Sharks vs. Storm May 03 20 – 18 -2.80 FALSE
4 Raiders vs. Panthers May 04 30 – 12 8.70 TRUE
5 Sea Eagles vs. Bulldogs May 04 18 – 10 4.90 TRUE
6 Roosters vs. Wests Tigers May 04 42 – 12 17.80 TRUE
7 Warriors vs. Knights May 05 18 – 36 10.20 FALSE
8 Eels vs. Dragons May 05 32 – 18 0.50 TRUE


Predictions for Round 9

Here are the predictions for Round 9. The prediction is my estimated expected points difference with a positive margin being a win to the home team, and a negative margin a win to the away team.


Game Date Winner Prediction
1 Titans vs. Sharks May 09 Sharks -3.50
2 Wests Tigers vs. Panthers May 10 Wests Tigers 0.70
3 Sea Eagles vs. Broncos May 10 Sea Eagles 1.40
4 Bulldogs vs. Knights May 11 Bulldogs 4.30
5 Warriors vs. Dragons May 11 Warriors 0.90
6 Storm vs. Eels May 11 Storm 10.00
7 Roosters vs. Raiders May 12 Roosters 10.20
8 Rabbitohs vs. Cowboys May 12 Rabbitohs 11.80


Pro14 Predictions for the Semi-finals

Team Ratings for the Semi-finals

The basic method is described on my Department home page.
Here are the team ratings prior to this week’s games, along with the ratings at the start of the season.

Current Rating Rating at Season Start Difference
Munster 9.89 8.08 1.80
Leinster 9.40 9.80 -0.40
Glasgow Warriors 9.16 8.55 0.60
Connacht 2.67 0.01 2.70
Scarlets 2.67 6.39 -3.70
Ulster 2.43 2.07 0.40
Ospreys 1.47 -0.86 2.30
Edinburgh 1.20 -0.64 1.80
Cardiff Blues 0.25 0.24 0.00
Treviso 0.21 -5.19 5.40
Cheetahs -1.42 -0.83 -0.60
Dragons -9.57 -8.59 -1.00
Southern Kings -12.62 -7.91 -4.70
Zebre -15.18 -10.57 -4.60


Performance So Far

So far there have been 149 matches played, 113 of which were correctly predicted, a success rate of 75.8%.
Here are the predictions for last week’s games.

Game Date Score Prediction Correct
1 Munster vs. Treviso May 05 15 – 13 15.30 TRUE
2 Ulster vs. Connacht May 05 21 – 13 3.50 TRUE


Predictions for the Semi-finals

Here are the predictions for the Semi-finals. The prediction is my estimated expected points difference with a positive margin being a win to the home team, and a negative margin a win to the away team.

Game Date Winner Prediction
1 Glasgow Warriors vs. Ulster May 18 Glasgow Warriors 11.20
2 Leinster vs. Munster May 19 Leinster 4.00


May 6, 2019

From the Telegraph

Sportswomen should go on the pill to avoid career-ending injuries, the authors of a groundbreaking study have suggested.

Analysis of more than 165,000 female athletes in the US found those taking the oral contraceptive were significantly less likely to suffer knee injuries.

There’s a few problems with this as a summary of the research(press release)  The study didn’t measure knee injuries — it measured ACL surgeries. More importantly, it wasn’t of female athletes, but of any women aged 15 to 49 in a big medical-records database who weren’t pregnant and didn’t have a known connective tissue disorder — the study didn’t have any data at all on physical activity. Also, ‘groundbreaking’ seems a bit much given that the research paper talks about previous studies with similar results, as well as biochemical reasons that there might be a relationship.

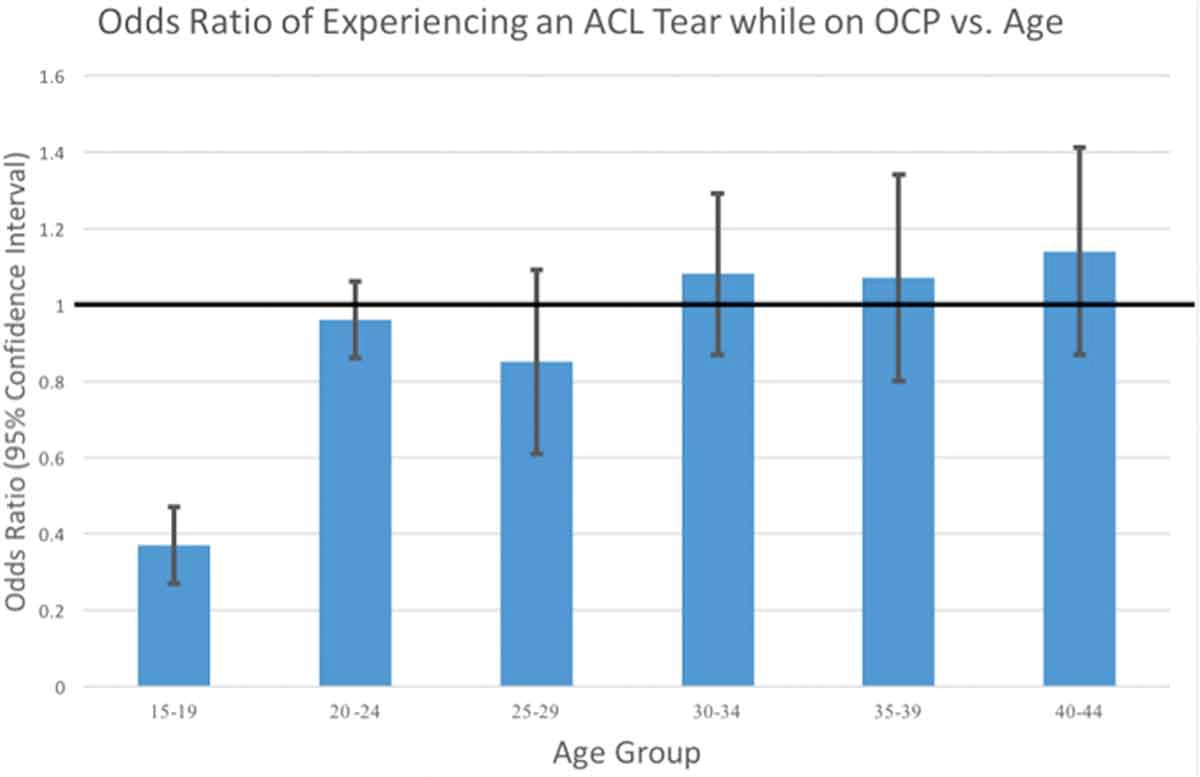
Perhaps the most problematic aspect of the Telegraph story, though is how it relates to this graph from the research paper. Basically the whole association is driven by the 15-19 age group.

This is obviously an important research question in sports medicine, and of public interest, but that makes it more important to get things right. The Guardian and the Miami Herald did a lot better at describing who was studied and the limitations of the results — such as not assessing physical activity at all.


May 3, 2019

Real estate and non-resident investors

Stats New Zealand have released the first full quarter of real-estate transfer data since the introduction of restrictions on purchases by non-residents (except for Australians and Singaporeans).

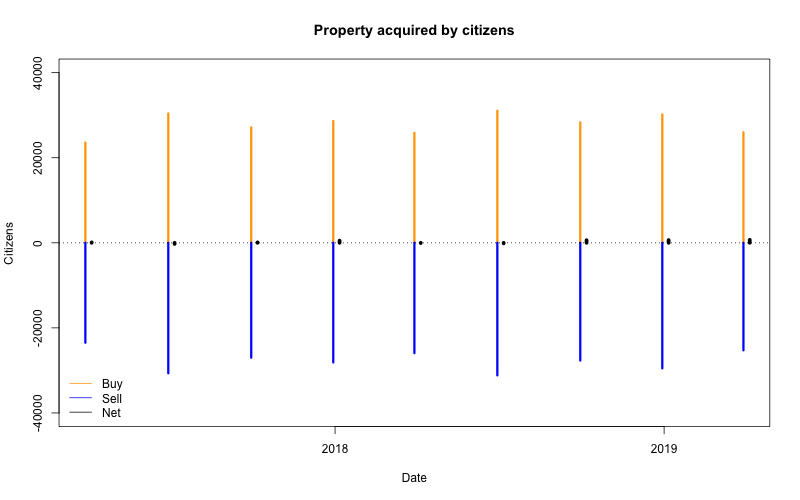
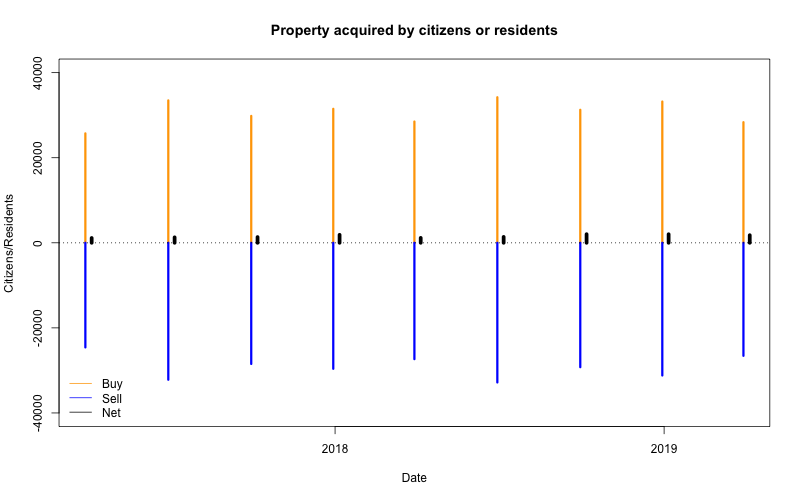
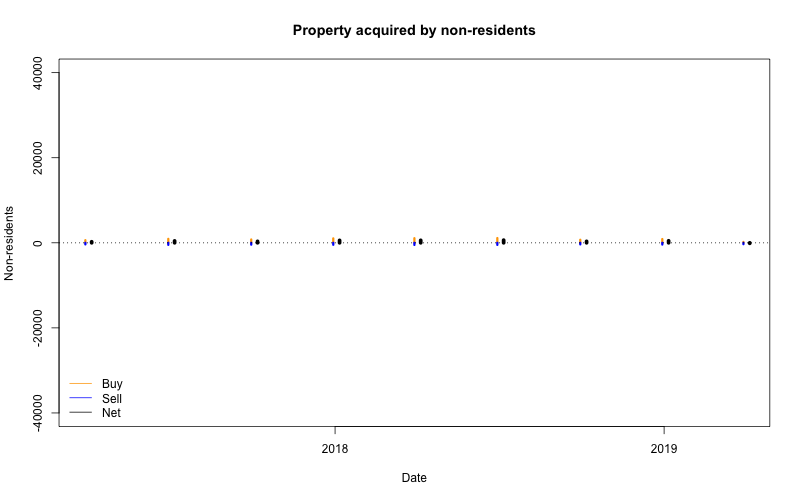
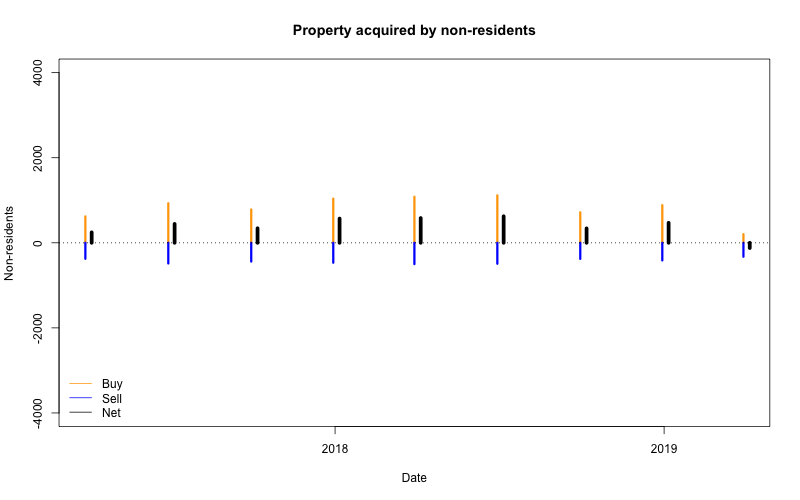
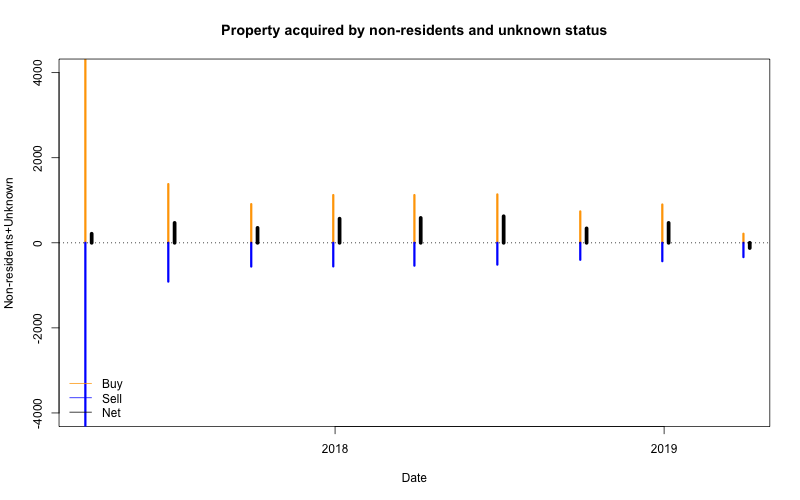
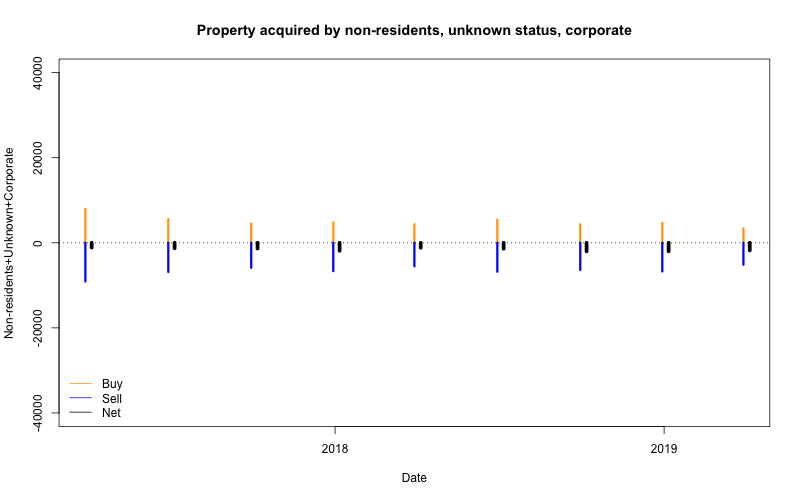
There are few stories talking about the fall in sales.  The data include residence information on the seller as well as the buyer, so I made some graphs showing how the net transfers have changed over time.  In all these graphs, the orange line is the number of buyers in the group, the blue line is the number of sellers, and the black line is the difference: the flow of real estate towards the group

First, citizens.

Now citizens or people with residence visas. There’s almost perfect cancellation, but a slight flow of properties towards people identified as citizens or residents — not only this quarter, but for the whole time range.

 On this scale, non-residents are basically invisible  Zooming in by a factor of ten, the net acquisition by non-residents was positive until this quarter, but roughly half the gross numbers that were usually quoted. This quarter it was negative.

 Some buyers or sellers had unknown residence status, though the numbers fell markedly after the start of 2018. Adding these to the non-residents doesn’t make a big difference.

Residence isn’t well-defined for corporate buyers — you could be overseas and own an NZ trust.  Some people add all this group to the ‘non-residents’.  We now have to zoom back out to the original scale. Interestingly, the net transfer here is negative — if you’re the sort of person who thinks overseas ownership is bad, treating all corporate ownership as foreign isn’t any sort of conservative or ‘worst-case’ analysis. 


May 2, 2019

Something in the water

Yesterday, the Police released the first data from the expanded program of wastewater drug testing they have been doing with ESR (more detail).  There’s a report at Stuff (from the Dominion Post).

The data are estimated total consumption of various drugs by the people using various parts of the sewer system in New Zealand.  There’s obviously quite a bit of uncertainty, but it’s probably a useful guide.  Because they’re measuring metabolites, not the original drugs, they are less likely to be misled by drugs discarded without being consumed — but they are probably more sensitive to differences in metabolism between people.  The analogue for tobacco and alcohol is the data on total amount sold, which is a widely used statistic because it’s thought to be more accurate than self-report.

The headline figure is an estimated 16kg of methamphetamine used per week. So, how does this compare to other estimates?  The story at Stuff has part of the calculation, showing about 1000 mg per day per 1000 people in the highest-testing areas, and a national average of about 600 mg/day/1000 people.  If NZ survey-based statistics are accurate, perhaps 2 people per 1000 will be regular users, so we’d be looking at 300mg/user/day. That’s a lot, but it’s within the range that Erowid lists for chronic users.  So, probably the surveys are underestimating the number of users, but not by a factor of ten or anything like that.

As Russell Brown says in his analysis of the report (which you should definitely read), one of the important findings is that total meth use seems to be pretty constant day to day, unlike MDMA use, which peaks at the weekend.  That’s consistent with a subset of regular users taking it daily or most days.  One of the limitations of wastewater testing is that the social impact of a drug doesn’t just depend on the total community consumption, but combining the wastewater data with other data is helpful.

The comparison of fentanyl to the other drugs is confounded with the higher potency of fentanyl — something it’s unusual for the media to gloss over.  If we go by the therapeutic dose of fentanyl for post-operative pain, 50-100 micrograms, there are about as many doses in the 3g of fentanyl reported per week as in the 4kg of MDMA.  On the other hand, the 3g does include prescription use, and people who were dependent on the drug would likely take higher doses and multiple doses per day.

May 1, 2019

Probably Baseless Ranking Frenzy

Yesterday, the government released results from the 2018 PBRF round.  PBRF is designed to allocate research funding to tertiary institutions.  The idea is to do this in a way that more money goes to institutions that do more research, both so that the status quo is upheld in the short term, and so that institutions such as AUT can make progress and get a larger share in the medium term. There’s also a goal of providing coarsely-grained feedback to institutions on where their research has been most successful. You could disagree with the goals and argue that all funding should be based on competitive grant proposals, or that there should be more research funding given to institutions that involve under-represented groups in research, or that people who don’t get good research scores should be fired, or whatever, but I think PBRF does reasonably well at achieving the goals it has.

An unfortunate side-effect of PBRF is that the government produces a fairly large set of numbers about the tertiary institutions.  Given a large set of numbers about a small number of institutions, there’s a very high chance that you can find a somewhat sensible summary of those numbers that puts you on top.  This is a game everyone can play. And does.

You don’t even need to go past the TEC information release. As Radio NZ says

The report said Victoria University had the highest score (29.19) for the number and quality of active researchers on its teaching and research staff, followed by Otago (26.09) and Canterbury (25.92) universities.

However, Lincoln University had the highest score for active researchers compared to the number of students enrolled in courses at degree level and higher (2.14), followed by Otago (2.06), and Catholic theological institute the Good Shepherd College (2.00).

The results showed the largest university, Auckland, had 1744 FTE staff funded by the PBRF and 391 or 22 percent were classified as A grade or world-class, the highest proportion of any university.

At Victoria University 20 percent or 173 of 865 funded-researchers received As, while at the University of Otago the figure was 17 percent or 229 out of 1358 researchers.

Moving further out, AUT has the fastest relative increase in funded researchers; Massey has a 40% increase in those at the top level; and Universities New Zealand astonishes everyone by pointing out universities did a lot more research than polytechs and wānanga.

The problem with these rankings …. the two problems with these rankings…. among the problems with these rankings are the fineness of the distinctions needed (well below the precision of the measurement process), the way everyone suggests the ranking they do best on is most important, and the effort wasted on tuning the system to target particular rankings.  Perhaps most importantly, though, there’s a corrosive effect of university leaders pretending that something is important and quantitatively well-founded when they know it isn’t, or at best, know they don’t have good evidence that it is.

Fred Vultee, an academic and former editor has written about an analogous problem for newspapers

It’s a free country, and Congress shall make no law abridging, &c &c &c, so you’re perfectly entitled to do whatever you want with your “analysis” time and your frontpage space. In some cosmic sense, sharing popular delusions about the lottery isn’t any worse than publishing the horoscopes. But if you’d like to be taken seriously when you proclaim “study says” or “poll reveals,” you need to run a disclaimer with your “want to hit the lottery” tales

Briefly

  • A good use of computerisation in criminal justice: efficiently expunging non-violent cannabis-related convictions in California
  • Missing Numbers is a blog about the data that the government should collect and measure in the UK, but doesn’t.
  • 3-D visualisation of flight patterns around major airports
  • “While AI can be an incredibly useful tool, we should proceed with caution until machines achieve a sufficiently nuanced understanding of human values that they do not become obsessed with constructing an armed compound on their own private island.From America’s Finest News Source
  • Beautiful visualisation about migrants in Brussels (one of the few places with a greater proportion of people born outside the country than Auckland)
  • The power of effective (and, arguably, misleading) maps