Posts from February 2019 (17)

February 26, 2019

Super Rugby Predictions for Round 3

Team Ratings for Round 3

The basic method is described on my Department home page.
Here are the team ratings prior to this week’s games, along with the ratings at the start of the season.

Current Rating Rating at Season Start Difference
Crusaders 17.04 17.67 -0.60
Hurricanes 8.98 9.43 -0.40
Lions 7.97 8.28 -0.30
Chiefs 5.38 8.56 -3.20
Highlanders 3.96 4.01 -0.00
Sharks 2.44 0.45 2.00
Brumbies 1.45 0.00 1.40
Waratahs 1.27 2.00 -0.70
Jaguares 0.07 -0.26 0.30
Stormers -2.03 -0.39 -1.60
Bulls -2.18 -3.79 1.60
Blues -3.13 -3.42 0.30
Rebels -6.19 -7.26 1.10
Reds -7.48 -8.19 0.70
Sunwolves -16.55 -16.08 -0.50


Performance So Far

So far there have been 14 matches played, 10 of which were correctly predicted, a success rate of 71.4%.
Here are the predictions for last week’s games.

Game Date Score Prediction Correct
1 Highlanders vs. Reds Feb 22 36 – 31 16.90 TRUE
2 Sunwolves vs. Waratahs Feb 23 30 – 31 -15.60 TRUE
3 Crusaders vs. Hurricanes Feb 23 38 – 22 11.00 TRUE
4 Brumbies vs. Chiefs Feb 23 54 – 17 -5.00 FALSE
5 Sharks vs. Blues Feb 23 26 – 7 8.30 TRUE
6 Stormers vs. Lions Feb 23 19 – 17 -7.70 FALSE
7 Jaguares vs. Bulls Feb 23 27 – 12 5.00 TRUE


Predictions for Round 3

Here are the predictions for Round 3. The prediction is my estimated expected points difference with a positive margin being a win to the home team, and a negative margin a win to the away team.

Game Date Winner Prediction
1 Hurricanes vs. Brumbies Mar 01 Hurricanes 11.50
2 Rebels vs. Highlanders Mar 01 Highlanders -6.20
3 Chiefs vs. Sunwolves Mar 02 Chiefs 25.90
4 Reds vs. Crusaders Mar 02 Crusaders -20.50
5 Lions vs. Bulls Mar 02 Lions 13.60
6 Sharks vs. Stormers Mar 02 Sharks 8.00
7 Jaguares vs. Blues Mar 02 Jaguares 7.20


Rugby Premiership Predictions for Round 15

Team Ratings for Round 15

The basic method is described on my Department home page.
Here are the team ratings prior to this week’s games, along with the ratings at the start of the season.

Current Rating Rating at Season Start Difference
Saracens 10.94 11.19 -0.30
Exeter Chiefs 10.07 11.13 -1.10
Northampton Saints 4.59 3.42 1.20
Wasps 3.61 8.30 -4.70
Gloucester Rugby 3.41 1.23 2.20
Harlequins 3.06 2.05 1.00
Bath Rugby 2.79 3.11 -0.30
Leicester Tigers 2.40 6.26 -3.90
Sale Sharks 1.18 -0.81 2.00
Worcester Warriors -2.58 -5.18 2.60
Bristol -3.72 -5.60 1.90
Newcastle Falcons -4.16 -3.51 -0.60


Performance So Far

So far there have been 84 matches played, 60 of which were correctly predicted, a success rate of 71.4%.
Here are the predictions for last week’s games.

Game Date Score Prediction Correct
1 Exeter Chiefs vs. Newcastle Falcons Feb 23 35 – 17 20.10 TRUE
2 Gloucester Rugby vs. Saracens Feb 23 30 – 24 -3.00 FALSE
3 Harlequins vs. Bristol Feb 23 36 – 26 12.80 TRUE
4 Northampton Saints vs. Bath Rugby Feb 23 27 – 26 8.10 TRUE
5 Wasps vs. Sale Sharks Feb 23 18 – 24 9.30 FALSE
6 Worcester Warriors vs. Leicester Tigers Feb 23 17 – 13 -0.20 FALSE


Predictions for Round 15

Here are the predictions for Round 15. The prediction is my estimated expected points difference with a positive margin being a win to the home team, and a negative margin a win to the away team.

Game Date Winner Prediction
1 Bath Rugby vs. Harlequins Mar 02 Bath Rugby 5.20
2 Bristol vs. Gloucester Rugby Mar 02 Gloucester Rugby -1.60
3 Leicester Tigers vs. Wasps Mar 02 Leicester Tigers 4.30
4 Newcastle Falcons vs. Worcester Warriors Mar 02 Newcastle Falcons 3.90
5 Sale Sharks vs. Exeter Chiefs Mar 02 Exeter Chiefs -3.40
6 Saracens vs. Northampton Saints Mar 02 Saracens 11.90


Pro14 Predictions for Round 17

Team Ratings for Round 17

The basic method is described on my Department home page.
Here are the team ratings prior to this week’s games, along with the ratings at the start of the season.

Current Rating Rating at Season Start Difference
Leinster 12.70 9.80 2.90
Munster 10.63 8.08 2.60
Glasgow Warriors 8.10 8.55 -0.40
Scarlets 3.25 6.39 -3.10
Connacht 1.95 0.01 1.90
Cardiff Blues 0.96 0.24 0.70
Ulster 0.90 2.07 -1.20
Ospreys 0.65 -0.86 1.50
Edinburgh -0.01 -0.64 0.60
Treviso -0.93 -5.19 4.30
Cheetahs -2.41 -0.83 -1.60
Dragons -9.63 -8.59 -1.00
Southern Kings -11.13 -7.91 -3.20
Zebre -14.48 -10.57 -3.90


Performance So Far

So far there have been 112 matches played, 88 of which were correctly predicted, a success rate of 78.6%.
Here are the predictions for last week’s games.

Game Date Score Prediction Correct
1 Glasgow Warriors vs. Connacht Feb 23 43 – 17 9.30 TRUE
2 Ospreys vs. Munster Feb 23 13 – 19 -5.40 TRUE
3 Leinster vs. Southern Kings Feb 23 59 – 19 27.30 TRUE
4 Treviso vs. Dragons Feb 24 57 – 7 10.70 TRUE
5 Edinburgh vs. Cardiff Blues Feb 24 17 – 19 4.60 FALSE
6 Ulster vs. Zebre Feb 24 54 – 7 17.90 TRUE
7 Scarlets vs. Cheetahs Feb 25 43 – 21 9.10 TRUE


Predictions for Round 17

Here are the predictions for Round 17. The prediction is my estimated expected points difference with a positive margin being a win to the home team, and a negative margin a win to the away team.

Game Date Winner Prediction
1 Leinster vs. Cheetahs Mar 02 Leinster 19.60
2 Connacht vs. Ospreys Mar 03 Connacht 5.80
3 Treviso vs. Edinburgh Mar 03 Treviso 3.60
4 Scarlets vs. Munster Mar 03 Munster -2.90
5 Zebre vs. Glasgow Warriors Mar 03 Glasgow Warriors -18.10
6 Cardiff Blues vs. Southern Kings Mar 03 Cardiff Blues 16.60
7 Dragons vs. Ulster Mar 04 Ulster -6.00


February 25, 2019

How many crashes are caused by alcohol?

Back in June, the AA put out a press release claiming that road deaths caused by (illegal) drugs now exceeded those caused by alcohol.  As I wrote at the time, (a) this was largely an artefact of increased testing, and (b) it’s a dodgy definition of ’cause’.

Roger Brooking, a drug and alcohol counsellor, has recently been pointing out that the definition of ’cause’ wasn’t comparable between alcohol and illegal drugs.  He’s right. Unfortunately, I think he wants the definitions changed in the wrong way.

The definition of ’caused by alcohol’ was ‘blood alcohol over the legal limit’, and the definition for illegal drugs was ‘detectable amount’.  There’s a sense in which these are comparable — they both indicate that violations of the law have occurred — but that’s not a useful sense if we’re talking about attributing risk.

Roger Brooking’s suggestion is to set both definitions at ‘any detectable’, and to set the legal alcohol limit for drivers to zero, and to do a lot more testing. I’m one of the minority of New Zealanders who wouldn’t be directly affected by any of these changes, but I still think it’s a terrible idea.

Focusing on statistical questions, though, describing as ’caused by’ drugs or alcohol all road deaths where the driver had detectable amounts in their blood is unambiguously wrong.  If you have alcohol in your system, your risk of being in a crash increases. It increases a moderate amount for moderate levels of alcohol, and by a lot for high levels of alcohol.  At very low levels the direct evidence is limited, but your risk probably increases a little bit. And with no alcohol or drugs in your system, the risk isn’t zero.  We know that from common sense, but also because some drivers do have crashes and tests don’t show any alcohol or drugs.

So, how much? The most recent research cited by a WHO report (PDF) is from the US, carried out in the late 1990s (PDF). The researchers monitored crashes in two US cities, and a week after each crash picked two random drivers at the time and place of the crash to measure their blood alcohol.  After adjusting for differences in, eg, age and adjusting for refusal to participate, they have estimates of the increase in risk for a range of blood alcohol concentrations. It’s worth noting that these are estimates rather than definitive truth, and that they are higher than previous estimates.    At 0.03% blood alcohol the estimated risk is 1.06 times higher; at 0.05% it’s 1.38 times higher; at 0.08% it’s 2.69 times higher; at 0.10% it’s 3.79 times higher.

That is, at 0.03% blood alcohol the estimate is 100 crashes that would have happened with no alcohol for every 6 influenced by alcohol. At 0.05% it’s 100 crashes that would have happened with no alcohol for every 38 influenced by alcohol. At 0.08%, it’s 100 crashes that would have happened with no alcohol for every 169 influenced by alcohol.  By the time you get to 0.10%, about three-quarters of the crashes are caused by alcohol, and at 0.15%, with a relative rate of 22 it’s damn near all of them. But at the legal limit it’s about a third, and at lower blood alcohol concentrations it’s a small fraction. If there were 80 fatal crashes where the driver had a blood alcohol above zero but below the legal limit, most of those crashes were not caused by alcohol in either a usual or a technical meaning of the word ’cause’.

Given the way risk decreases at lower levels of exposure to drugs, how should the numbers be reported? It makes sense to report both alcohol >0 and alcohol > legal limit. If there were consensus on the excess risk relationship it would be helpful to report crashes attributable to alcohol, taking the risk relationship into account.  It’s hard to do that for other drugs, though.  We’ve got very little empirical data relating forensic measures to risk for other drugs, and in some cases (eg cannabis) we know that the easily measurable concentration doesn’t pick up impairment well.  On top of that, use of multiple drugs is probably a substantial component of the problem.   It’s a good idea to increase measurements after serious crashes (to gather data). It’s a good idea to report alcohol + other drugs separately from alcohol alone and other drugs alone. And in the absence of any better criteria it’s probably unavoidable to just report any detectable level of other drugs, but we should resist (as ESR, notably, does) the temptation to call those crashes ’caused by’ the drug.
February 19, 2019

Summer polling?

From RadioNZ this morning, Ben Thomas on the latest polling results

I think there’s a bit of a caution. Both of these polls came very shortly after the summer break, and when you look at polls over a year, the government of the day does best when people feel best about themselves. When do people feel best about themselves? Well, it’s when they’re on holiday, when they’re looking at barbeques… when the sun is shining.

That’s certainly reasonable. You could also think of other regions summer might be different, too. For example, with schools on holiday, you might get a different range of people being at home and answering the phone. In any case I wanted to see how much it shows up in the published opinion polls.

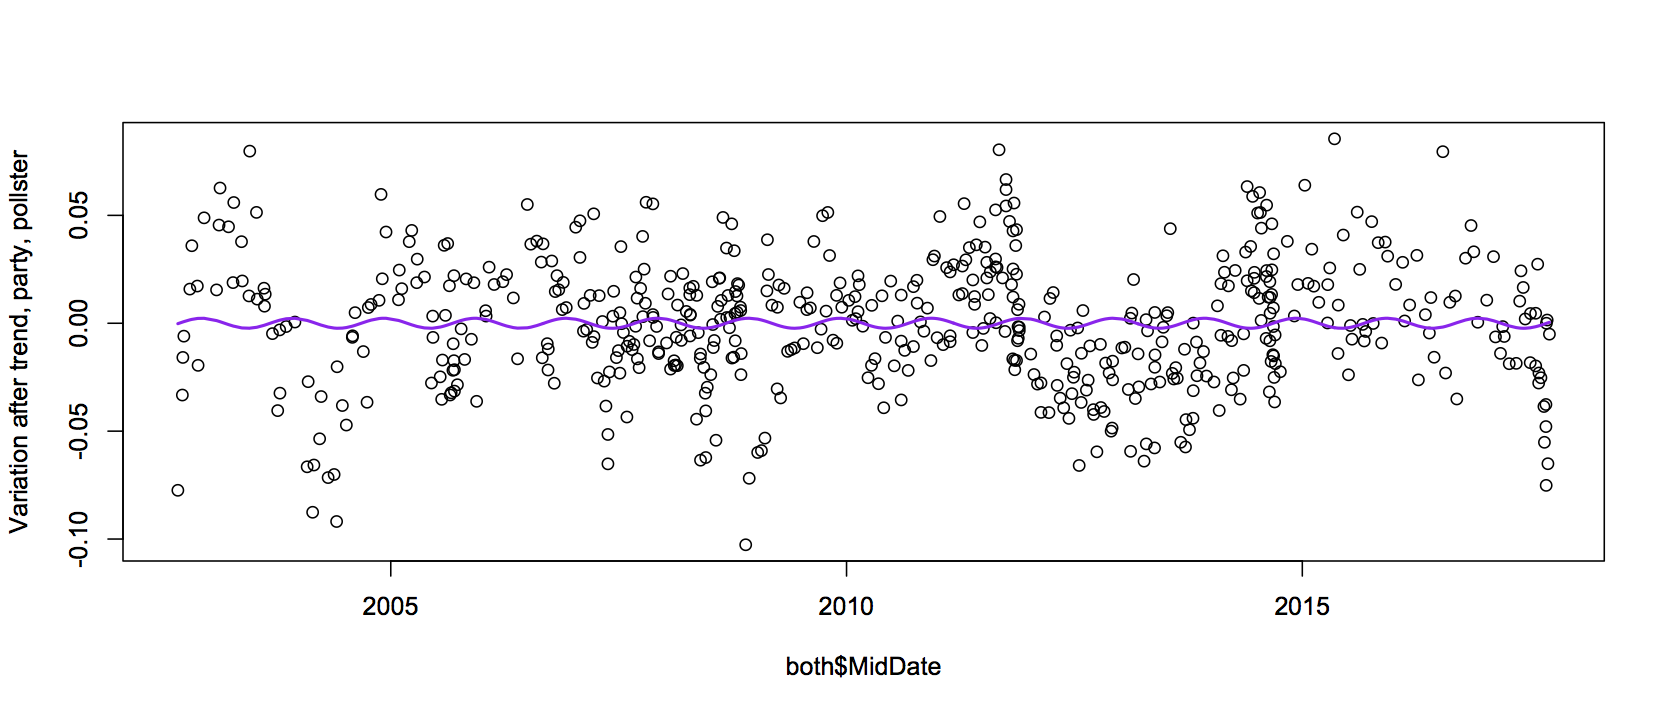
Peter Ellis has collected polling data from September 2002 right through to the last election, so I used that. Now, popularity of the government of the day has varied over this time, so I subtracted off a party difference, differences between polling companies, and a long-term time trend. Here’s the left-over variation when the long-term trend was averaged over about 5 years

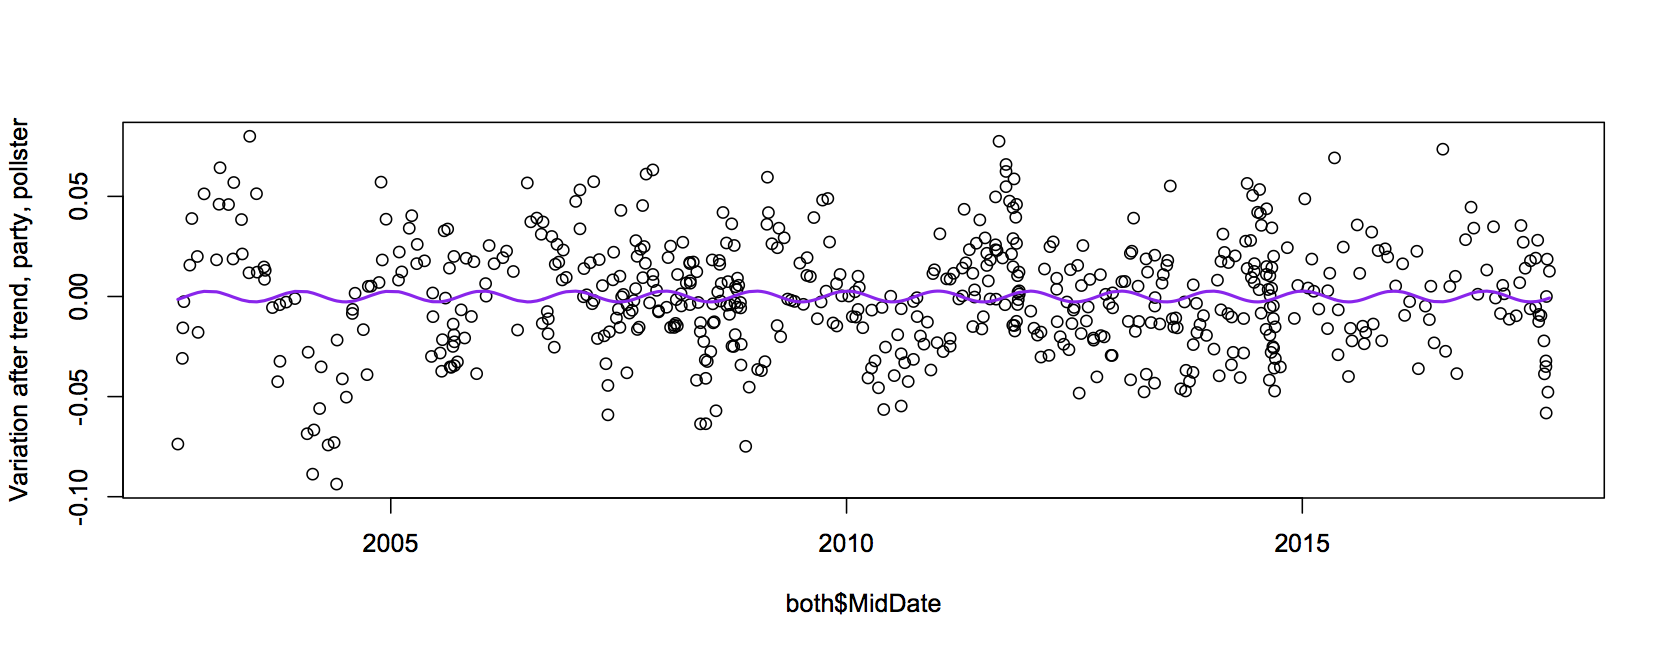
and here’s when the long-term trend was over more like one year

The purple line estimates the seasonal variation, from a linear regression model.  Polls do seem more favorable to the incumbent during summer, but it’s a very small effect. The summer to winter difference is about half a percentage point, and there’s only fairly weak evidence that it’s in that direction rather than some other direction.

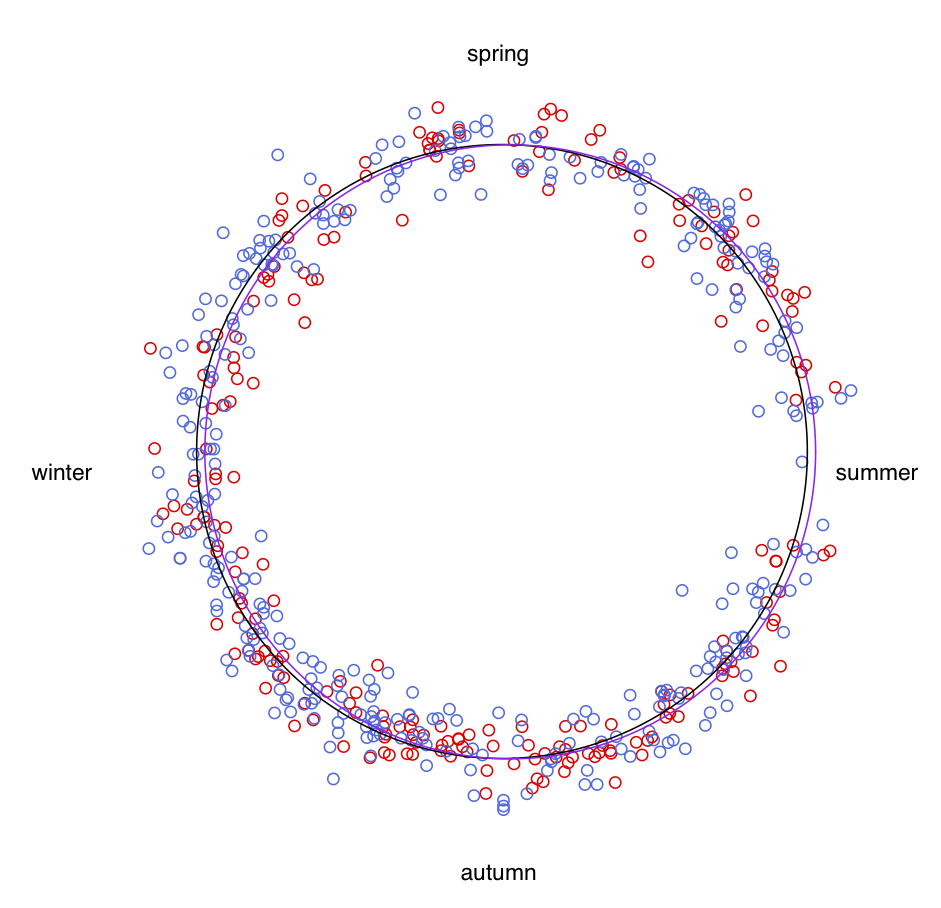
Here’s the same information, but wrapped around a yearly circle, with the points coloured according to whether Labour or National was in government at the time.  The black line is a circle corresponding to zero on the graphs above; the purple line shows the seasonal difference. If you look closely, you can see the purple sticks out to the sides more than the black: summer is more positive, winter is more negative. The labels are at January 1 for summer and then regularly spaced through the year.

What you do see clearly in this format is that people don’t do many polls around the new year. But the seasonal difference in results (for party intention, in publicly-released opinion polls) seems pretty small.


Super Rugby Predictions for Round 2

Team Ratings for Round 2

The basic method is described on my Department home page.
Here are the team ratings prior to this week’s games, along with the ratings at the start of the season.

Current Rating Rating at Season Start Difference
Crusaders 16.73 17.67 -0.90
Hurricanes 9.28 9.43 -0.10
Lions 8.55 8.28 0.30
Chiefs 7.89 8.56 -0.70
Highlanders 4.67 4.01 0.70
Waratahs 2.15 2.00 0.10
Sharks 1.80 0.45 1.40
Jaguares -0.53 -0.26 -0.30
Brumbies -1.06 0.00 -1.10
Bulls -1.58 -3.79 2.20
Blues -2.48 -3.42 0.90
Stormers -2.61 -0.39 -2.20
Rebels -6.19 -7.26 1.10
Reds -8.19 -8.19 -0.00
Sunwolves -17.43 -16.08 -1.40


Performance So Far

So far there have been 7 matches played, 5 of which were correctly predicted, a success rate of 71.4%.
Here are the predictions for last week’s games.

Game Date Score Prediction Correct
1 Chiefs vs. Highlanders Feb 15 27 – 30 8.00 FALSE
2 Brumbies vs. Rebels Feb 15 27 – 34 10.80 FALSE
3 Blues vs. Crusaders Feb 16 22 – 24 -17.60 TRUE
4 Waratahs vs. Hurricanes Feb 16 19 – 20 -3.40 TRUE
5 Sunwolves vs. Sharks Feb 16 10 – 45 -12.50 TRUE
6 Bulls vs. Stormers Feb 16 40 – 3 0.10 TRUE
7 Jaguares vs. Lions Feb 16 16 – 25 -4.50 TRUE


Predictions for Round 2

Here are the predictions for Round 2. The prediction is my estimated expected points difference with a positive margin being a win to the home team, and a negative margin a win to the away team.

Game Date Winner Prediction
1 Highlanders vs. Reds Feb 22 Highlanders 16.90
2 Sunwolves vs. Waratahs Feb 23 Waratahs -15.60
3 Crusaders vs. Hurricanes Feb 23 Crusaders 11.00
4 Brumbies vs. Chiefs Feb 23 Chiefs -5.00
5 Sharks vs. Blues Feb 23 Sharks 8.30
6 Stormers vs. Lions Feb 23 Lions -7.70
7 Jaguares vs. Bulls Feb 23 Jaguares 5.00


Rugby Premiership Predictions for Round 14

Team Ratings for Round 14

The basic method is described on my Department home page.
Here are the team ratings prior to this week’s games, along with the ratings at the start of the season.

Current Rating Rating at Season Start Difference
Saracens 11.41 11.19 0.20
Exeter Chiefs 10.26 11.13 -0.90
Northampton Saints 4.98 3.42 1.60
Wasps 4.31 8.30 -4.00
Harlequins 3.31 2.05 1.30
Gloucester Rugby 2.94 1.23 1.70
Leicester Tigers 2.78 6.26 -3.50
Bath Rugby 2.40 3.11 -0.70
Sale Sharks 0.48 -0.81 1.30
Worcester Warriors -2.96 -5.18 2.20
Bristol -3.97 -5.60 1.60
Newcastle Falcons -4.36 -3.51 -0.80


Performance So Far

So far there have been 78 matches played, 57 of which were correctly predicted, a success rate of 73.1%.
Here are the predictions for last week’s games.

Game Date Score Prediction Correct
1 Bath Rugby vs. Newcastle Falcons Feb 16 30 – 13 11.20 TRUE
2 Bristol vs. Wasps Feb 16 22 – 29 -1.90 TRUE
3 Gloucester Rugby vs. Exeter Chiefs Feb 16 24 – 17 -2.80 FALSE
4 Harlequins vs. Worcester Warriors Feb 16 47 – 33 11.30 TRUE
5 Northampton Saints vs. Sale Sharks Feb 16 67 – 17 7.00 TRUE
6 Saracens vs. Leicester Tigers Feb 16 33 – 10 13.10 TRUE


Predictions for Round 14

Here are the predictions for Round 14. The prediction is my estimated expected points difference with a positive margin being a win to the home team, and a negative margin a win to the away team.

Game Date Winner Prediction
1 Exeter Chiefs vs. Newcastle Falcons Feb 23 Exeter Chiefs 20.10
2 Gloucester Rugby vs. Saracens Feb 23 Saracens -3.00
3 Harlequins vs. Bristol Feb 23 Harlequins 12.80
4 Northampton Saints vs. Bath Rugby Feb 23 Northampton Saints 8.10
5 Wasps vs. Sale Sharks Feb 23 Wasps 9.30
6 Worcester Warriors vs. Leicester Tigers Feb 23 Leicester Tigers -0.20


Pro14 Predictions for Round 16

Team Ratings for Round 16

The basic method is described on my Department home page.
Here are the team ratings prior to this week’s games, along with the ratings at the start of the season.

Current Rating Rating at Season Start Difference
Leinster 12.16 9.80 2.40
Munster 10.59 8.08 2.50
Glasgow Warriors 7.44 8.55 -1.10
Scarlets 2.70 6.39 -3.70
Connacht 2.61 0.01 2.60
Ospreys 0.70 -0.86 1.60
Edinburgh 0.51 -0.64 1.10
Cardiff Blues 0.43 0.24 0.20
Ulster -0.10 2.07 -2.20
Cheetahs -1.86 -0.83 -1.00
Treviso -2.18 -5.19 3.00
Dragons -8.37 -8.59 0.20
Southern Kings -10.60 -7.91 -2.70
Zebre -13.48 -10.57 -2.90


Performance So Far

So far there have been 105 matches played, 82 of which were correctly predicted, a success rate of 78.1%.
Here are the predictions for last week’s games.

Game Date Score Prediction Correct
1 Ospreys vs. Ulster Feb 16 0 – 8 6.50 FALSE
2 Edinburgh vs. Dragons Feb 16 34 – 17 12.70 TRUE
3 Munster vs. Southern Kings Feb 16 43 – 0 24.20 TRUE
4 Zebre vs. Leinster Feb 17 24 – 40 -22.10 TRUE
5 Treviso vs. Scarlets Feb 17 25 – 19 -1.60 FALSE
6 Connacht vs. Cheetahs Feb 17 25 – 17 9.20 TRUE
7 Cardiff Blues vs. Glasgow Warriors Feb 17 34 – 38 -2.20 TRUE


Predictions for Round 16

Here are the predictions for Round 16. The prediction is my estimated expected points difference with a positive margin being a win to the home team, and a negative margin a win to the away team.

Game Date Winner Prediction
1 Glasgow Warriors vs. Connacht Feb 23 Glasgow Warriors 9.30
2 Ospreys vs. Munster Feb 23 Munster -5.40
3 Leinster vs. Southern Kings Feb 23 Leinster 27.30
4 Treviso vs. Dragons Feb 24 Treviso 10.70
5 Edinburgh vs. Cardiff Blues Feb 24 Edinburgh 4.60
6 Ulster vs. Zebre Feb 24 Ulster 17.90
7 Scarlets vs. Cheetahs Feb 25 Scarlets 9.10


February 18, 2019

No, where are you really from?

From the Herald today:

That last number doesn’t look right.  At the 2013 Census, there were just under 90,000 people ordinarily resident in NZ who were born in the People’s Republic of China. Since then, there have been a net 46000 permanent or long-term migrants, according to a Stats NZ app — and recent research from Stats NZ has found that these figures overstate net migration a bit, because they misclassify some people returning home.  So, there are maybe 135,000 people living in NZ who were born in the PRC. Not all of these will think of NZ as home — some of them will be just here to study, for example — but it’s a reasonable group to consider. It’s not 290,000, and I don’t see how you can get that number.

On Twitter this morning, Tze Ming Mok speculated that the number might be people of Chinese ethnicity, but as she said, even that is hard to get as high as 290,000. And, very importantly, other people of Chinese ethnicity don’t necessarily have favourable views of the PRC — though they (and other people of East and Southeast Asian ethnicity) do get the spillover from both anti-PRC sentiment and traditional racism.


Briefly

  • “Often these studies are not found out to be inaccurate until there’s another real big dataset that someone applies these techniques to and says ‘oh my goodness, the results of these two studies don’t overlap‘,” she said. Genevra Allen (who gave one of the inaugural Ihaka Lectures here in Auckland) on machine learning in science.
  • Good piece by Jenny Nicholls from North and South on algorithm risks (based around a new book, Hello World, by Hannah Fry)
  • From the open AI blog, about a new neural network algorithm for generating realistic text: “Due to concerns about large language models being used to generate deceptive, biased, or abusive language at scale, we are only releasing a much smaller version of GPT-2 along with sampling code. We are not releasing the dataset, training code, or GPT-2 model weights.” Exercise for the reader: does this feel like a good idea? Would it feel like a good idea if Facebook were saying it?
  • PredPol claims to use an algorithm to predict crime in specific 500-foot by 500-foot sections of a city, so that police can patrol or surveil specific areas more heavily.” And they say that when police go to these areas they really do find crimes occurring there. Which…is less reassuring than PredPol seems to think.
  • ” For example, a tench (a very big fish) is typically recognized by fingers on top of a greenish background. Why? Because most images in this category feature a fisherman holding up the tench like a trophy. About how neural networks work (a bit technical).
  • Julian Sanchez argues that, yes, online click-through agreements are bad for data privacy, but partly because data consent is genuinely a hard problem