Posts from May 2018 (28)

May 29, 2018

Super 15 Predictions for Round 16

Team Ratings for Round 16

The basic method is described on my Department home page.
Here are the team ratings prior to this week’s games, along with the ratings at the start of the season.

Current Rating Rating at Season Start Difference
Crusaders 14.86 15.23 -0.40
Hurricanes 13.73 16.18 -2.40
Lions 8.48 13.81 -5.30
Chiefs 8.30 9.29 -1.00
Highlanders 6.73 10.29 -3.60
Sharks 0.78 1.02 -0.20
Waratahs 0.76 -3.92 4.70
Jaguares 0.62 -4.64 5.30
Stormers -0.58 1.48 -2.10
Blues -1.70 -0.24 -1.50
Brumbies -2.64 1.75 -4.40
Bulls -2.90 -4.79 1.90
Reds -8.92 -9.47 0.60
Rebels -9.30 -14.96 5.70
Sunwolves -15.66 -18.42 2.80


Performance So Far

So far there have been 94 matches played, 66 of which were correctly predicted, a success rate of 70.2%.
Here are the predictions for last week’s games.

Game Date Score Prediction Correct
1 Crusaders vs. Hurricanes May 25 24 – 13 3.80 TRUE
2 Rebels vs. Sunwolves May 25 40 – 13 8.10 TRUE
3 Jaguares vs. Sharks May 25 29 – 13 2.20 TRUE
4 Chiefs vs. Waratahs May 26 39 – 27 11.50 TRUE
5 Reds vs. Highlanders May 26 15 – 18 -12.80 TRUE
6 Bulls vs. Brumbies May 26 28 – 38 5.60 FALSE
7 Stormers vs. Lions May 26 23 – 26 -5.90 TRUE


Predictions for Round 16

Here are the predictions for Round 16. The prediction is my estimated expected points difference with a positive margin being a win to the home team, and a negative margin a win to the away team.

Game Date Winner Prediction
1 Highlanders vs. Hurricanes Jun 01 Hurricanes -3.50
2 Blues vs. Rebels Jun 02 Blues 11.60
3 Chiefs vs. Crusaders Jun 02 Crusaders -3.10
4 Reds vs. Waratahs Jun 02 Waratahs -6.20
5 Brumbies vs. Sunwolves Jun 03 Brumbies 17.00


NRL Predictions for Round 13

Team Ratings for Round 13

The basic method is described on my Department home page.
Here are the team ratings prior to this week’s games, along with the ratings at the start of the season.

Current Rating Rating at Season Start Difference
Storm 8.88 16.73 -7.90
Panthers 5.75 2.64 3.10
Dragons 3.94 -0.45 4.40
Rabbitohs 3.69 -3.90 7.60
Sharks 3.43 2.20 1.20
Roosters 2.15 0.13 2.00
Broncos 0.15 4.78 -4.60
Raiders -0.15 3.50 -3.70
Cowboys -0.63 2.97 -3.60
Sea Eagles -0.91 -1.07 0.20
Wests Tigers -0.99 -3.63 2.60
Bulldogs -2.16 -3.43 1.30
Eels -3.65 1.51 -5.20
Warriors -4.13 -6.97 2.80
Titans -7.81 -8.91 1.10
Knights -9.88 -8.43 -1.40


Performance So Far

So far there have been 96 matches played, 57 of which were correctly predicted, a success rate of 59.4%.
Here are the predictions for last week’s games.

Game Date Score Prediction Correct
1 Broncos vs. Eels May 24 18 – 10 6.60 TRUE
2 Raiders vs. Sea Eagles May 25 21 – 20 4.20 TRUE
3 Cowboys vs. Storm May 25 6 – 7 -7.40 TRUE
4 Roosters vs. Titans May 26 34 – 14 11.80 TRUE
5 Warriors vs. Rabbitohs May 26 10 – 30 -0.60 TRUE
6 Panthers vs. Dragons May 26 28 – 2 1.40 TRUE
7 Knights vs. Sharks May 27 10 – 48 -5.80 TRUE
8 Wests Tigers vs. Bulldogs May 27 14 – 10 4.20 TRUE


Predictions for Round 13

Here are the predictions for Round 13. The prediction is my estimated expected points difference with a positive margin being a win to the home team, and a negative margin a win to the away team.

Game Date Winner Prediction
1 Sea Eagles vs. Cowboys May 31 Sea Eagles 2.70
2 Rabbitohs vs. Sharks Jun 01 Rabbitohs 3.30
3 Eels vs. Knights Jun 02 Eels 9.20
4 Roosters vs. Wests Tigers Jun 03 Roosters 6.10


Briefly

  • “It is important that guidelines for mitigation measures are proportionate to the risk posed, and that remediation strategies should be informed by a risk-based approach.” That’s not the money quote from Sir Peter Gluckman’s report on methamphetamine testing for houses (PDF), but it’s the generic StatsChat message.  For more, see Russell Brown’s story; he has been a consistent journalistic voice against panic-based testing.
  • From an NY Times oped “Knowing a person’s political leanings should not affect your assessment of how good a doctor she is — or whether she is likely to be a good accountant or a talented architect. But in practice, does it?  Recently we conducted an experiment to answer that question”.  As Andrew Gelman explains, they totally didn’t.
  • A new UK Parliament report “Algorithms in Decision Making”
  • “Why Government needs sustainable [statistical] software, too”
May 25, 2018

Tweet dreams

Q: Did you see using a mobile phone after 10pm leads to depression and loneliness, depression, bipolar disorder and neuroticism?

A: Where?

Q: The Independent, the Daily Mail, news.com.au, the Geelong Advertiser, Student Problems, …

A: So, what are we supposed to check first?

Q: Mice. It isn’t mice, it’s people.  “However, now a study of more than 91,000 people has found that scrolling through your Instagram and Twitter feeds from the comfort of your pillow in the wee hours could increase the likelihood of developing a number of psychological problems such as depression, bipolar disorder and neuroticism.”

A: Ok, ok.  Do any of them link?

Q: The Independent does. But it’s behind a paywall

A: <sighs> Ok. Here’s the press release. 

Q: But that doesn’t mention mobile phones. Or Twitter or Instagram.

A: No, it doesn’t.

Q: It looks like they used fitbits, though

A: Yes, or near offer.

Q: Could they tell from those when someone was using their phone?

A: I don’t know if they could, but they didn’t. They just looked at how much people’s physical activity differed between night and day.

Q: What’s that got to do with mobile phones?

A: If using your phone late at night stops you sleeping, then you might have less difference in activity between night and day.

Q: I suppose. Did they look at actual sleep?

A: Not in this study

Q: So, the people with less day-night difference in physical activity ended up with more mental health problems?

A: No, they started off with more mental health problems.  As the comment at the bottom of the press release says “The study population (median age at baseline of 62 years, IQR 54-68 years) is not ideal to examine the causes of mental health, given that 75% of disorders start before the age of 24 years.”

Q: These were 60-year olds?

A: Yes. In 2013-14.

Q: Did British 60-year-olds even use Twitter and Instagram in 2013-14? Instagram was only on iPhones back then, wasn’t it?

A: About a third of Brits between 55-64 had a smartphone then, and about 10% of older people.

Does bacon prevent cancer?

No.

This isn’t even supposed to be new research: it’s just a new set of guidelines based on all the same existing research. Since it’s a new set of public guidelines, you’d think a link would be appropriate: here it is.

The story says “”No level of intake” of processed meats will reduce cancer risks.”  and the quote from the report is The data show that no level of intake can confidently be associated with a lack of risk.  I don’t think that will surprise many people, and it’s what we’ve been told for a long time. There isn’t a magic threshold where bacon switches from being a health food to being bad for you. If you want something more quantitative, the figures we had last bacon panic haven’t changed: eating an extra serving of bacon every day is estimated to increase your lifetime bowel cancer risk by a factor of 1.2, or a bit under two extra cases per hundred people.

For alcohol, the focus on cancer is a bit misleading.  Low levels of alcohol consumption increase cancer risk but reduce heart disease risk, and there’s a range where it’s pretty much a wash — there isn’t a ‘safe level’ from a cancer viewpoint, but there probably is from a not-dying viewpoint. Still, there are lots of people who’d be healthier if they drank less alcohol — and that’s probably not the first time they’ve heard the message.

May 24, 2018

Reading the fine print

From Toby Manhire at The Spinoffquoting Reuters

“New Zealand’s dairy-fuelled economy has for several years been the envy of the rich world, yet despite the rise in prosperity tens of thousands of residents are sleeping in cars, shop entrances and alleyways.”

There was something similar in the Guardian, too. As Toby says

The juxtaposition is compelling and well made. The number is compelling and nonsense.

I’ve posted about this issue before. The OECD report that people use (directly or indirectly) as source, says

Australia, the Czech Republic and New Zealand report a relatively large incidence of homelessness, and this is partly explained by the fact that these countries adopt a broad definition of homelessness…..In New Zealand homelessness is defined as “living situations where people with no other options to acquire safe and secure housing: are without shelter, in temporary accommodation, sharing accommodation with a household or living in uninhabitable housing.

That’s much broader than ‘sleeping in cars, shop entrances and alleyways.” One of the researchers behind the NZ figure said, in a Herald interview in 2016

“If the homeless population were a hundred people, 70 are staying with extended family or friends in severely crowded houses, 20 are in a motel, boarding house or camping ground, and 10 are living on the street, in cars, or in other improvised dwellings.”

Homelessness is a real problem in New Zealand. Because it’s a real problem, it’s important to focus on what the problem actually is, and not to make up a different problem.

Reuters has corrected the figure but hasn’t otherwise changed the story.  The fact that reducing the figure by a factor of ten doesn’t otherwise change the story might tell you something about the story.


(update: ok, now I’ve actually read all of Toby’s post, not just the first few paragraphs, he basically says all this already)

May 23, 2018

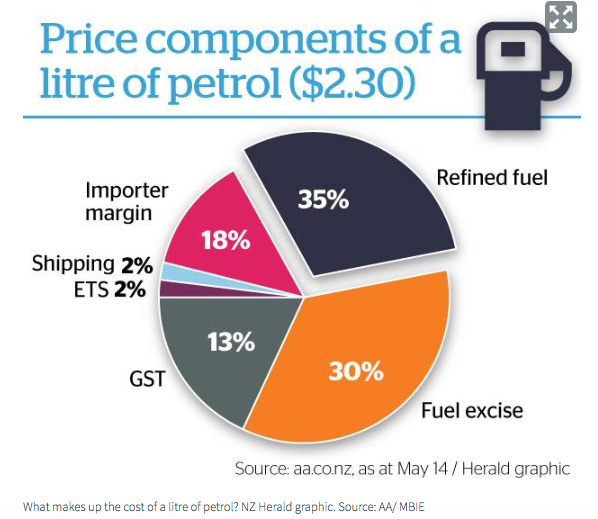
Graph of the week

From the Herald (via @aw_nz on Twitter)

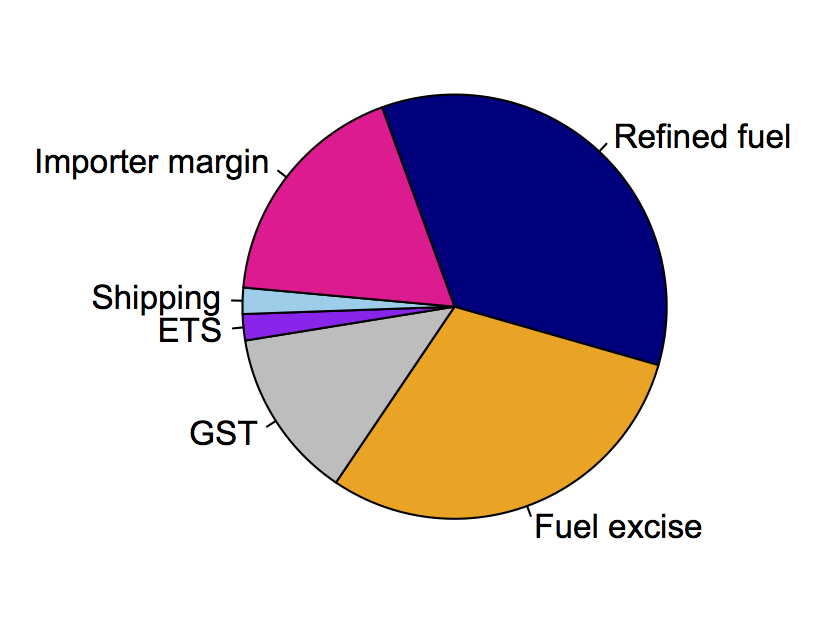
One of the features of pie charts is that it’s relatively hard to judge angles and compare segments. Still, if you get them wrong enough, people can tell.   For example, the taxes — the grey and orange wedges — are clearly more than half the circle, but the numbers add to only 43%.  Less dramatically, the 13% wedge for GST is larger than the 18% wedge for importer margin, and the 30% wedge for fuel excise is larger than the 35% wedge for refined fuel.  You don’t have to be very cynical to wonder whether it’s a coincidence that the tax components are being exaggerated. [update: you don’t, but you’d probably be wrong — see comments]

Here’s an accurate piechart, assuming the numbers are correct:

May 22, 2018

Super 15 Predictions for Round 15

Team Ratings for Round 15

The basic method is described on my Department home page.
Here are the team ratings prior to this week’s games, along with the ratings at the start of the season.

Current Rating Rating at Season Start Difference
Crusaders 14.43 15.23 -0.80
Hurricanes 14.16 16.18 -2.00
Lions 8.66 13.81 -5.10
Chiefs 8.27 9.29 -1.00
Highlanders 7.32 10.29 -3.00
Sharks 1.61 1.02 0.60
Waratahs 0.80 -3.92 4.70
Jaguares -0.21 -4.64 4.40
Stormers -0.75 1.48 -2.20
Blues -1.70 -0.24 -1.50
Bulls -1.96 -4.79 2.80
Brumbies -3.57 1.75 -5.30
Reds -9.51 -9.47 -0.00
Rebels -10.43 -14.96 4.50
Sunwolves -14.52 -18.42 3.90


Performance So Far

So far there have been 87 matches played, 60 of which were correctly predicted, a success rate of 69%.
Here are the predictions for last week’s games.

Game Date Score Prediction Correct
1 Hurricanes vs. Reds May 18 38 – 34 30.90 TRUE
2 Sunwolves vs. Stormers May 19 26 – 23 -11.50 FALSE
3 Blues vs. Crusaders May 19 24 – 32 -13.30 TRUE
4 Waratahs vs. Highlanders May 19 41 – 12 -6.80 FALSE
5 Sharks vs. Chiefs May 19 28 – 24 -3.60 FALSE
6 Lions vs. Brumbies May 19 42 – 24 16.00 TRUE
7 Jaguares vs. Bulls May 19 54 – 24 2.40 TRUE


Predictions for Round 15

Here are the predictions for Round 15. The prediction is my estimated expected points difference with a positive margin being a win to the home team, and a negative margin a win to the away team.

Game Date Winner Prediction
1 Crusaders vs. Hurricanes May 25 Crusaders 3.80
2 Rebels vs. Sunwolves May 25 Rebels 8.10
3 Jaguares vs. Sharks May 25 Jaguares 2.20
4 Chiefs vs. Waratahs May 26 Chiefs 11.50
5 Reds vs. Highlanders May 26 Highlanders -12.80
6 Bulls vs. Brumbies May 26 Bulls 5.60
7 Stormers vs. Lions May 26 Lions -5.90


NRL Predictions for Round 12

Team Ratings for Round 12

The basic method is described on my Department home page.
Here are the team ratings prior to this week’s games, along with the ratings at the start of the season.

Current Rating Rating at Season Start Difference
Storm 9.33 16.73 -7.40
Dragons 5.66 -0.45 6.10
Panthers 4.02 2.64 1.40
Rabbitohs 2.34 -3.90 6.20
Roosters 1.58 0.13 1.40
Sharks 1.18 2.20 -1.00
Raiders 0.07 3.50 -3.40
Broncos 0.06 4.78 -4.70
Wests Tigers -0.98 -3.63 2.70
Cowboys -1.08 2.97 -4.00
Sea Eagles -1.14 -1.07 -0.10
Bulldogs -2.17 -3.43 1.30
Warriors -2.77 -6.97 4.20
Eels -3.55 1.51 -5.10
Titans -7.24 -8.91 1.70
Knights -7.63 -8.43 0.80


Performance So Far

So far there have been 88 matches played, 49 of which were correctly predicted, a success rate of 55.7%.
Here are the predictions for last week’s games.

Game Date Score Prediction Correct
1 Panthers vs. Wests Tigers May 17 16 – 2 7.00 TRUE
2 Eels vs. Warriors May 18 14 – 24 6.00 FALSE
3 Broncos vs. Roosters May 18 28 – 22 0.70 TRUE
4 Titans vs. Knights May 19 33 – 26 2.80 TRUE
5 Cowboys vs. Rabbitohs May 19 19 – 20 -0.30 TRUE
6 Storm vs. Sea Eagles May 19 4 – 24 18.90 FALSE
7 Dragons vs. Raiders May 20 25 – 18 8.80 TRUE
8 Sharks vs. Bulldogs May 20 22 – 16 6.40 TRUE


Predictions for Round 12

Here are the predictions for Round 12. The prediction is my estimated expected points difference with a positive margin being a win to the home team, and a negative margin a win to the away team.

Game Date Winner Prediction
1 Broncos vs. Eels May 24 Broncos 6.60
2 Raiders vs. Sea Eagles May 25 Raiders 4.20
3 Cowboys vs. Storm May 25 Storm -7.40
4 Roosters vs. Titans May 26 Roosters 11.80
5 Warriors vs. Rabbitohs May 26 Rabbitohs -0.60
6 Panthers vs. Dragons May 26 Panthers 1.40
7 Knights vs. Sharks May 27 Sharks -5.80
8 Wests Tigers vs. Bulldogs May 27 Wests Tigers 4.20


Aviva Premiership Predictions for the Final

Team Ratings for the Final

The basic method is described on my Department home page.
Here are the team ratings prior to this week’s games, along with the ratings at the start of the season.

Current Rating Rating at Season Start Difference
Saracens 13.50 7.47 6.00
Exeter Chiefs 11.19 7.99 3.20
Wasps 5.79 5.89 -0.10
Leicester Tigers 4.61 4.64 -0.00
Bath Rugby 1.95 1.23 0.70
Sale Sharks 0.18 -1.73 1.90
Gloucester Rugby -1.74 0.21 -1.90
Northampton Saints -1.77 1.53 -3.30
Newcastle Falcons -2.26 -3.33 1.10
Harlequins -3.57 0.84 -4.40
Worcester Warriors -4.85 -4.37 -0.50
London Irish -7.61 -4.94 -2.70


Performance So Far

So far there have been 134 matches played, 95 of which were correctly predicted, a success rate of 70.9%.
Here are the predictions for last week’s games.

Game Date Score Prediction Correct
1 Saracens vs. Wasps May 19 57 – 36 9.90 TRUE
2 Exeter Chiefs vs. Newcastle Falcons May 19 33 – 5 15.50 TRUE


Predictions for the Final

Here are the predictions for the Final. The prediction is my estimated expected points difference with a positive margin being a win to the home team, and a negative margin a win to the away team.

Game Date Winner Prediction
1 Exeter Chiefs vs. Saracens May 26 Saracens -2.30