Posts from March 2018 (19)

March 15, 2018

Polls aren’t dead yet

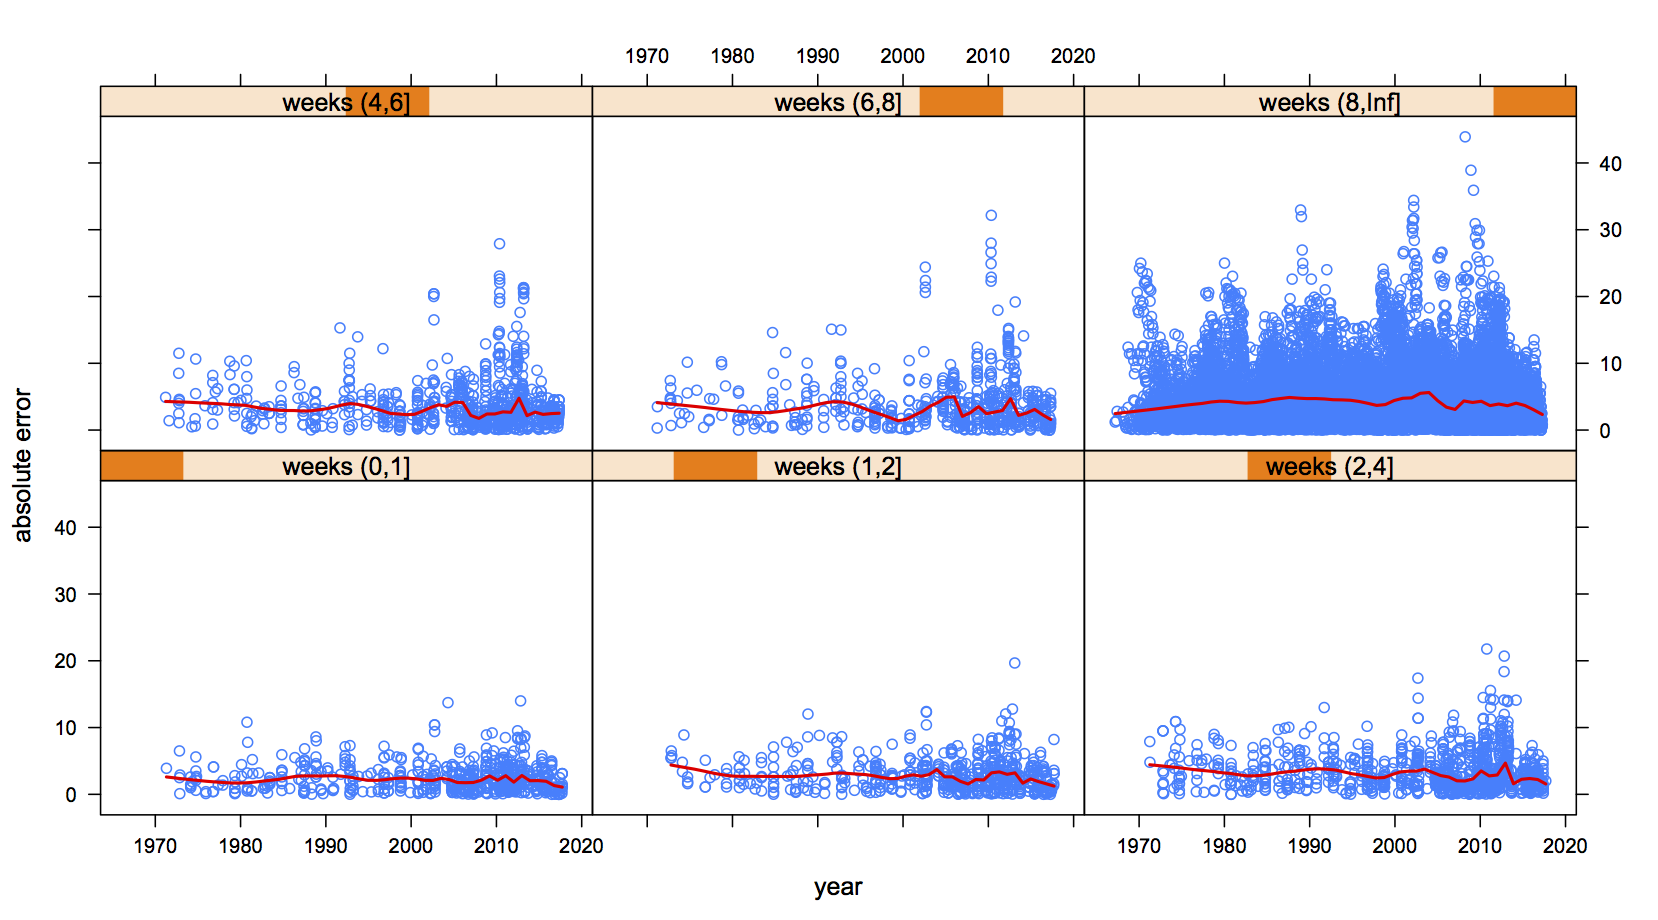
There’s a new paper in the journal Nature Human Behaviour analysing a huge collection of election poll data: over 30,000 polls. The researchers’ conclusion is straightforward: polls have not become less accurate. Unfortunately, all the nice graphs are behind a paywall. Fortunately, the data isn’t, and I can draw you a nice graph of my own

The graph shows all the poll results back to 1970, split up into panels by how many weeks before the election they were.  I’m showing just one party per poll: the data have conveniently been coded so it’s a big party (eg Labour for NZ, Conservatives for UK). Each panel shows the error in the poll plotted against the year of the election; the red line is an average.

The red lines are basically flat. Despite cellphones, the internet, political polarisation, and millennials, average polling error hasn’t changed all that much over the past fifty years.

March 13, 2018

Super 15 Predictions for Round 5

Team Ratings for Round 5

The basic method is described on my Department home page.

Here are the team ratings prior to this week’s games, along with the ratings at the start of the season.

Current Rating Rating at Season Start Difference
Hurricanes 16.02 16.18 -0.20
Crusaders 15.45 15.23 0.20
Lions 11.98 13.81 -1.80
Highlanders 10.18 10.29 -0.10
Chiefs 8.60 9.29 -0.70
Blues 1.32 -0.24 1.60
Sharks 1.27 1.02 0.30
Stormers 0.68 1.48 -0.80
Brumbies -1.72 1.75 -3.50
Waratahs -3.37 -3.92 0.50
Bulls -4.20 -4.79 0.60
Jaguares -4.49 -4.64 0.20
Reds -9.64 -9.47 -0.20
Rebels -10.21 -14.96 4.80
Sunwolves -19.27 -18.42 -0.80


Performance So Far

So far there have been 23 matches played, 15 of which were correctly predicted, a success rate of 65.2%.
Here are the predictions for last week’s games.

Game Date Score Prediction Correct
1 Highlanders vs. Stormers Mar 09 33 – 15 12.90 TRUE
2 Rebels vs. Brumbies Mar 09 33 – 10 -8.80 FALSE
3 Hurricanes vs. Crusaders Mar 10 29 – 19 3.30 TRUE
4 Reds vs. Bulls Mar 10 20 – 14 -2.40 FALSE
5 Sharks vs. Sunwolves Mar 10 50 – 22 24.10 TRUE
6 Lions vs. Blues Mar 10 35 – 38 17.10 FALSE
7 Jaguares vs. Waratahs Mar 10 38 – 28 1.90 TRUE


Predictions for Round 5

Here are the predictions for Round 5. The prediction is my estimated expected points difference with a positive margin being a win to the home team, and a negative margin a win to the away team.

Game Date Winner Prediction
1 Chiefs vs. Bulls Mar 16 Chiefs 16.80
2 Highlanders vs. Crusaders Mar 17 Crusaders -1.80
3 Brumbies vs. Sharks Mar 17 Brumbies 1.00
4 Stormers vs. Blues Mar 17 Stormers 3.40
5 Lions vs. Sunwolves Mar 17 Lions 35.30
6 Jaguares vs. Reds Mar 17 Jaguares 9.10
7 Waratahs vs. Rebels Mar 18 Waratahs 10.30


NRL Predictions for Round 2

Team Ratings for Round 2

The basic method is described on my Department home page.

Here are the team ratings prior to this week’s games, along with the ratings at the start of the season.

Current Rating Rating at Season Start Difference
Storm 16.79 16.73 0.10
Panthers 3.75 2.64 1.10
Cowboys 3.12 2.97 0.20
Broncos 3.09 4.78 -1.70
Raiders 2.70 3.50 -0.80
Sharks 2.05 2.20 -0.20
Dragons 1.25 -0.45 1.70
Eels 0.40 1.51 -1.10
Roosters -0.06 0.13 -0.20
Sea Eagles -1.44 -1.07 -0.40
Wests Tigers -3.44 -3.63 0.20
Bulldogs -3.49 -3.43 -0.10
Rabbitohs -5.27 -3.90 -1.40
Warriors -5.60 -6.97 1.40
Knights -8.05 -8.43 0.40
Titans -8.11 -8.91 0.80


Performance So Far

So far there have been 8 matches played, 3 of which were correctly predicted, a success rate of 37.5%.
Here are the predictions for last week’s games.

Game Date Score Prediction Correct
1 Dragons vs. Broncos Mar 08 34 – 12 -2.20 FALSE
2 Knights vs. Sea Eagles Mar 09 19 – 18 -4.40 FALSE
3 Cowboys vs. Sharks Mar 09 20 – 14 3.80 TRUE
4 Wests Tigers vs. Roosters Mar 10 10 – 8 -0.80 FALSE
5 Rabbitohs vs. Warriors Mar 10 20 – 32 7.60 FALSE
6 Bulldogs vs. Storm Mar 10 18 – 36 -17.20 TRUE
7 Panthers vs. Eels Mar 11 24 – 4 4.10 TRUE
8 Titans vs. Raiders Mar 11 30 – 28 -9.40 FALSE


Predictions for Round 2

Here are the predictions for Round 2. The prediction is my estimated expected points difference with a positive margin being a win to the home team, and a negative margin a win to the away team.

Game Date Winner Prediction
1 Sharks vs. Dragons Mar 15 Sharks 3.80
2 Roosters vs. Bulldogs Mar 16 Roosters 6.40
3 Broncos vs. Cowboys Mar 16 Broncos 3.00
4 Warriors vs. Titans Mar 17 Warriors 7.00
5 Panthers vs. Rabbitohs Mar 17 Panthers 12.00
6 Storm vs. Wests Tigers Mar 17 Storm 23.20
7 Sea Eagles vs. Eels Mar 18 Sea Eagles 1.20
8 Raiders vs. Knights Mar 18 Raiders 13.80


March 11, 2018

The 7% solution

Astronaut Scott Kelly has been extensively studied after a year in space (and so has his identical twin).  There’s a new, and pretty dramatic, story about some of the results. For example, IFLScience says NASA Sent One Identical Twin Brother To Space For A Year – And It May Have Permanently Changed 7 Percent Of His DNA. So does Business Insider.

If you know that a chimpanzee’s DNA is only about 1% different from a human’s — or that a mouse’s is about 8% different — that sounds weird. It’s even worse than that: the chance you’d still be alive after that sort of mutation load is pretty small.

So what did happen? Well, the story seems to be an example of accumulated mutations itself. In a recent interview for Marketplace, Scott Kelly said

“I did read in the newspaper the other day… that 7 percent of my DNA had changed permanently,” Kelly said. “And I’m reading that, I’m like, ‘Huh, well that’s weird.’” 

We’re seeing reports of someone quoting something from the media, rather than any primary source. If you go to the NASA press release, it says

Although 93% of genes’ expression returned to normal postflight, a subset of several hundred “space genes” were still disrupted after return to Earth.

That seems to be the origin of the ‘7%’ figure.

So what’s the difference? Imagine the genome as a library.  A 7% chance in DNA would be like saying 7% of the words in all the books in the library had been altered.  A change in expression in 7% of genes would be like 7% of the books having a noticeable increase or decrease in how often they were borrowed.

There were also some small changes in Scott’s DNA.  His telomeres, which are the caps on chromosomes that stop them fraying at the ends (like the little plastic bits on shoelaces) were slightly longer — which is probably good. DNA that scientists sequenced from his blood also had “hundreds” of new mutations: more than you’d typically expect, but still only about 0.0000001% of his DNA
March 8, 2018

“Causal” is only the start

Jamie Morton has an interesting story in the Herald, reporting on research by Wellington firm Dot Loves Data.

They then investigated how well they all predicted the occurrence of assaults at “peak” times – between 10pm and 3am on weekends – and otherwise in “off-peak” times.

Unsurprisingly, a disproportionate number of assaults happened during peak times – but also within a very short distance of taverns.

The figures showed a much higher proportion of assault occurred in more deprived areas – and that, in off-peak times, socio-economic status proved a better predictor of assault than the nearness or number of bars.

Unsuprisingly, the police were unsurprised.

This isn’t just correlation: with good-quality location data and the difference between peak and other times, it’s not just a coincidence that the assaults happened near bars, nor is it just due to population density.  The closeness of the bars and the assaults also argues against the simple reverse-causation explanation: that bars are just sited near their customers, and it’s the customers who are the problem.

So, it looks as if you can predict violent crimes from the location of bars (which would be more useful if you couldn’t just cut out the middleman and predict violent crimes from the locations of violent crimes).  And if we moved the bars, the assaults would probably move with them: if we switched a florist’s shop and a bar, the assaults wouldn’t keep happening outside the florist’s.

What this doesn’t tell us directly is what would happen if we dramatically reduced the number of bars.  It might be that we’d reduce violent crime. Or it might be that it would concentrate around the smaller number of bars. Or it might be that the relationship between bars and fights would weaken: people might get drunk and have fights in a wider range of convenient locations.

It’s hard to predict the impact of changes in regulation that are intended to have large effects on human behaviour — which is why it’s important to evaluate the impact of new rules, and ideally to have some automatic way of removing them if they didn’t do what they were supposed to.  Like the ban on pseudoephedrine in cold medicine.

March 6, 2018

Quantifying fairness

A bit more technical than usual, but definitely worth reading: “Reflections on Quantitative Fairness

A couple of less-technical excerpts

Much communication consists of taking one or another of these fairness concepts as obvious or axiomatic and asserting the violation of that principle as a political or moral gotcha. Formalization should not be regarded as a panacea in these debates but perhaps it can help to cement the points that:

  • a lack of clarity can conceal a debate with real content and stakes
  • differences in priorities and understandings of fairness are actually unresolved and in principle unresolvable without trade-offs

and

As statistical thinkers in the political sphere we should be aware of the hazards of supplanting politics by an expert discourse. In general, every statistical intervention to a conversation tends to raise the technical bar of entry, until it is reduced to a conversation between technical experts. As a result, in matters of criminal justice, public health, and employment, the key stakeholders, whose stakes are human stakes, and who typically lack a statistical background, can easily fall out of the conversation.

So are we speaking statistics to power? Or are we merely providing that power with new tools for the marginalization of unquantified political concerns? What is the value of this quantitative fairness conversation to a person or community whose concerns will not be quantified for another decade, if ever?

That is: it’s worth trying to be clear about what the actual question is, but we have to be careful in doing that not to push out the people who know the answer.

Super 15 Predictions for Round 4

Team Ratings for Round 4

The basic method is described on my Department home page.

Here are the team ratings prior to this week’s games, along with the ratings at the start of the season.

Current Rating Rating at Season Start Difference
Crusaders 15.86 15.23 0.60
Hurricanes 15.61 16.18 -0.60
Lions 13.19 13.81 -0.60
Highlanders 9.87 10.29 -0.40
Chiefs 8.60 9.29 -0.70
Sharks 1.03 1.02 0.00
Stormers 0.99 1.48 -0.50
Brumbies 0.19 1.75 -1.60
Blues 0.11 -0.24 0.30
Waratahs -2.88 -3.92 1.00
Bulls -3.70 -4.79 1.10
Jaguares -4.98 -4.64 -0.30
Reds -10.14 -9.47 -0.70
Rebels -12.12 -14.96 2.80
Sunwolves -19.04 -18.42 -0.60


Performance So Far

So far there have been 16 matches played, 11 of which were correctly predicted, a success rate of 68.8%.
Here are the predictions for last week’s games.

Game Date Score Prediction Correct
1 Blues vs. Chiefs Mar 02 21 – 27 -4.80 TRUE
2 Reds vs. Brumbies Mar 02 18 – 10 -8.90 FALSE
3 Crusaders vs. Stormers Mar 03 45 – 28 19.10 TRUE
4 Sunwolves vs. Rebels Mar 03 17 – 37 -0.60 TRUE
5 Sharks vs. Waratahs Mar 03 24 – 24 9.00 FALSE
6 Bulls vs. Lions Mar 03 35 – 49 -13.30 TRUE
7 Jaguares vs. Hurricanes Mar 03 9 – 34 -15.40 TRUE


Predictions for Round 4

Here are the predictions for Round 4. The prediction is my estimated expected points difference with a positive margin being a win to the home team, and a negative margin a win to the away team.

Game Date Winner Prediction
1 Highlanders vs. Stormers Mar 09 Highlanders 12.90
2 Rebels vs. Brumbies Mar 09 Brumbies -8.80
3 Hurricanes vs. Crusaders Mar 10 Hurricanes 3.30
4 Reds vs. Bulls Mar 10 Bulls -2.40
5 Sharks vs. Sunwolves Mar 10 Sharks 24.10
6 Lions vs. Blues Mar 10 Lions 17.10
7 Jaguares vs. Waratahs Mar 10 Jaguares 1.90


NRL Predictions for Round 1

Team Ratings for Round 1

The basic method is described on my Department home page.

Here are the team ratings prior to this week’s games, along with the ratings at the start of the season.

Current Rating Rating at Season Start Difference
Storm 16.73 16.73 -0.00
Broncos 4.78 4.78 -0.00
Raiders 3.50 3.50 -0.00
Cowboys 2.97 2.97 0.00
Panthers 2.64 2.64 0.00
Sharks 2.20 2.20 -0.00
Eels 1.51 1.51 -0.00
Roosters 0.13 0.13 -0.00
Dragons -0.45 -0.45 -0.00
Sea Eagles -1.07 -1.07 -0.00
Bulldogs -3.43 -3.43 -0.00
Wests Tigers -3.63 -3.63 0.00
Rabbitohs -3.90 -3.90 -0.00
Warriors -6.97 -6.97 0.00
Knights -8.43 -8.43 0.00
Titans -8.91 -8.91 0.00


Predictions for Round 1

Here are the predictions for Round 1. The prediction is my estimated expected points difference with a positive margin being a win to the home team, and a negative margin a win to the away team.

Game Date Winner Prediction
1 Dragons vs. Broncos Mar 08 Broncos -2.20
2 Knights vs. Sea Eagles Mar 09 Sea Eagles -4.40
3 Cowboys vs. Sharks Mar 09 Cowboys 3.80
4 Wests Tigers vs. Roosters Mar 10 Roosters -0.80
5 Rabbitohs vs. Warriors Mar 10 Rabbitohs 7.60
6 Bulldogs vs. Storm Mar 10 Storm -17.20
7 Panthers vs. Eels Mar 11 Panthers 4.10
8 Titans vs. Raiders Mar 11 Raiders -9.40


March 5, 2018

Briefly

  • The gender gap: JP Morgan claims to pay its women employees 99% of what the men get. Felix Salmon and Matt Levine both take on this statistic: it doesn’t show women are paid the same (they aren’t), it just argues against one particular mechanism for the pay gap.
  • “Starting with no knowledge at all of what it was seeing, the neural network had to make up rules about which images should be labeled “sheep”. And it looks like it hasn’t realized that “sheep” means the actual animal, not just a sort of treeless grassiness.” Janelle Shane.
  • Translation is another example of the amazingly-good results networks can get, but with no grip on what’s actually going on. Douglas Hofstatder writes at the Atlantic about “The Shallowness of Google Translate“, and Mark Liberman at Language Log shows how it will translate random sequences of vowels into Hawaiian gibberish.
  • David Spiegelhalter on how to stop being so easily manipulated by misleading statistics
  • Tickets bought online for NZ Lotto are more likely to win. It’s obvious that there has to be a boring explanation for this. I suggested one that fitted the data.