Posts from February 2018 (15)

February 27, 2018

Super 15 Predictions for Round 3

Team Ratings for Round 3

The basic method is described on my Department home page.

Here are the team ratings prior to this week’s games, along with the ratings at the start of the season.

Current Rating Rating at Season Start Difference
Crusaders 15.98 15.23 0.80
Hurricanes 15.04 16.18 -1.10
Lions 13.15 13.81 -0.70
Highlanders 9.87 10.29 -0.40
Chiefs 8.53 9.29 -0.80
Sharks 1.57 1.02 0.60
Brumbies 1.20 1.75 -0.50
Stormers 0.86 1.48 -0.60
Blues 0.18 -0.24 0.40
Waratahs -3.42 -3.92 0.50
Bulls -3.65 -4.79 1.10
Jaguares -4.41 -4.64 0.20
Reds -11.15 -9.47 -1.70
Rebels -13.29 -14.96 1.70
Sunwolves -17.87 -18.42 0.60


Performance So Far

So far there have been 9 matches played, 6 of which were correctly predicted, a success rate of 66.7%.
Here are the predictions for last week’s games

Game Date Score Prediction Correct
1 Highlanders vs. Blues Feb 23 41 – 34 14.00 TRUE
2 Rebels vs. Reds Feb 23 45 – 19 -2.00 FALSE
3 Sunwolves vs. Brumbies Feb 24 25 – 32 -16.20 TRUE
4 Crusaders vs. Chiefs Feb 24 45 – 23 9.40 TRUE
5 Waratahs vs. Stormers Feb 24 34 – 27 -1.30 FALSE
6 Lions vs. Jaguares Feb 24 47 – 27 21.80 TRUE
7 Bulls vs. Hurricanes Feb 24 21 – 19 -17.00 FALSE


Predictions for Round 3

Here are the predictions for Round 3. The prediction is my estimated expected points difference with a positive margin being a win to the home team, and a negative margin a win to the away team.

Game Date Winner Prediction
1 Blues vs. Chiefs Mar 02 Chiefs -4.80
2 Reds vs. Brumbies Mar 02 Brumbies -8.90
3 Crusaders vs. Stormers Mar 03 Crusaders 19.10
4 Sunwolves vs. Rebels Mar 03 Rebels -0.60
5 Sharks vs. Waratahs Mar 03 Sharks 9.00
6 Bulls vs. Lions Mar 03 Lions -13.30
7 Jaguares vs. Hurricanes Mar 03 Hurricanes -15.40


February 24, 2018

Scare stories: a pain in the neck

From the Herald, from the Daily Mail, on the dangers of painkillers

Researchers have today revealed the exact risk of having a heart attack or stroke from taking several common painkillers.

They discovered, on average, one in 330 adults who have been taking ibuprofen will experience a heart attack or stroke within four weeks.

However, the drug, costing as little as 20c a tablet and available in supermarkets and dairies, was found to be three times less dangerous than celecoxib, which will lead to one in 105 adults experiencing a heart attack or stroke.

Now, that’s obviously not true for people just taking ibuprofen for an injury or a headache. So what’s the true story?

The research paper is here. As the story says, it followed up 56,000 people in Taiwan with high blood pressure.  They were interested in a group of painkillers called “COX-selective” that have a lower risk of causing ulcers and stomach bleeding, but potentially a higher risk of heart attack and stroke.  One familiar COX-selective painkiller in NZ is Voltaren, familiar non-selective ones are ibuprofen and naproxen — but the study wasn’t looking at over-the-counter medications bought in supermarkets and dairies, just at people starting prescriptions.

Over the 7927 people starting prescriptions for ibuprofen, 24 ended up getting a heart attack or stroke, after an average of two weeks’ treatment. Of the  1,779 starting celecoxib prescriptions, 17 ended up getting a heart attack or stroke, after an average of about three weeks’ treatment.  Overall, there was a bit more than one heart attack per ten people per year for those prescribed COX-selective drugs and a bit less than one heart attack per ten people per year for those prescribed non-selective drugs.  And there’s no comparison with people who weren’t taking painkillers

You might wonder how numbers like 24 and 17 are large enough to say anything reliable. They aren’t. The “exact risk” of 1 in 330 from the lead is actually a range from something like 1 in 200 to 1 in 500, even before you consider the uncertainties in generalising from middle-aged to elderly Taiwanese people with hypertension to other groups.

This study on its own provides only very weak evidence that COX-selective drugs are more dangerous. The conclusion is plausible for all sorts of reasons, but it’s hardly conclusive.  Like it says on the packet, don’t take any of these medications for weeks at a time without consulting a more reliable source than the Daily Mail.

Diet and genes: not so simple

One of the potential benefits of genetics in medicine and public health comes when two interventions are about equally good on average, but with a lot of variation between people.  We can hope that genetics explains which intervention works for which people, and lets us pick the right one for each person. So far, this hasn’t happened.

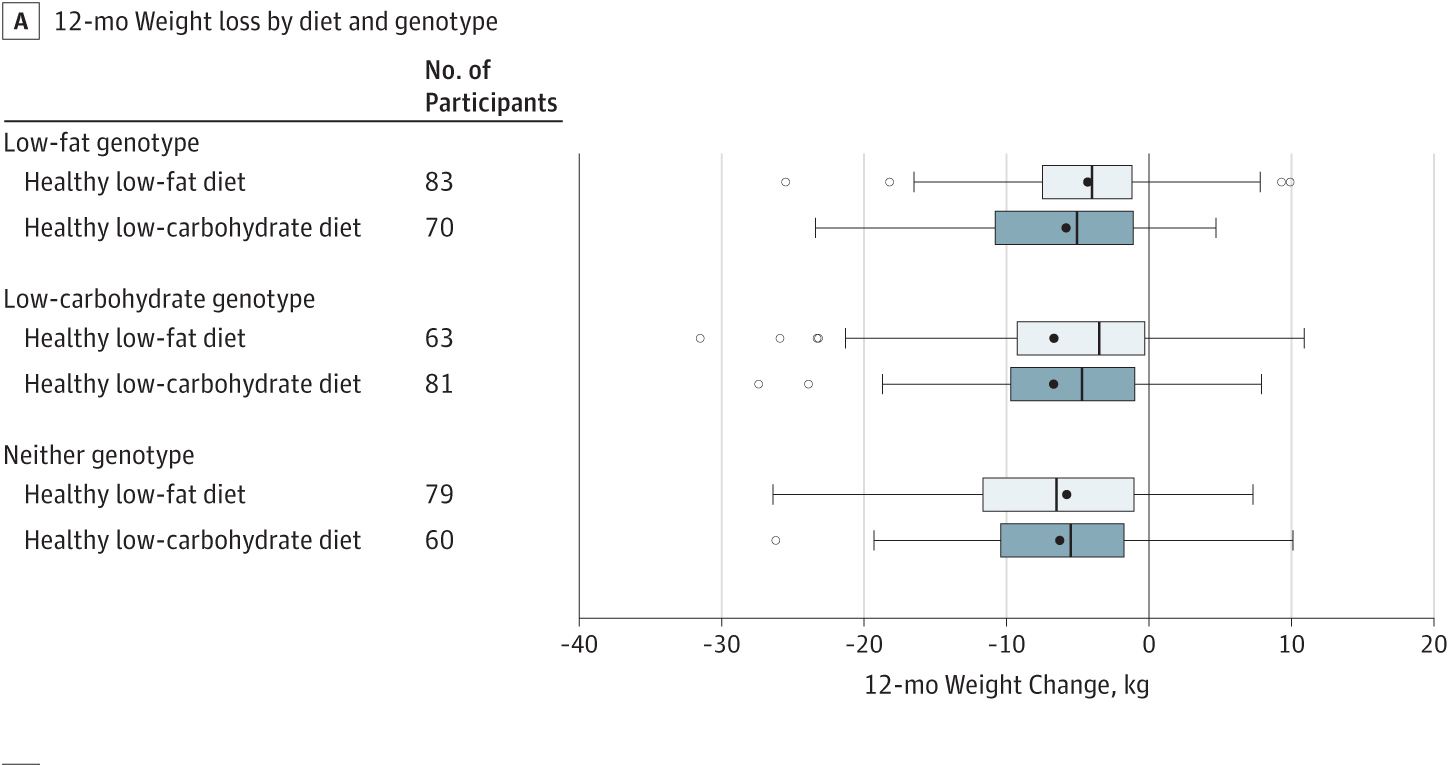
It didn’t happen again this week, with the results of a randomised trial comparing low-fat and low-carb diets.  A group of basically healthy but overweight or obese adults were randomly allocated to being recommended a low-fat diet or a low-carb diet.  After a year, the average weight loss in each group was about 6kg.

There are some genetic variants that have been found in previous studies to predict the success of low-fat vs low-carb diets.  This trial was set up to look at those genetic variants: even though the low-fat diet wasn’t better overall, was it better in people who were expected to be genetically suited to it? Here’s a graph from the research paper showing the distribution of weight losses in each group:


There’s no sign that genetics is helping.

It’s still plausible that genetic differences contribute, and even that we could use them to choose diets if we knew more. But right now, if you want to know whether you’ll lose weight on a particular (reasonable and moderate) diet, the only way to tell is to try it.

February 23, 2018

Briefly

  • Data visibility as a political act: Ben Goldacre and co-conspirators have set up a webpage tracking clinical trials that are violating the FDA Amendment Act (2007) by not having reported any results.  It only became possible to violate the Act this Monday, so the compliance is fairly high so far, nearly 90%.
  • Politician Sam is an expert system from Victoria University Wellington that’s trying to learn NZ political views.  That’s not an unreasonable thing to try, but reading “Unlike a human politician, I consider everyone’s position, without bias, when making decisions” doesn’t make me more optimistic about the project.
  • Which NZ songs get streamed the most here and overseas? Gareth Shute at the Spinoff
  • “Count on Stats” is an effort by the American Statistical Association to rebuild public confidence in US official statistics.
  • Alice Zhao analysed text messages with her (now) husband from the year they married and the year they started dating — a nice illustration of what you can miss by looking at just one source of information.
February 20, 2018

Super 15 Predictions for Round 2

Team Ratings for Round 2

The basic method is described on my Department home page.

Here are the team ratings prior to this week’s games, along with the ratings at the start of the season.


Current Rating Rating at Season Start Difference
Hurricanes 16.18 16.18 0.00
Crusaders 15.23 15.23 0.00
Lions 13.25 13.81 -0.60
Highlanders 10.29 10.29 -0.00
Chiefs 9.29 9.29 0.00
Brumbies 1.75 1.75 0.00
Sharks 1.57 1.02 0.60
Stormers 1.36 1.48 -0.10
Blues -0.24 -0.24 -0.00
Waratahs -3.92 -3.92 -0.00
Jaguares -4.51 -4.64 0.10
Bulls -4.79 -4.79 0.00
Reds -9.47 -9.47 0.00
Rebels -14.96 -14.96 0.00
Sunwolves -18.42 -18.42 0.00


Performance So Far

So far there have been 2 matches played, 2 of which were correctly predicted, a success rate of 100%.
Here are the predictions for last week’s games.

Game Date Score Prediction Correct
1 Stormers vs. Jaguares Feb 17 28 – 20 10.10 TRUE
2 Lions vs. Sharks Feb 17 26 – 19 16.30 TRUE


Predictions for Round 2

Here are the predictions for Round 2. The prediction is my estimated expected points difference with a positive margin being a win to the home team, and a negative margin a win to the away team.

Game Date Winner Prediction
1 Highlanders vs. Blues Feb 23 Highlanders 14.00
2 Rebels vs. Reds Feb 23 Reds -2.00
3 Sunwolves vs. Brumbies Feb 24 Brumbies -16.20
4 Crusaders vs. Chiefs Feb 24 Crusaders 9.40
5 Waratahs vs. Stormers Feb 24 Stormers -1.30
6 Lions vs. Jaguares Feb 24 Lions 21.80
7 Bulls vs. Hurricanes Feb 24 Hurricanes -17.00


February 19, 2018

Ihaka Lecture Series – live and live-streamed in March

The theme of this year’s Ihaka Lecture Series is “A thousand words: Visualising statistical data”. The distillation of data into an honest and compelling graphic is essential component of modern (data) science, and this year, we have three experts exploring different facets of data visualisation.

Each event begins at 6pm in the Large Chemistry Lecture Theatre, Building 301, 23 Symonds Street, Central Auckland, with drinks, nibbles and chat – just turn up – and the talks get underway at 6.30pm. Each one will be live-streamed – details will be on the info pages, the links to which are given below.

On March 7, Professor Dianne Cook from Monash University (right) looks at simple tools for helping to decide if the patterns you think you see in the data are really there. Details. Statschat interviewed Di last year about the woman behind the data work, and it was a very popular read. It’s here. Di’s website is here.

On March 14, Associate Professor Paul Murrell from the Department of Statistics, The University of Auckland (left) will embark on a daring statistical graphics journey featuring the BrailleR package for visually-impaired users, high-performance computing, te reo, and XKCD. Details. Paul was a student when R was being developed by Ross Ihaka and Robert Gentleman, and has been part of the R Core Development team since 1999.

On March 21, Alberto Cairo, the Knight Chair in Visual Journalism at the University of Miami (below right) teaches principles so we all become more critical and better informed readers of charts. This lecture is non-technical – if you have any journalist friends, let them know. Details. His website is here.

The series is named after Ross Ihaka, Associate Professor in the Department of Statistics at the  University of Auckland. Ross, along with Robert Gentleman, co-created R – a statistical programming language now used by the majority of the world’s practicing statisticians. It is hard to over-emphasise the importance of Ross’s contribution to our field, so we named this lecture series in his honour to recognise his work and contributions to our field in perpetuity.


February 17, 2018

Read me first?

There’s a viral story that viral stories are shared by people who don’t actually read them. I saw it again today in a tweet from Newseum Insititute

If you search for the study it doesn’t take long to start suspecting that the majority of news sources sharing this study didn’t read it first.  One that at least links is from the Independent, in June 2016.

The research paper is here. The money quote looks like this, from section 3.3

First, 59% of the shared URLs are never clicked or, as we call them, silent.

We can expand this quotation slightly

First, 59% of the shared URLs are never clicked or, as we call them, silent. Note that we merged URLs pointing to the same article, so out of 10 articles mentioned on Twitter, 6 typically on niche topics are never clicked

That’s starting to sound a bit different. And more complicated.

What the researchers did was to look at bit.ly URLs to news stories from five major sources, and see if they had ever been clicked. They divided the links into two groups: primary URLs tweeted by the media source itself (eg @NYTimes), and secondary URLs tweeted by anyone else. The primary URLs were always clicked at least once — you’d expect that just for checking purposes.  The secondary URLs, as you’d expect, averaged fewer clicks per tweet; 59% were not clicked at all.

That’s being interpreted as if it were 59% of retweets didn’t involve any clicks. But it isn’t. It’s quite likely that most of these links were never retweeted.  And there’s nothing in the data about whether the person who first tweeted the link read the story: there certainly isn’t any suggestion that person didn’t read the story.

So, if I read some annoying story about near-Earth asteroids on the Herald and if tweeted a bit.ly URL, there’s a chance no-one would click on it. And, looking at my Twitter analytics, I can see that does sometimes happen. When it happens, people usually don’t retweet the link either, and it definitely doesn’t go viral.

If I retweeted the official @NZHerald link about the story, then it would almost certainly have been clicked by someone. The research would say nothing whatsoever about the chance that I (or any of the other retweeters) had read it.


February 16, 2018

Best places to retire?

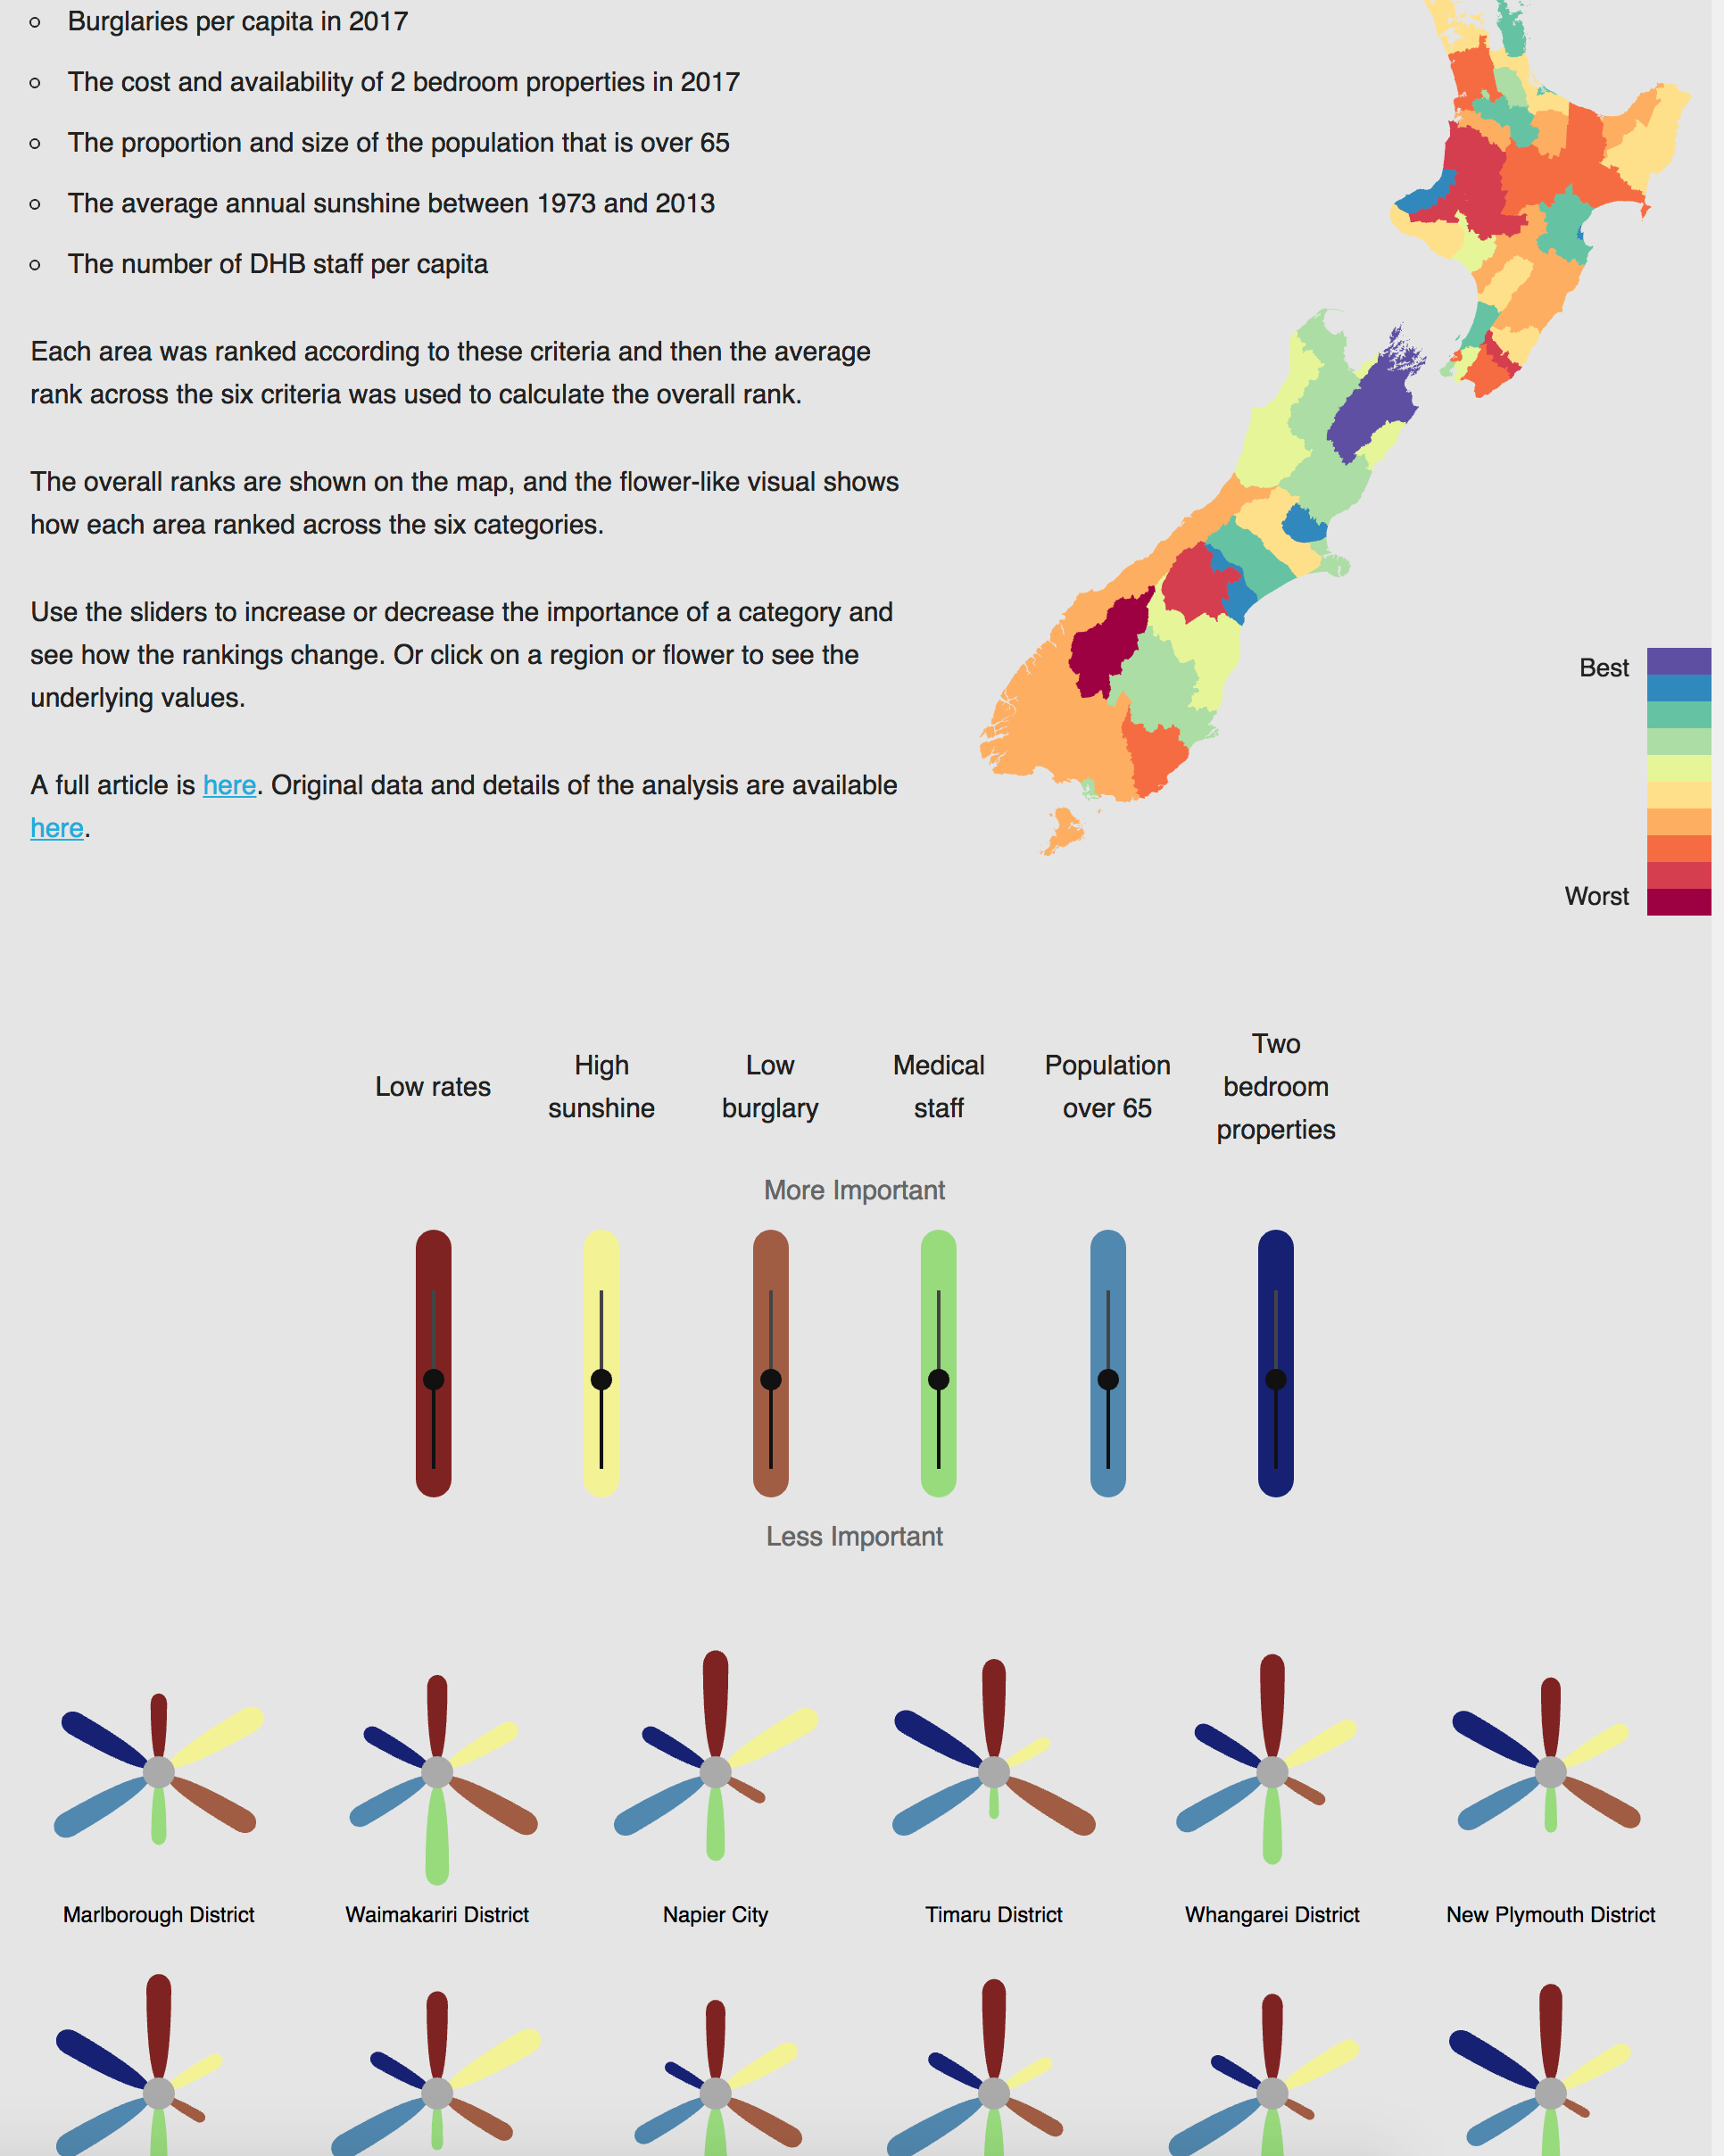
There’s a fun visualisation in the Herald of best places in NZ to retire. Chris Knox’s design lets you adjust the relative importance of a set of factors, and also see which factors are responsible for a good or bad ranking for your favorite region. For nerds, he’s even put up the code and data.

If you play around with the sliders enough, you can get Dunedin or Christchurch to the top, but you can’t get Auckland or Wellington there. Since about 30% of people over 65 actually do live in those two cities, there’s presumably some important decision factors that are left out and that would make cities look better if they were put in.

There’s at least two sorts of factors. First, that many people live in cities. You might well want to retire somewhere close to your friends and whānau.  Second, that you want the amenities of a city: public transport, taxis, libraries, cinemas, museums, stadiums, fair-quality cheap restaurants.

The interactive is just for fun, but similar principles apply to serious decision-making tools.  The ‘best’ decision depends a lot on your personal criteria for ‘best’, and oversimplifying these criteria will give you something that looks like an objective, data-based policy choice, but really isn’t.

February 14, 2018

Most inaccurate media number ever?

In 2012, the Telegraph and other UK papers were off by five orders of magnitude when they said there were only 100 adult cod in the North Sea. The Washington Post beats that easily.

Quantum computers are straight out of science fiction. Take the “traveling salesman problem,” where a salesperson has to visit a specific set of cities, each only once, and return to the first city by the most efficient route possible. As the number of cities increases, the problem becomes exponentially complex. It would take a laptop computer 1,000 years to compute the most efficient route between 22 cities, for example. A quantum computer could do this within minutes, possibly seconds.

As mathematician Bill Cook pointed out on Twitter, his iMac can solve a 22-city problem in 0.005 seconds, roughly six trillion times faster than the Washington Post claims.  It looks as though the writer has assumed there is no more efficient algorithm than just trying all the possible routes, one at a time.  At one billion attempts per second, that would take on the order of a thousand years.  In fact, there are more efficient algorithms, it’s just that these algorithms also get very slow as the number of points increases. Prof Cook estimates in the twitter thread that 1000 CPU-years might allow a 100,000-point problem to be solved: six trillion times more computing gets you only a 5000-fold increase in the number of points.

For the cryptographic problems that are the actual point of the story, fast quantum algorithms are known. If large enough quantum computers can be built, these security protections are toast. And as the story says, there’s research going on now to find replacements if/when they’re needed (though what the story says about those algorithms is almost completely unhelpful).  But the travelling salesman problem is not one of the ones for which fast quantum algorithms are known. On the contrary, there are reasons to suspect fast quantum algorithms don’t even exist for “NP-complete” problems such as the travelling salesman.


Update: Scott Aaronson, who knows from quantum, is Not Impressed.

February 13, 2018

Super 15 Predictions for Round 1

Team Ratings for Round 1

The basic method is described on my Department home page.

Here are the team ratings prior to this week’s games, along with the ratings at the start of the season.

Current Rating Rating at Season Start Difference
Hurricanes 16.18 16.18 0.00
Crusaders 15.23 15.23 0.00
Lions 13.81 13.81 0.00
Highlanders 10.29 10.29 -0.00
Chiefs 9.29 9.29 0.00
Brumbies 1.75 1.75 0.00
Stormers 1.48 1.48 -0.00
Sharks 1.02 1.02 0.00
Blues -0.24 -0.24 -0.00
Waratahs -3.92 -3.92 -0.00
Jaguares -4.64 -4.64 0.00
Bulls -4.79 -4.79 0.00
Reds -9.47 -9.47 0.00
Rebels -14.96 -14.96 0.00
Sunwolves -18.42 -18.42 0.00


Predictions for Round 1

Here are the predictions for Round 1. The prediction is my estimated expected points difference with a positive margin being a win to the home team, and a negative margin a win to the away team.

Game Date Winner Prediction
1 Stormers vs. Jaguares Feb 17 Stormers 10.10
2 Lions vs. Sharks Feb 17 Lions 16.30