Posts from August 2017 (43)

August 16, 2017

Seatbelts save (some) lives

It’s pretty standard that headlines (and often politicians) overstate the likely effect of road safety precautions — eg, the claim that lowering the blood alcohol limit would prevent all deaths in which drivers were over the limit, which it obviously won’t.

This is from the Herald’s front page.

belt

On the left, the number 94 is the number of people who died in crashes while not wearing seatbelts. On the right (and in the story), the we find that this is about a third of all the deaths. It’s quite possible to wear a seatbelt and still die in a crash.

Looking for research, I found this summary from a UK organisation that does independent reviews on road safety issues. They say seatbelts in front seats prevent about 45% of fatal injuries in front seat passengers. For rear-seat passengers the data are less clear.

So, last year probably about 45 people died on our roads because they weren’t wearing seatbelts. That’s a big enough number to worry about: we don’t need to double it.

August 15, 2017

Emoji backlash?

Q: Did you see that using emoji in work-related emails could hurt your career?

A:😕

Q: Yes, it’s apparently a common email mistake

A: 😯

Q: The 549 study participants from 29 countries “were asked to read a work-related email from an unknown person, and were asked to evaluate the competence and warmth of the sender”

A:🤔 💻 🇹🇷

Q: Yes, they were from Amazon’s Mechanical Turk (paper)

A: 😕

Q: Ok, so they weren’t really work-related emails from someone they’d never met, in another country. But the participants were told to pretend they were.

A: 🙁

Q: And it undermined information sharing

A: 😕 👥 💻 🤐 ?

Q: The email replies to messages with emoji had fewer words in them on average

A: 🤔 🙂

Q: Ok, yes, that’s not necessarily a bad thing.

A: 👩‍💼👨🏽‍💼🗣 😀 ?

Q: Is it really common to use emoji in business email? Yes, they say nearly 20% of emails in one previous sample included emoji.

A: 🙄 🇬🇸🇸🇱🇸🇬🇸🇳🇸🇦 👩‍💼👨🏽‍💼🗣 😀 ?

Q: No, I suppose that wasn’t international emails between people who had never met or corresponded before.

A: 🙄

Q: So using emoji in formal emails to a complete stranger could be a bad idea?

A: 😴


NRL Predictions for Round 24

Team Ratings for Round 24

The basic method is described on my Department home page.

Here are the team ratings prior to this week’s games, along with the ratings at the start of the season.

Current Rating Rating at Season Start Difference
Storm 10.10 8.49 1.60
Broncos 8.52 4.36 4.20
Raiders 5.81 9.94 -4.10
Cowboys 3.91 6.90 -3.00
Panthers 3.40 6.08 -2.70
Roosters 1.71 -1.17 2.90
Sharks 1.44 5.84 -4.40
Sea Eagles -0.35 -2.98 2.60
Dragons -0.69 -7.74 7.00
Eels -0.83 -0.81 -0.00
Rabbitohs -1.77 -1.82 0.00
Wests Tigers -4.19 -3.89 -0.30
Warriors -6.01 -6.02 0.00
Bulldogs -6.99 -1.34 -5.70
Knights -7.19 -16.94 9.70
Titans -8.92 -0.98 -7.90


Performance So Far

So far there have been 168 matches played, 102 of which were correctly predicted, a success rate of 60.7%.
Here are the predictions for last week’s games

Game Date Score Prediction Correct
1 Rabbitohs vs. Bulldogs Aug 10 28 – 14 7.70 TRUE
2 Eels vs. Knights Aug 11 10 – 29 15.00 FALSE
3 Broncos vs. Sharks Aug 11 32 – 10 8.40 TRUE
4 Dragons vs. Titans Aug 12 42 – 16 9.10 TRUE
5 Storm vs. Roosters Aug 12 16 – 13 13.60 TRUE
6 Panthers vs. Cowboys Aug 12 24 – 16 2.00 TRUE
7 Warriors vs. Raiders Aug 13 16 – 36 -5.50 TRUE
8 Wests Tigers vs. Sea Eagles Aug 13 30 – 26 -1.20 FALSE


Predictions for Round 24

Here are the predictions for Round 24. The prediction is my estimated expected points difference with a positive margin being a win to the home team, and a negative margin a win to the away team.

Game Date Winner Prediction
1 Eels vs. Titans Aug 17 Eels 11.60
2 Rabbitohs vs. Warriors Aug 18 Rabbitohs 8.20
3 Broncos vs. Dragons Aug 18 Broncos 12.70
4 Knights vs. Storm Aug 19 Storm -13.80
5 Roosters vs. Wests Tigers Aug 19 Roosters 9.40
6 Cowboys vs. Sharks Aug 19 Cowboys 6.00
7 Raiders vs. Panthers Aug 20 Raiders 5.90
8 Bulldogs vs. Sea Eagles Aug 20 Sea Eagles -3.10


Currie Cup Predictions for Round 6

Team Ratings for Round 6

The basic method is described on my Department home page.

Here are the team ratings prior to this week’s games, along with the ratings at the start of the season.

Current Rating Rating at Season Start Difference
Cheetahs 4.88 4.33 0.50
Lions 4.54 7.41 -2.90
Sharks 3.67 2.15 1.50
Western Province 2.47 3.30 -0.80
Blue Bulls 1.90 2.32 -0.40
Griquas -10.00 -11.62 1.60
Pumas -10.20 -10.63 0.40


Performance So Far

So far there have been 15 matches played, 10 of which were correctly predicted, a success rate of 66.7%.
Here are the predictions for last week’s games.

Game Date Score Prediction Correct
1 Lions vs. Sharks Aug 12 31 – 47 6.80 FALSE
2 Western Province vs. Blue Bulls Aug 12 45 – 34 3.90 TRUE
3 Cheetahs vs. Griquas Aug 12 25 – 30 20.90 FALSE


Predictions for Round 6

Here are the predictions for Round 6. The prediction is my estimated expected points difference with a positive margin being a win to the home team, and a negative margin a win to the away team.

Game Date Winner Prediction
1 Western Province vs. Lions Aug 18 Western Province 2.40
2 Blue Bulls vs. Cheetahs Aug 19 Blue Bulls 1.50
3 Griquas vs. Pumas Aug 20 Griquas 4.70


August 14, 2017

Meters and litres

There have been a surprisingly large number of order-of-magnitude errors by people you’d expect to know better when commenting on Labour’s proposed water policy.  The Greens, last month, proposed a 10c/litre charge on water for bottling.  Labour are proposing a variable charge from one or two cents per cubic metre on irrigation up to “cents per litre, not ten cents” for bottled water not taken from a mains supply.

The conversion is fairly simple: 10c per litre is $100 per cubic metre, 1c per litre is $10 per cubic metre, one-one thousandth of a cent per litre is 1c per cubic metre.

How much does that come to for a cabbage or a carton of milk? According to Daniel Collins, the water taken from rivers or aquifers to produce a litre of milk varies from about 1L in the Waikato to about 250L in the Canterbury plains (you’ll see figures of 1000L, but these include needs met from local rainfall) .  So a 1c or 2c per cubic metre water charge would come out to less than a cent per litre of milk.

On the other hand, most of our milk isn’t produced for local consumption but for export as milk solids, at a bit more than 11 L of milk per kilogram.  At Canterbury water consumption, a 2c charge works out as about 6 cents per kg of milk solids. One Canterbury dairy farmer on Twitter estimated about twice that based on his production and consumption, so we’re at the right order of magnitude. Fonterra is currently paying $6.75 per kilogram of milk solids.

Horticulture is the other use that’s been in the news.  I found an estimate that, it takes 237L of water to produce 1kg of cabbage, ie, less than a quarter of a cubic metre, so less than 1 cent. Maybe NZ horticulture is less water-efficient than the average for the world, but that estimate, again, counts rainfall.

It’s hard to get up-to-date data, but in 2010 the total water use consented for horticulture, orchards, and viticulture was about 800 million cubic metres (PDF, table C-21), which would cost $8 million at 1c/cubic metre or $16 million at 2c/cubic metre; the amount actually used was lower.  In 2010, Horticulture NZ said the total production of the sector was worth $6 billion.

According to StatsNZ, total water for irrigation, other farming uses,  and industrial uses was consented at a maximum of about 8.5 billion cubic metres last year.  At 2c per cubic metre that would be 17 billion cents, or $170 million, if all the consented volume was taken and if there was no reduction in use as a result of charging.  Some fraction of the water would be priced a lot higher, and Labour is saying “less than $500 milllion“, which looks plausible.  That’s a fair sum of money, but it’s about two-thirds of one percent of Crown Revenue.

The cost to the water-using industries of a water charge isn’t trivial;  they’re going to notice the increase in their costs; this isn’t free money for the government or the taxpayer. I’m not going to comment on whether this is a good policy; that’s outside my expertise. But, some of the claims about costs have been off by huge factors, and people should be able to do basic maths better than that.

 

Belated Currie Cup Predictions for Round 5

What Happened?

My apologies for the late predictions. Note first of all that they are exactly as I would have made them prior to the games being played because I just run my programs to implement the prediction algorithm. The results should help you believe that, I only got two correct.

Why did I miss this? I never expected such a schedule with some teams playing 3 games in 8 days, not to mention the Lions having only two games in 8 days apart and the Pumas only having to play 2 games.

Are there any more weeks like that? Surely this has been controversial in South Africa.

Team Ratings for Round 5

The basic method is described on my Department home page.

Here are the team ratings prior to this week’s games, along with the ratings at the start of the season.

Current Rating Rating at Season Start Difference
Cheetahs 5.66 4.33 1.30
Lions 5.25 7.41 -2.20
Sharks 2.96 2.15 0.80
Blue Bulls 2.46 2.32 0.10
Western Province 1.91 3.30 -1.40
Pumas -10.20 -10.63 0.40
Griquas -10.78 -11.62 0.80


Performance So Far

So far there have been 12 matches played, 9 of which were correctly predicted, a success rate of 75%.
Here are the predictions for last week’s games.

Game Date Score Prediction Correct
1 Blue Bulls vs. Sharks Aug 09 20 – 28 5.00 FALSE
2 Pumas vs. Cheetahs Aug 09 34 – 45 -11.40 TRUE
3 Griquas vs. Western Province Aug 09 44 – 34 -9.50 FALSE


Predictions for Round 5

Here are the predictions for Round 5. The prediction is my estimated expected points difference with a positive margin being a win to the home team, and a negative margin a win to the away team.

Game Date Winner Prediction
1 Lions vs. Sharks Aug 12 Lions 6.80
2 Western Province vs. Blue Bulls Aug 12 Western Province 3.90
3 Cheetahs vs. Griquas Aug 12 Cheetahs 20.90


Stat of the Week Competition: August 12 – 18 2017

Each week, we would like to invite readers of Stats Chat to submit nominations for our Stat of the Week competition and be in with the chance to win an iTunes voucher.

Here’s how it works:

  • Anyone may add a comment on this post to nominate their Stat of the Week candidate before midday Friday August 18 2017.
  • Statistics can be bad, exemplary or fascinating.
  • The statistic must be in the NZ media during the period of August 12 – 18 2017 inclusive.
  • Quote the statistic, when and where it was published and tell us why it should be our Stat of the Week.

Next Monday at midday we’ll announce the winner of this week’s Stat of the Week competition, and start a new one.

(more…)

Stat of the Week Competition Discussion: August 12 – 18 2017

If you’d like to comment on or debate any of this week’s Stat of the Week nominations, please do so below!

August 11, 2017

Different sorts of graphs

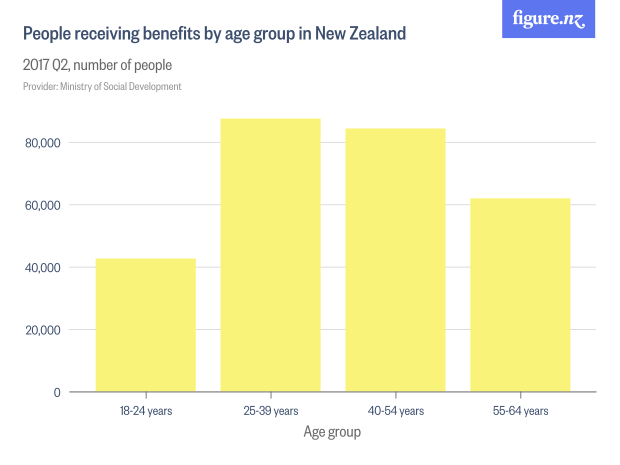
This bar chart from Figure.NZ was in Stuff today, with the lead

Working-age people receiving benefits are mostly in the prime of our working life – the ages of 25 to 54.

19205831

The numbers are correct, but the extent to which the graph fits the story is a bit misleading.  The main reason the two bars in the middle are higher is that they are 15-year age groups, when the first bar is a 7-year group and the last is a ten-year group.

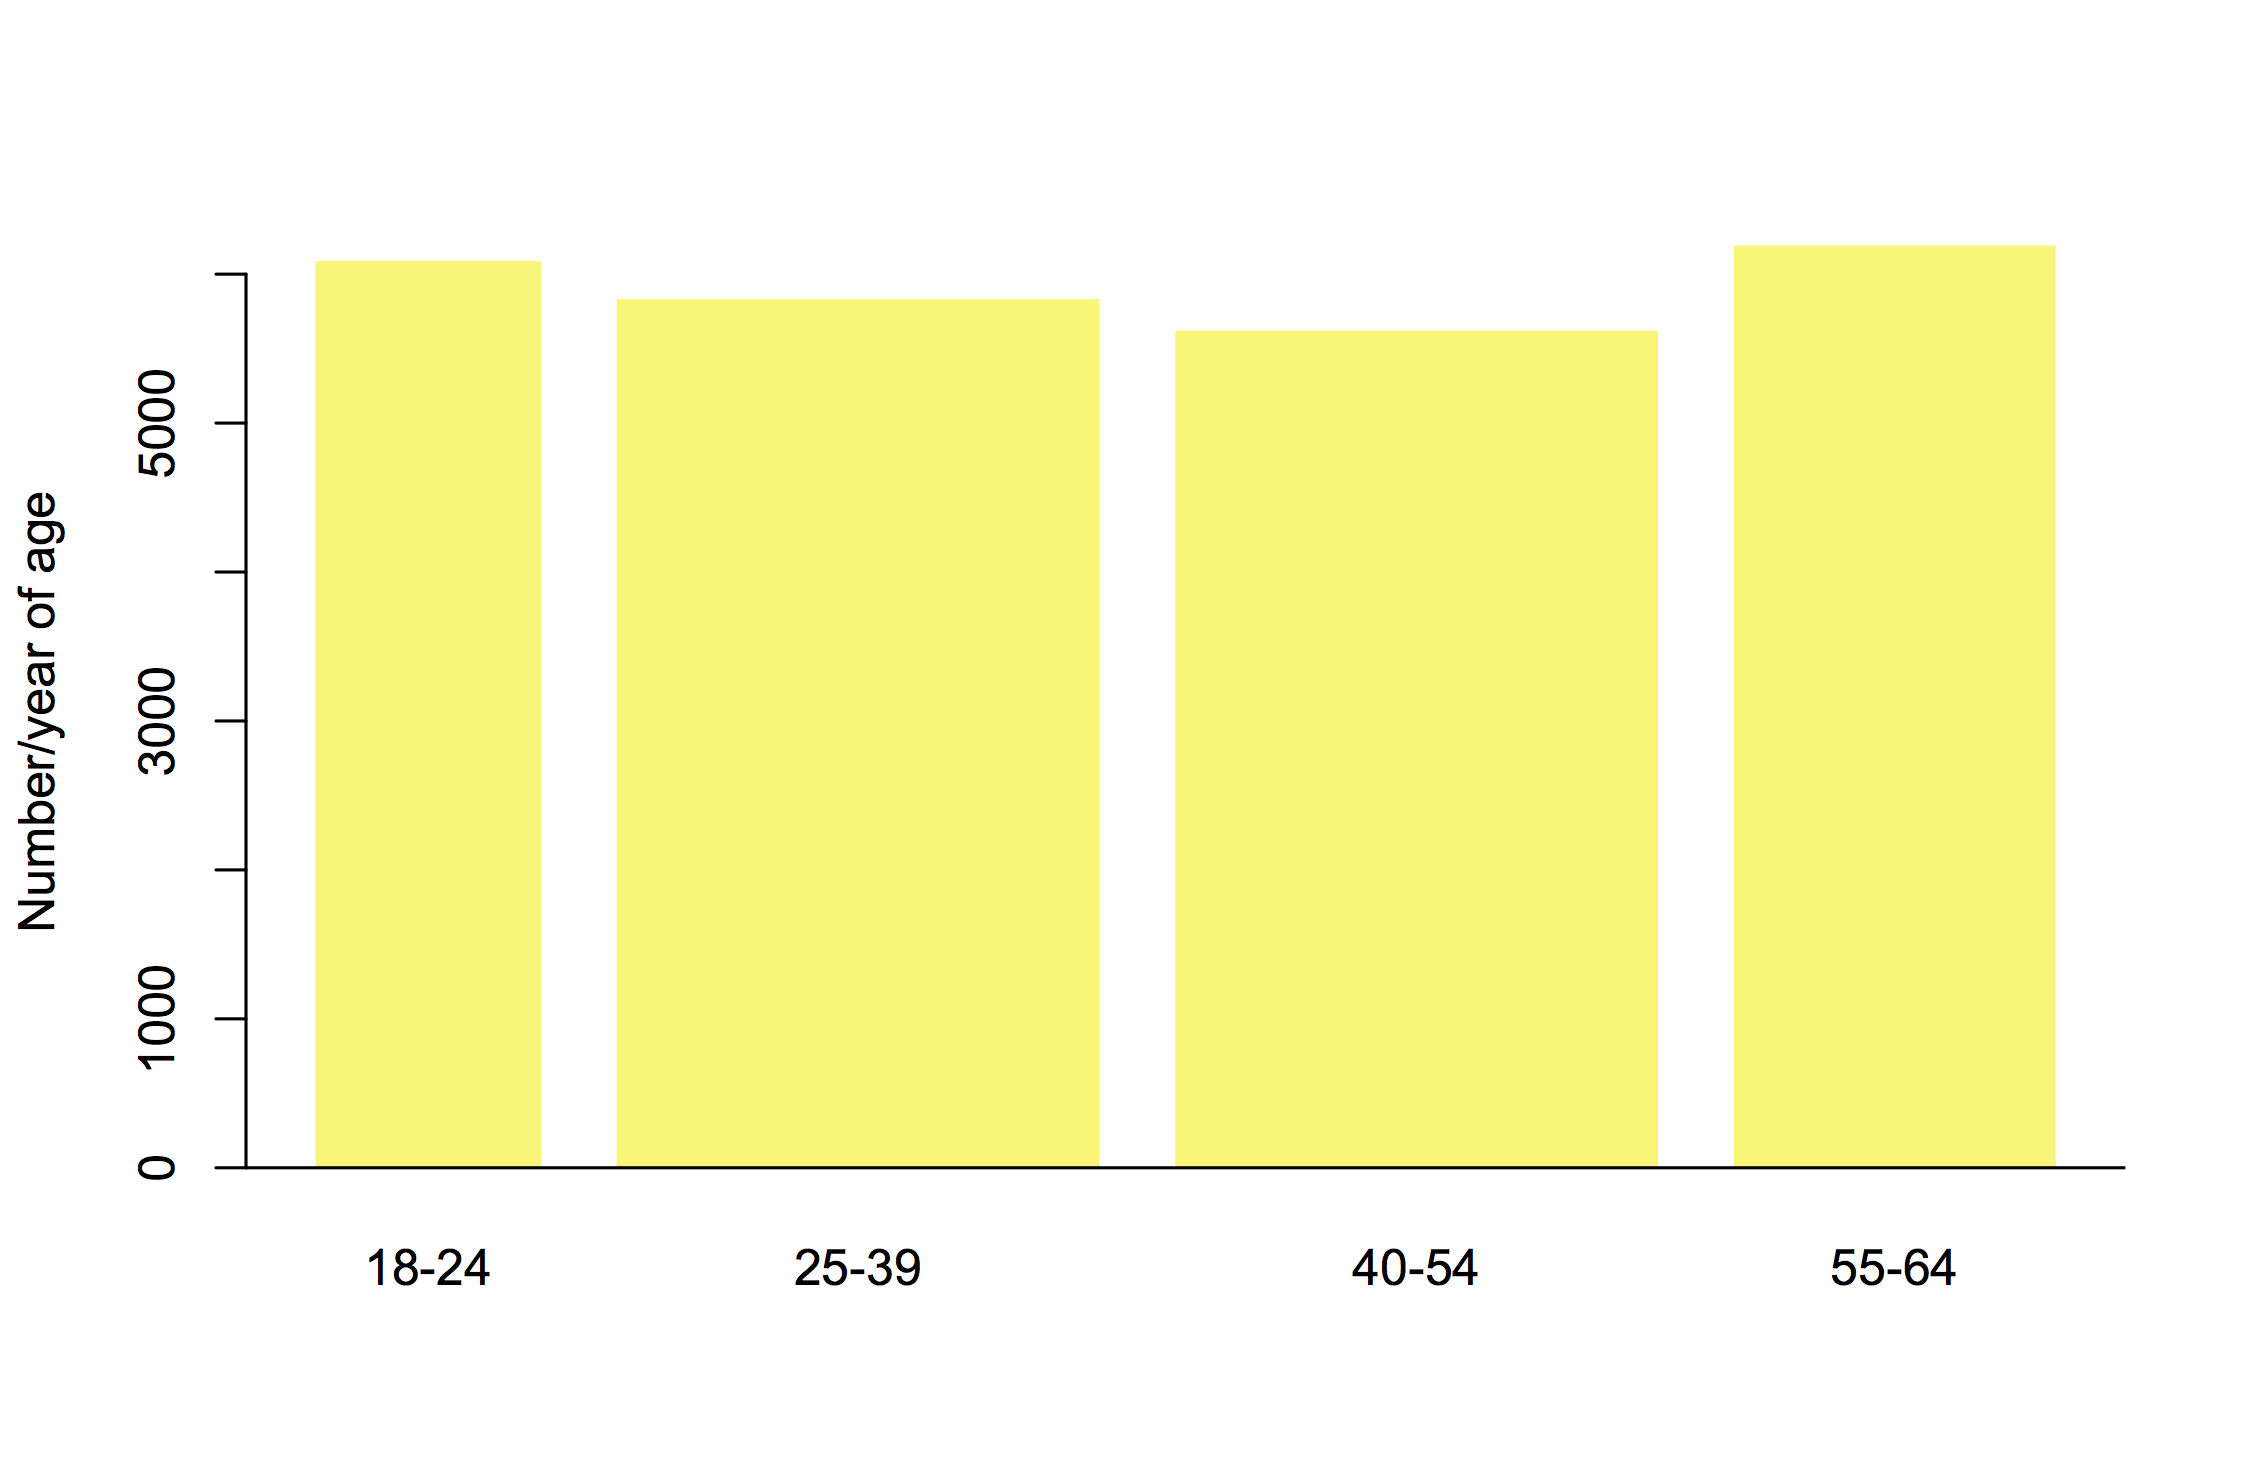
Another way to show the data is to scale the bar widths proportional to the number of years and then scale the height so that the bar area matches the count of people. The bar height is now counts of people per year of age

benefits

This is harder to read for people who aren’t used to it, but arguably more informative. It suggests the 25-54 year groups may be the largest just because the groups are wider.

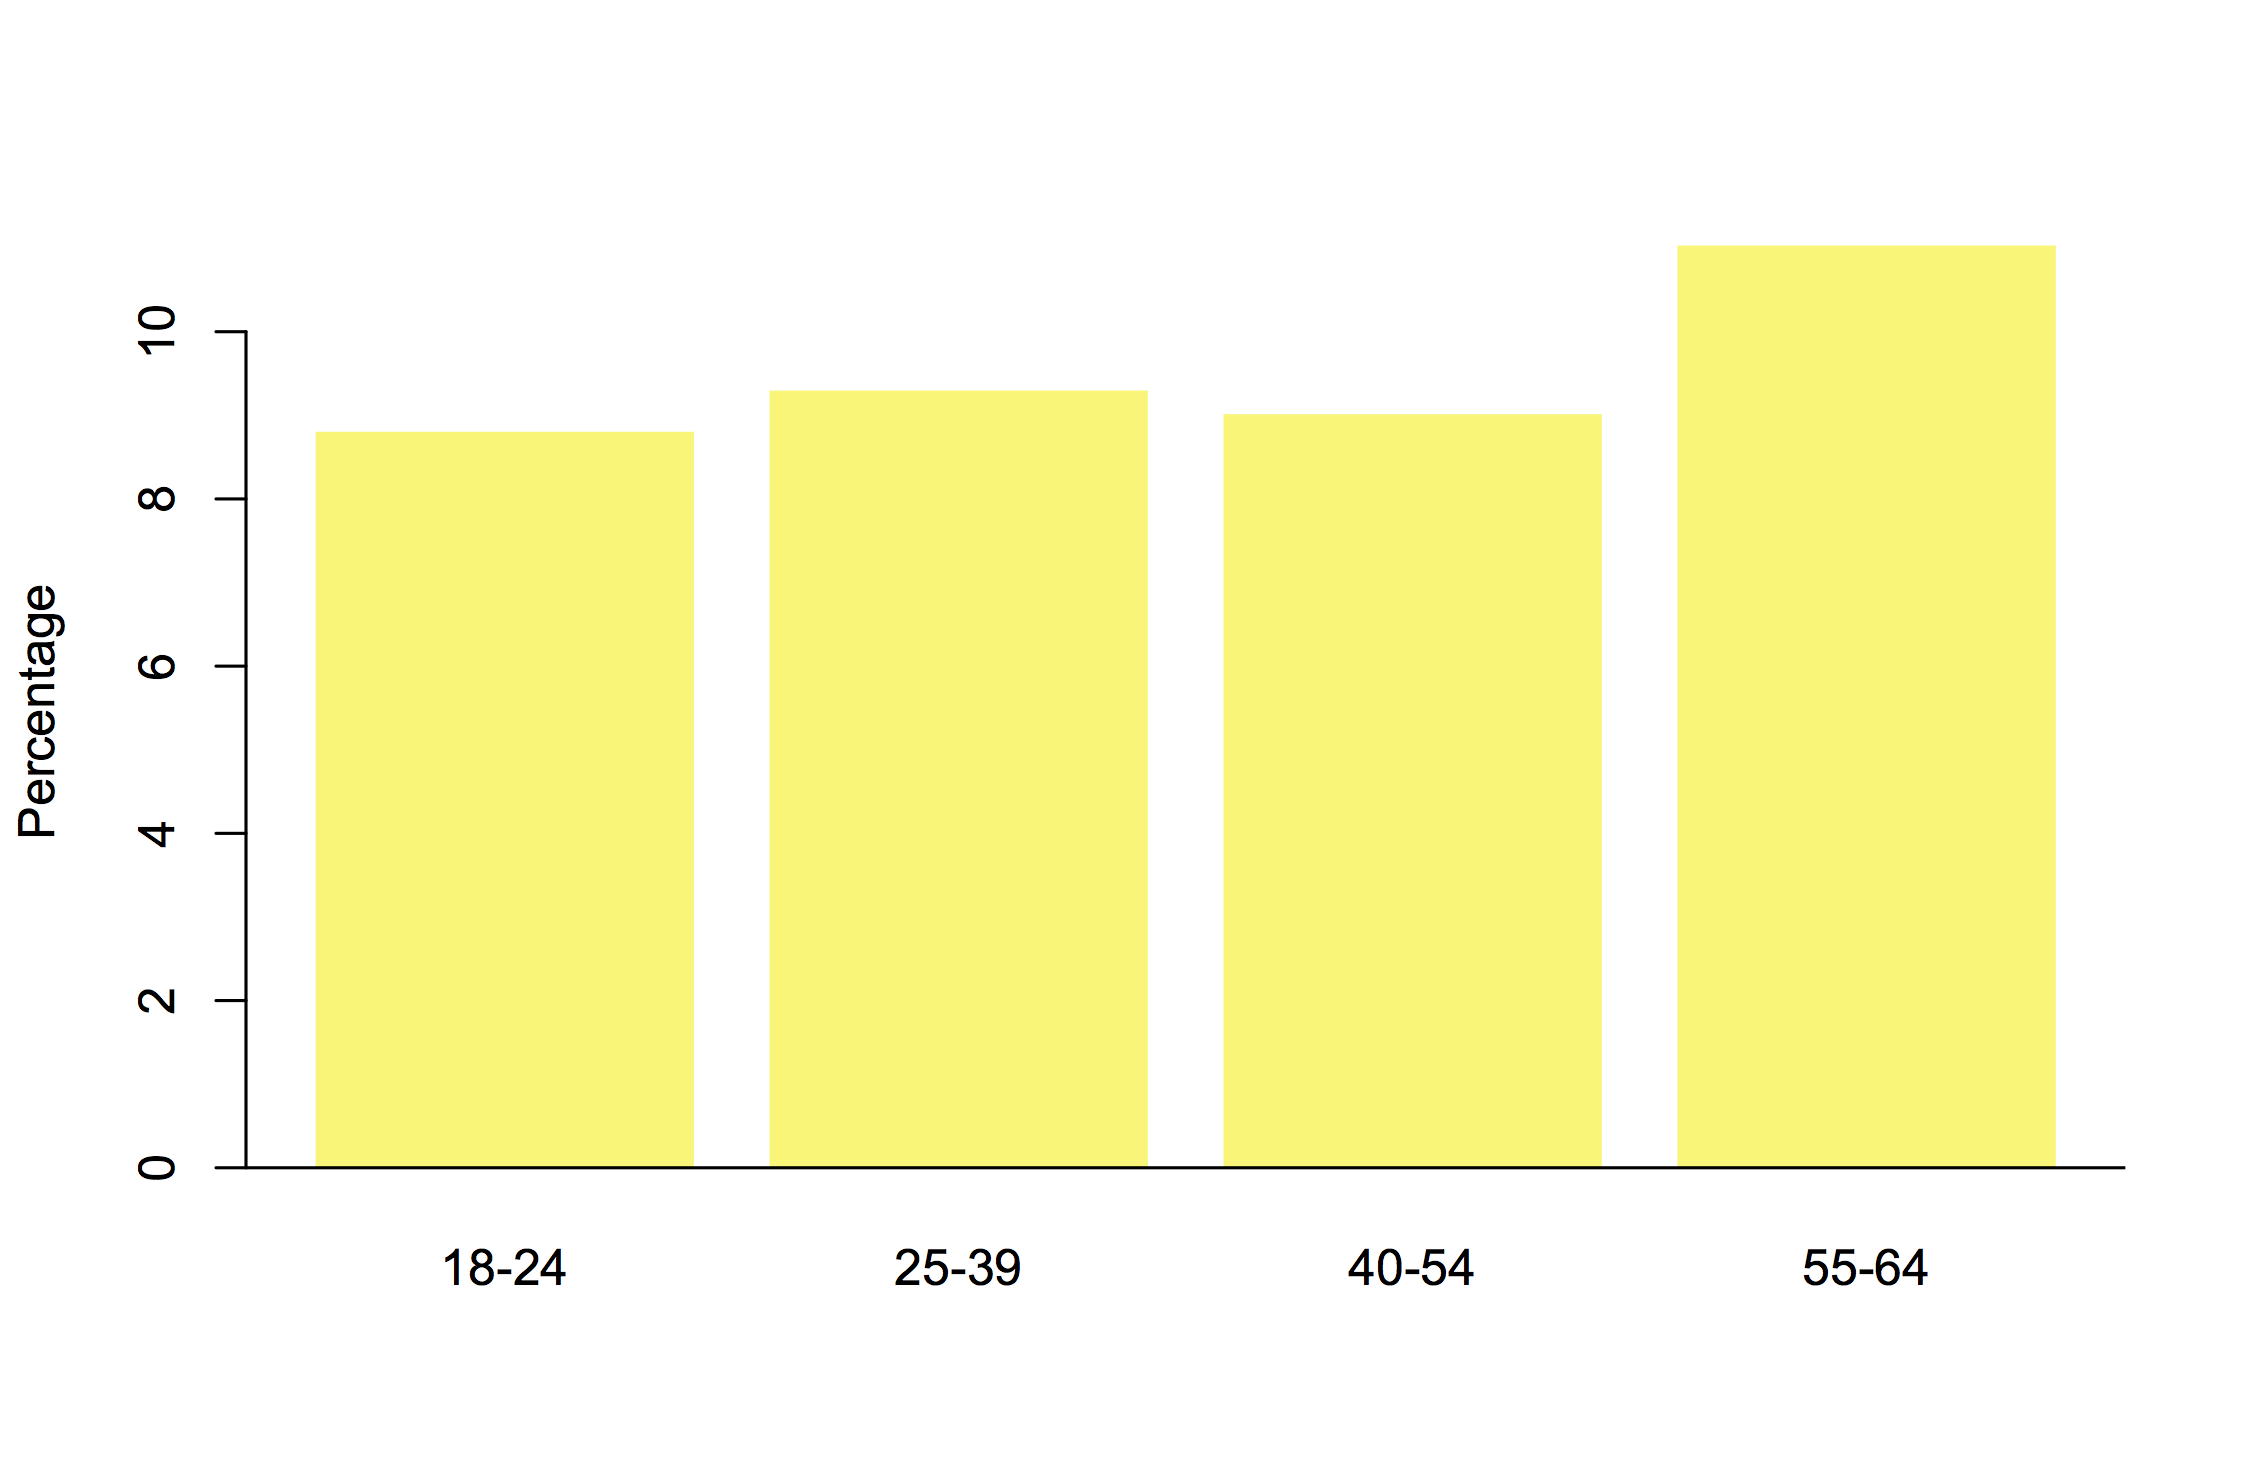
We really need population size data, since the number of people in NZ also varies by age group.  Showing the percentage receiving benefits in each age group gives a different picture again

benpop

It looks as though

  • “working age” people 25-39 and 40-54 make up a larger fraction of those receiving benefits than people 18-24 or 55-64
  • a person receiving benefits is more likely to be, say, 20 or 60 than 35 or 45.
  • the proportion of people receiving benefits increases with age

These can all be true; they’re subtly different questions. Part of the job of a statistician is to help you think about which one you wanted to ask.

August 9, 2017

Briefly

  • From econ blog “Worthwhile Canadian Initiative”:  “The fraction of children earning more than their parents fell from approximately 90% for children born in 1940 to around 50% for children entering the labor market today. Not children. Boys, perhaps, but not children. “
  • From North and South, a story on what direct-to-consumer genetic testing might be good for.
  • There are lots of websites with useful and interesting data out there, but you need to worry about what the data mean. Kaiser Fung has an example from a Kaggle challenge involving Hollywood movies “Huge alarm bells should be going off in the analyst’s head right around now. There were only eleven movies about vampires? Only eleven martial arts movies? Only twelve movies involving superheroes?” (via Andrew Gelman)
  • Wired magazine reprints a Harper’s story about that 1984 revolution in numerical computing, the spreadsheet. “It is not far-fetched to imagine that the introduction of the electronic spreadsheet will have an effect like that brought about by the development during the Renaissance of double-entry bookkeeping. ” If anything, an underestimate.