Posts from May 2017 (30)

May 10, 2017

Briefly

  • “What CPE—and the field—needs now are analysts. Lots and lots of analysts. And we, at least, are hiring DataNerds who want to be JusticeNerds™. With departments now coming in by the state-load, we are inundated with confidential data that needs to be interrogated so that we can answer some of the most fundamental questions in policingfrom Phil Goff (no, not that one) at the Center for Policing Equity, via mathbabe.org
  • If someone claims your female developers are promoted less because they’re treated worse at code review, and you say “no, they’re treated worse because they’re more junior”, you’ve made the basic causal-inference error of conditioning on an intermediate consequence of your input variable.  Felix Salmon on Facebook’s example
  • “For too long social welfare has muddled along with bipartisan policies like shouting at the jobless or not helping people with mental health issues, without really checking if those methods work.” This, from, Lyndon Hood, isn’t going where you might expect.  It’s unfair, but not completely unfair.
  • Another reason ‘breakthrough’ science stories may be misleading: there was a research paper claiming fish preferentially eat microplastic pollution and are serious harmed by it. It has been retracted. There are allegations of deliberate fraud; the data were certainly not made available as the journal’s policy demanded.  If you remember a story on this, go back and see if the same media outlet covers the retraction.
  • I’ve written a few times about the bogus claim that the typical Kiwi pays no “net tax”.  In the other direction, there were stories about  “Tax Freedom Day” this week, on the basis of 34.8% of income going in tax. Yeah, nah.
  • Derek Lowe writes about a new analysis looking at solanezumab, Eli Lilly’s failed treatment for Alzheimer’s. The analysis claims that if the drug had been approved based on the early, weak signals of benefit, the cost to the US government would have been about ten billion dollars over the past four years. That would pay for a lot of trials, or for a lot of other improvements to dementia care.
  • There’s publication bias in research on stock-market patterns. Because of course there is.

This was almost too good to check


And this was too good to ask if it’s a joke:

bf789b08ec6bdc9e30c0f1e9995559be

(it is)

May 9, 2017

Super 18 Predictions for Round 12

Team Ratings for Round 12

The basic method is described on my Department home page.

Here are the team ratings prior to this week’s games, along with the ratings at the start of the season.

Current Rating Rating at Season Start Difference
Hurricanes 17.39 13.22 4.20
Crusaders 13.87 8.75 5.10
Highlanders 9.17 9.17 0.00
Chiefs 8.54 9.75 -1.20
Lions 8.36 7.64 0.70
Blues 3.47 -1.07 4.50
Brumbies 2.02 3.83 -1.80
Sharks 1.40 0.42 1.00
Stormers 0.63 1.51 -0.90
Waratahs -0.91 5.81 -6.70
Jaguares -2.84 -4.36 1.50
Bulls -4.48 0.29 -4.80
Force -8.96 -9.45 0.50
Cheetahs -9.47 -7.36 -2.10
Reds -10.60 -10.28 -0.30
Kings -13.37 -19.02 5.70
Rebels -14.52 -8.17 -6.40
Sunwolves -16.80 -17.76 1.00


Performance So Far

So far there have been 87 matches played, 67 of which were correctly predicted, a success rate of 77%.
Here are the predictions for last week’s games.

Game Date Score Prediction Correct
1 Hurricanes vs. Stormers May 05 41 – 22 21.00 TRUE
2 Cheetahs vs. Highlanders May 05 41 – 45 -16.10 TRUE
3 Rebels vs. Lions May 06 10 – 47 -16.40 TRUE
4 Chiefs vs. Reds May 06 46 – 17 22.30 TRUE
5 Waratahs vs. Blues May 06 33 – 40 0.50 FALSE
6 Sharks vs. Force May 06 37 – 12 12.90 TRUE
7 Bulls vs. Crusaders May 06 24 – 62 -11.10 TRUE
8 Jaguares vs. Sunwolves May 06 46 – 39 19.50 TRUE


Predictions for Round 12

Here are the predictions for Round 12. The prediction is my estimated expected points difference with a positive margin being a win to the home team, and a negative margin a win to the away team.

Game Date Winner Prediction
1 Blues vs. Cheetahs May 12 Blues 16.90
2 Brumbies vs. Lions May 12 Lions -2.30
3 Crusaders vs. Hurricanes May 13 Hurricanes -3.50
4 Rebels vs. Reds May 13 Reds -0.40
5 Bulls vs. Highlanders May 13 Highlanders -9.70
6 Kings vs. Sharks May 13 Sharks -11.30
7 Jaguares vs. Force May 13 Jaguares 10.10


May 8, 2017

Stat of the Week Competition: May 6 – 12 2017

Each week, we would like to invite readers of Stats Chat to submit nominations for our Stat of the Week competition and be in with the chance to win an iTunes voucher.

Here’s how it works:

  • Anyone may add a comment on this post to nominate their Stat of the Week candidate before midday Friday May 12 2017.
  • Statistics can be bad, exemplary or fascinating.
  • The statistic must be in the NZ media during the period of May 6 – 12 2017 inclusive.
  • Quote the statistic, when and where it was published and tell us why it should be our Stat of the Week.

Next Monday at midday we’ll announce the winner of this week’s Stat of the Week competition, and start a new one.

(more…)

Stat of the Week Competition Discussion: May 6 – 12 2017

If you’d like to comment on or debate any of this week’s Stat of the Week nominations, please do so below!

May 4, 2017

Summarising a trend

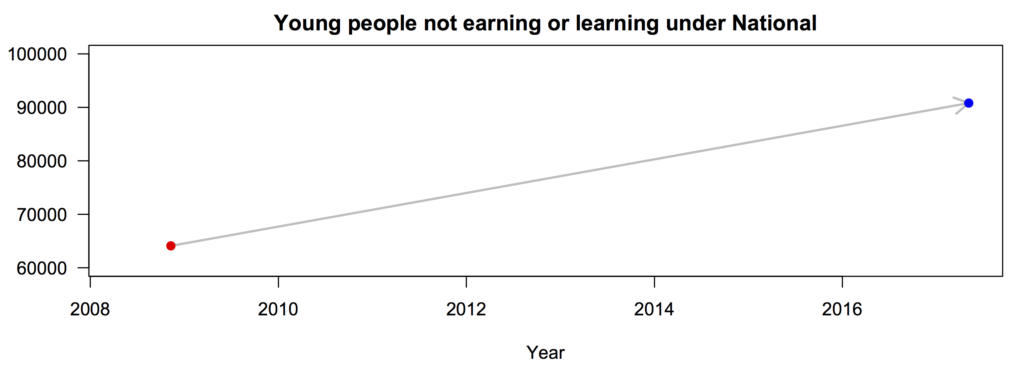
Keith Ng drew my attention on Twitter to an ad from Labour saying “Under National, the number of young people not earning or learning has increased by 41%”.

When you see this sort of claim, you should usually expect two things: first, that the claim will be true in the sense that there will be two numbers that differ by 41%; second, that it will not be the most informative summary of the data in question.

If you look on Infoshare, in the Household Labour Force Survey, you can find data on NEET (not in education, employment, or training).  The number was 64100 in the fourth quarter of 2008, when Labour lost the election.  It’s now (Q1, 2017) 90800, which is, indeed, 41% higher.  Let’s represent the ad by a graph:

neet1


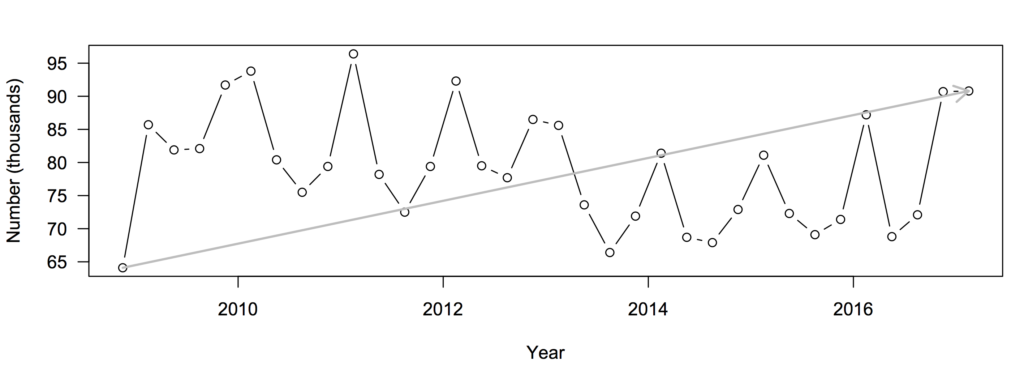
We can fill in the data points in between:
neet2
Now, the straight line doesn’t look as convincing.

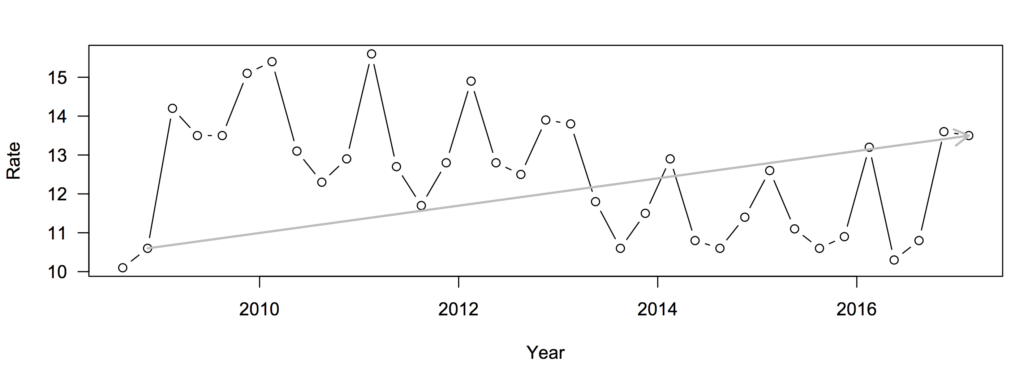
Also, why are we looking at the number, when population has changed over this time period. We really should care about the rate (percentage)
neet3
Measuring in terms of rates the increase is smaller — 27%.  More importantly, though, the rate was even higher at the end of the first quarter of National’s administration than it is now.

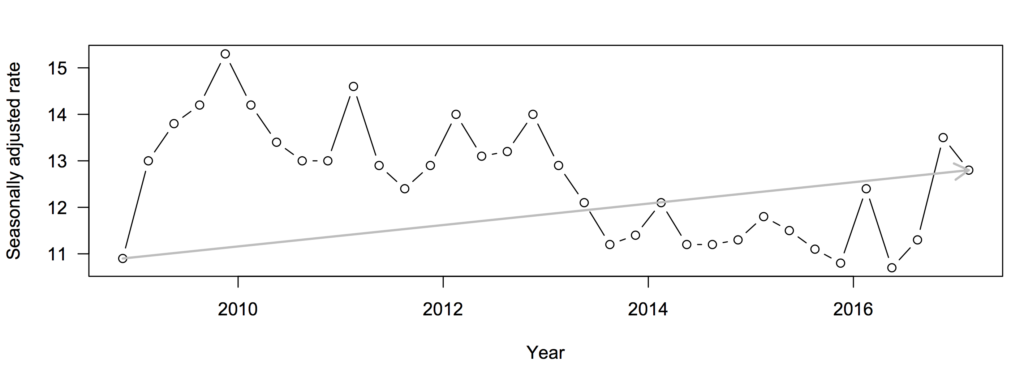
The next thing to notice is the spikes every four quarters or so: NEET is higher in the summer and lower in the winter because of the school  year.  You might wonder if StatsNZ had produced a seasonally adjusted version, and whether it was also conveniently on Infoshare…
need4
The increase is now 17%

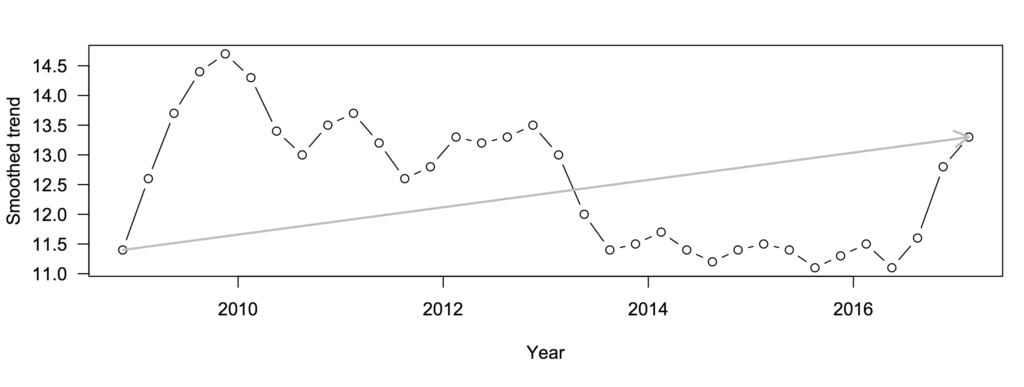
But for long-term comparisons of policy, you’d probably want a smoothed version that incorporates more than one quarter of data. It turns out that StatsNZ have done this, too, and it’s on Infoshare.
neet5
The increase is, again 17%. Taking out the seasonal variation, short-term variation, and sampling noise makes the underlying pattern clearer.  NEET increased dramatically in 2009, decreased, and has recently spiked. The early spike may well have been the recession, which can’t reasonably be blamed on any NZ party.  The recent increase is worrying, but thinking of it as trend over 9 years isn’t all that helpful.

May 3, 2017

A century of immigration

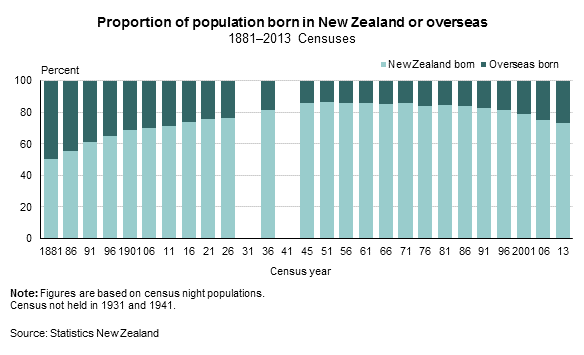
Given the discussions of immigration in the past weeks, I decided to look for some historical data.  Stats NZ has a report “A Century of Censuses”, with a page on ‘proportion of population born overseas.” Here’s the graph

nz-oseas-born

The proportion of immigrants has never been very low, but it fell from about 1 in 2 in the late 19th century to about 1 in 6 in the middle of the 2oth century, and has risen to about 1 in 4 now. The increase has been going on for the entire lifetime of any NZ member of Parliament; the oldest was born roughly at Peak Kiwi in the mid-1940s.

Seeing that immigrants have been a large minority of New Zealand for over a century doesn’t necessarily imply anything about modern immigration policy — Hume’s Guillotine, “no ought deducible from is,” cuts that off.  But I still think some people would find it surprising.


May 2, 2017

Super 18 Predictions for Round 11

Team Ratings for Round 11

The basic method is described on my Department home page.

Here are the team ratings prior to this week’s games, along with the ratings at the start of the season.

Current Rating Rating at Season Start Difference
Hurricanes 17.51 13.22 4.30
Crusaders 12.25 8.75 3.50
Highlanders 9.90 9.17 0.70
Chiefs 8.14 9.75 -1.60
Lions 7.13 7.64 -0.50
Blues 3.02 -1.07 4.10
Brumbies 2.02 3.83 -1.80
Sharks 0.67 0.42 0.20
Stormers 0.51 1.51 -1.00
Waratahs -0.46 5.81 -6.30
Jaguares -2.09 -4.36 2.30
Bulls -2.87 0.29 -3.20
Force -8.24 -9.45 1.20
Cheetahs -10.20 -7.36 -2.80
Reds -10.20 -10.28 0.10
Rebels -13.28 -8.17 -5.10
Kings -13.37 -19.02 5.70
Sunwolves -17.55 -17.76 0.20


Performance So Far

So far there have been 79 matches played, 60 of which were correctly predicted, a success rate of 75.9%.
Here are the predictions for last week’s games.

Game Date Score Prediction Correct
1 Highlanders vs. Stormers Apr 28 57 – 14 9.40 TRUE
2 Chiefs vs. Sunwolves Apr 29 27 – 20 32.80 TRUE
3 Reds vs. Waratahs Apr 29 26 – 29 -6.70 TRUE
4 Force vs. Lions Apr 29 15 – 24 -11.70 TRUE
5 Cheetahs vs. Crusaders Apr 29 21 – 48 -17.30 TRUE
6 Kings vs. Rebels Apr 29 44 – 3 -1.10 FALSE
7 Jaguares vs. Sharks Apr 29 25 – 33 2.50 FALSE
8 Brumbies vs. Blues Apr 30 12 – 18 4.20 FALSE


Predictions for Round 11

Here are the predictions for Round 11. The prediction is my estimated expected points difference with a positive margin being a win to the home team, and a negative margin a win to the away team.

Game Date Winner Prediction
1 Hurricanes vs. Stormers May 05 Hurricanes 21.00
2 Cheetahs vs. Highlanders May 05 Highlanders -16.10
3 Rebels vs. Lions May 06 Lions -16.40
4 Chiefs vs. Reds May 06 Chiefs 22.30
5 Waratahs vs. Blues May 06 Waratahs 0.50
6 Sharks vs. Force May 06 Sharks 12.90
7 Bulls vs. Crusaders May 06 Crusaders -11.10
8 Jaguares vs. Sunwolves May 06 Jaguares 19.50


NRL Predictions for Round 10

Team Ratings for Round 10

The basic method is described on my Department home page.

Here are the team ratings prior to this week’s games, along with the ratings at the start of the season.

Current Rating Rating at Season Start Difference
Storm 8.20 8.49 -0.30
Raiders 7.10 9.94 -2.80
Sharks 6.40 5.84 0.60
Broncos 5.44 4.36 1.10
Sea Eagles 2.39 -2.98 5.40
Panthers 0.50 6.08 -5.60
Eels 0.42 -0.81 1.20
Dragons 0.41 -7.74 8.10
Roosters 0.14 -1.17 1.30
Cowboys -0.23 6.90 -7.10
Titans -1.16 -0.98 -0.20
Bulldogs -1.24 -1.34 0.10
Warriors -4.47 -6.02 1.50
Wests Tigers -4.93 -3.89 -1.00
Rabbitohs -5.89 -1.82 -4.10
Knights -15.13 -16.94 1.80


Performance So Far

So far there have been 72 matches played, 40 of which were correctly predicted, a success rate of 55.6%.
Here are the predictions for last week’s games.

Game Date Score Prediction Correct
1 Broncos vs. Panthers Apr 27 32 – 18 7.30 TRUE
2 Rabbitohs vs. Sea Eagles Apr 28 8 – 46 1.10 FALSE
3 Cowboys vs. Eels Apr 28 6 – 26 7.00 FALSE
4 Titans vs. Knights Apr 29 38 – 8 15.10 TRUE
5 Bulldogs vs. Raiders Apr 29 16 – 10 -6.90 FALSE
6 Wests Tigers vs. Sharks Apr 29 16 – 22 -8.20 TRUE
7 Warriors vs. Roosters Apr 30 14 – 13 -1.00 FALSE
8 Dragons vs. Storm Apr 30 22 – 34 -2.80 TRUE


Predictions for Round 10

Here are the predictions for Round 10. The prediction is my estimated expected points difference with a positive margin being a win to the home team, and a negative margin a win to the away team.

Game Date Winner Prediction
1 Bulldogs vs. Cowboys May 11 Bulldogs 2.50
2 Dragons vs. Sharks May 12 Sharks -2.50
3 Wests Tigers vs. Rabbitohs May 12 Wests Tigers 4.50
4 Panthers vs. Warriors May 13 Panthers 9.00
5 Storm vs. Titans May 13 Storm 12.90
6 Sea Eagles vs. Broncos May 13 Sea Eagles 0.50
7 Knights vs. Raiders May 14 Raiders -18.70
8 Roosters vs. Eels May 14 Roosters 3.20


May 1, 2017

Stat of the Week Competition: April 29 – May 5 2017

Each week, we would like to invite readers of Stats Chat to submit nominations for our Stat of the Week competition and be in with the chance to win an iTunes voucher.

Here’s how it works:

  • Anyone may add a comment on this post to nominate their Stat of the Week candidate before midday Friday May 5 2017.
  • Statistics can be bad, exemplary or fascinating.
  • The statistic must be in the NZ media during the period of April 29 – May 5 2017 inclusive.
  • Quote the statistic, when and where it was published and tell us why it should be our Stat of the Week.

Next Monday at midday we’ll announce the winner of this week’s Stat of the Week competition, and start a new one.

(more…)

Stat of the Week Competition Discussion: April 29 – May 5 2017

If you’d like to comment on or debate any of this week’s Stat of the Week nominations, please do so below!