Summarising a trend
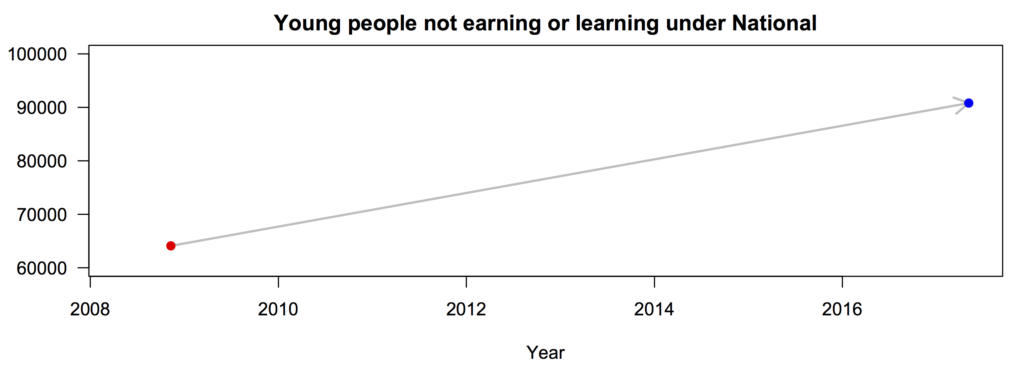
Keith Ng drew my attention on Twitter to an ad from Labour saying “Under National, the number of young people not earning or learning has increased by 41%”.
When you see this sort of claim, you should usually expect two things: first, that the claim will be true in the sense that there will be two numbers that differ by 41%; second, that it will not be the most informative summary of the data in question.
If you look on Infoshare, in the Household Labour Force Survey, you can find data on NEET (not in education, employment, or training). The number was 64100 in the fourth quarter of 2008, when Labour lost the election. It’s now (Q1, 2017) 90800, which is, indeed, 41% higher. Let’s represent the ad by a graph:
We can fill in the data points in between:
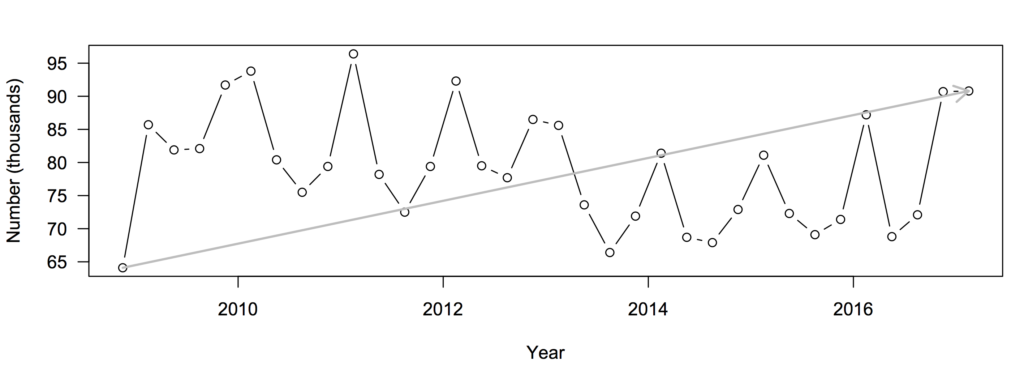
Now, the straight line doesn’t look as convincing.
Also, why are we looking at the number, when population has changed over this time period. We really should care about the rate (percentage)
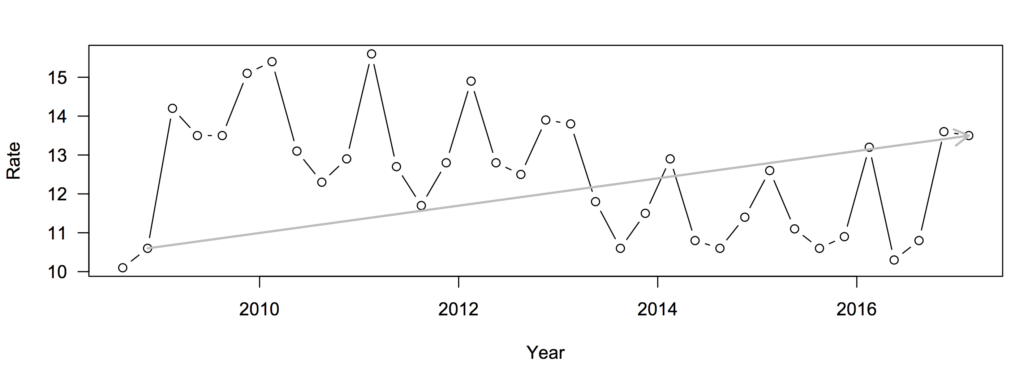
Measuring in terms of rates the increase is smaller — 27%. More importantly, though, the rate was even higher at the end of the first quarter of National’s administration than it is now.
The next thing to notice is the spikes every four quarters or so: NEET is higher in the summer and lower in the winter because of the school year. You might wonder if StatsNZ had produced a seasonally adjusted version, and whether it was also conveniently on Infoshare…
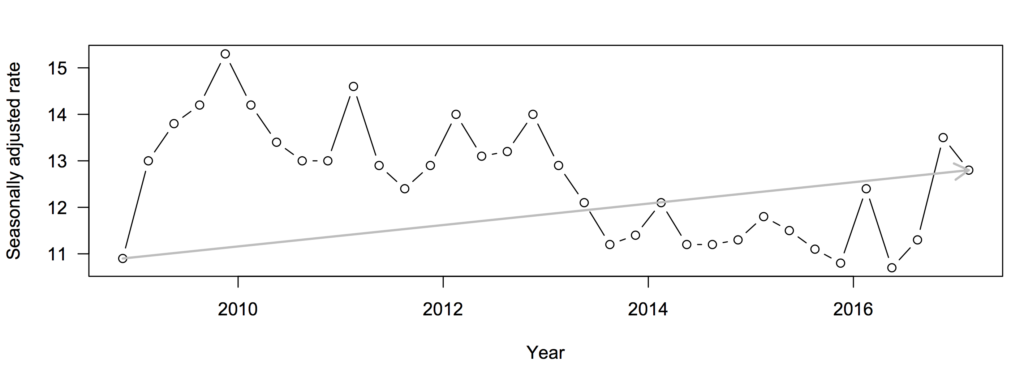
The increase is now 17%
But for long-term comparisons of policy, you’d probably want a smoothed version that incorporates more than one quarter of data. It turns out that StatsNZ have done this, too, and it’s on Infoshare.
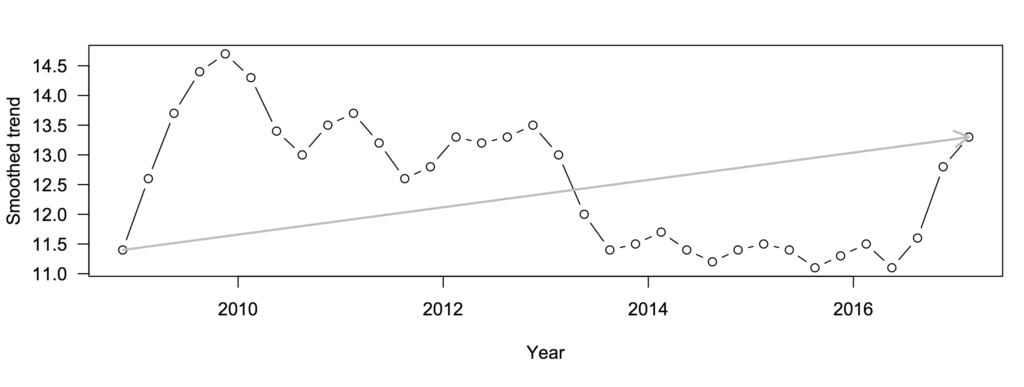
The increase is, again 17%. Taking out the seasonal variation, short-term variation, and sampling noise makes the underlying pattern clearer. NEET increased dramatically in 2009, decreased, and has recently spiked. The early spike may well have been the recession, which can’t reasonably be blamed on any NZ party. The recent increase is worrying, but thinking of it as trend over 9 years isn’t all that helpful.
Thomas Lumley (@tslumley) is Professor of Biostatistics at the University of Auckland. His research interests include semiparametric models, survey sampling, statistical computing, foundations of statistics, and whatever methodological problems his medical collaborators come up with. He also blogs at Biased and Inefficient See all posts by Thomas Lumley »
Very nice. But surely it is scandalous that 90,000 young people are not in education, employment or training? Sure, the difference cited is exaggerated for partisan effect – but how the hell do you get people to take notice of such a scandalous waste of young talent, probably overwhelmingly Maori, Pacifika and low SES European, and likely to result in various social pathologies (such as ram raids on petrol stations and holding up dairies)? Let’s hope some policy wonks in education and employment can come up with some sensible policies – despite or maybe even because of this partisan presentation of key social data!
8 years ago
I did say that the increase in the past three quarters was worrying. It’s a serious problem, but it looks like the cause isn’t as simple as “having a National government”. And if you want to motivate people into action, the increase over the past year is much more impressive than the increase over the past nine years, and doesn’t seem to be due to global problems we can’t easily fix.
8 years ago
It’s interesting that every 3 or 4 years there is a double peak (graph 2&3). This appears to have happened in the Q4 2016/Q1 2017 and effects the smooth.
(double peak also in Q4 2009/Q1 2010 and Q4 2010/Q1 2011)
I wonder if it’s a delay in hiring seasonal (i.e. summer) workers because of bad weather. Or some artefact of data collection in Q4 – young people surveyed pre or post exams.
8 years ago
It may just be that the sampling standard error is about a percentage point.
8 years ago
IIRC To be counted as working a person has to be paid or, if unpaid, be working in a family business. Unpaid internships that happen outside the university context probably count as a NEET. It would be interesting to know how many there are – from what I can gather it’s small but growing.
8 years ago
Good point. Still a worrying trend if that’s the explanation.
8 years ago
So, based on the last graph, should the politicians be making hay about a sudden jump in the last year from 11.5 % to 13.5%, to the sound of a music
track out of copyright?
8 years ago
No, Treasury, MBIE, and MSD staff should be finding out what is going on and options for fixing it, and presenting these to the relevant Minister. In an ideal world.
8 years ago