Posts from May 2017 (30)

May 30, 2017

Super 18 Predictions for Round 15

Team Ratings for Round 15

The basic method is described on my Department home page.

Here are the team ratings prior to this week’s games, along with the ratings at the start of the season.

Current Rating Rating at Season Start Difference
Hurricanes 17.97 13.22 4.70
Crusaders 14.19 8.75 5.40
Highlanders 11.22 9.17 2.10
Lions 9.87 7.64 2.20
Chiefs 8.35 9.75 -1.40
Blues 3.23 -1.07 4.30
Brumbies 3.00 3.83 -0.80
Sharks 1.52 0.42 1.10
Stormers 0.53 1.51 -1.00
Waratahs -0.36 5.81 -6.20
Bulls -5.20 0.29 -5.50
Jaguares -5.38 -4.36 -1.00
Force -8.90 -9.45 0.60
Cheetahs -9.83 -7.36 -2.50
Reds -11.35 -10.28 -1.10
Kings -12.44 -19.02 6.60
Rebels -15.14 -8.17 -7.00
Sunwolves -18.38 -17.76 -0.60


Performance So Far

So far there have been 111 matches played, 85 of which were correctly predicted, a success rate of 76.6%.
Here are the predictions for last week’s games.

Game Date Score Prediction Correct
1 Blues vs. Chiefs May 26 16 – 16 -1.80 FALSE
2 Reds vs. Force May 26 26 – 40 3.10 FALSE
3 Sunwolves vs. Cheetahs May 27 17 – 38 -2.30 TRUE
4 Highlanders vs. Waratahs May 27 44 – 28 15.50 TRUE
5 Rebels vs. Crusaders May 27 19 – 41 -25.80 TRUE
6 Bulls vs. Hurricanes May 27 20 – 34 -19.90 TRUE
7 Sharks vs. Stormers May 27 22 – 10 3.50 TRUE
8 Jaguares vs. Brumbies May 27 15 – 39 -1.70 TRUE


Predictions for Round 15

Here are the predictions for Round 15. The prediction is my estimated expected points difference with a positive margin being a win to the home team, and a negative margin a win to the away team.

Game Date Winner Prediction
1 Blues vs. Reds Jun 02 Blues 18.60
2 Crusaders vs. Highlanders Jun 03 Crusaders 6.50
3 Chiefs vs. Waratahs Jun 03 Chiefs 12.70
4 Brumbies vs. Rebels Jun 03 Brumbies 21.60
5 Force vs. Hurricanes Jun 03 Hurricanes -22.90
6 Jaguares vs. Kings Jun 30 Jaguares 11.10
7 Lions vs. Sunwolves Jul 01 Lions 32.30
8 Cheetahs vs. Stormers Jul 01 Stormers -6.90
9 Sharks vs. Bulls Jul 01 Sharks 10.20


NRL Predictions for Round 13

Team Ratings for Round 13

The basic method is described on my Department home page.

Here are the team ratings prior to this week’s games, along with the ratings at the start of the season.

Current Rating Rating at Season Start Difference
Storm 7.07 8.49 -1.40
Broncos 5.69 4.36 1.30
Sharks 5.18 5.84 -0.70
Raiders 5.11 9.94 -4.80
Sea Eagles 3.25 -2.98 6.20
Roosters 2.88 -1.17 4.00
Cowboys 1.65 6.90 -5.30
Dragons 1.48 -7.74 9.20
Panthers 0.45 6.08 -5.60
Titans -1.68 -0.98 -0.70
Eels -1.80 -0.81 -1.00
Bulldogs -2.12 -1.34 -0.80
Warriors -3.50 -6.02 2.50
Rabbitohs -4.69 -1.82 -2.90
Wests Tigers -8.31 -3.89 -4.40
Knights -12.69 -16.94 4.20


Performance So Far

So far there have been 92 matches played, 52 of which were correctly predicted, a success rate of 56.5%.
Here are the predictions for last week’s games.

Game Date Score Prediction Correct
1 Rabbitohs vs. Eels May 26 16 – 22 1.90 FALSE
2 Warriors vs. Broncos May 27 28 – 10 -9.40 FALSE
3 Sharks vs. Bulldogs May 27 9 – 8 12.60 TRUE
4 Raiders vs. Roosters May 28 24 – 16 5.20 TRUE


Predictions for Round 13

Here are the predictions for Round 13. The prediction is my estimated expected points difference with a positive margin being a win to the home team, and a negative margin a win to the away team.

Game Date Winner Prediction
1 Storm vs. Knights Jun 02 Storm 23.30
2 Eels vs. Warriors Jun 02 Eels 5.70
3 Dragons vs. Wests Tigers Jun 03 Dragons 13.30
4 Roosters vs. Broncos Jun 03 Roosters 0.70
5 Cowboys vs. Titans Jun 03 Cowboys 6.80
6 Sea Eagles vs. Raiders Jun 04 Sea Eagles 1.60
7 Bulldogs vs. Panthers Jun 04 Bulldogs 0.90


May 29, 2017

The past is a foreign country

As you might have read in an English class (at least if you’re old) “The past is a foreign country: they do things differently there.” In particular, they buy things differently.

We often want to compare prices between the present and the past. To compare prices between here and actual foreign countries, we use the exchange rate and find, for example, that the US cost (from Amazon) of Sennheiser CX 3.0 earphones, US$29.99 is equivalent to about NZ$40, or about NZ$46 with tax.  We can then straightforwardly say that Harvey Norman is charging 60% more  than Amazon for the same item, and force them to make unconvincing excuses.  Comparing foreign prices can get complicated if you’re interested in affordability relative to income, or if you’re looking at a country with very restrictive border controls but the existence of two-way trade with many foreign countries means there is a single, well-defined exchange rate.

The equivalent conversion for past prices is an inflation adjustment. If you’re comparing past and current prices without an inflation adjustment you’re not even trying to get the numbers right (with a few very limited exceptions such as bracket creep).  There should be an automatic presumption of dodginess for any `nominal’, unadjusted comparison of amounts of money at different times — especially as this is something that’s really easy to get (approximately) right.  So, go and fix it now.

I said “approximately right”, and those of you still with me will note that we don’t have extensive two-way trade with the past. Inflation isn’t as simple as an exchange rate.You can’t buy Sennheiser CX 3.0 earphones with 1997 dollars, and even if you could, Amazon would have difficulty shipping them to 1997.  Inflation adjustments are more like the Economist‘s Big Mac purchasing-power index.  The magazine decrees that Big Macs have the same true value everywhere in the world, and so can estimate the relative value of different currencies.  That’s not ideal when comparing countries, and it’s even harder when comparing with the past.

Economists and official statistics agencies make up ‘baskets’ of items and decree these to have the same value over time, carefully making sure that the items are defined narrowly enough for ‘the same value’ to be reasonable, and broadly enough that you can still find ‘the same item’ a year later.  They also make complicated adjustments for changes in quality of the ‘same item’ (math is hard even if you go shopping).  That’s really the only way you can do it, and it works ok for many purposes, but there isn’t just one inflation rate the way there is one exchange rate.

Macroeconomists use this thing called ‘core inflation’, which leaves out items that vary a lot in price and which they say predicts macroeconomic things better.  There are indexes based on baskets of items bought by NZ producers, or sold by NZ producers.  There are indexes based on baskets of items relevant to different sorts of households: Graeme Edgeler has a nice post pointing out that there is an inflation index targeted to beneficiaries, and that it would make sense to use this to index benefits (he also drafted a bill).

The other tricky part of the basket approach to comparing past and current prices is the huge differences between items.  The prices of computers, washing machines, t-shirts, and old-enough medications are increasing more slowly than the average inflation rate; they are getting systematically less expensive ‘in real terms’. By simple arithmetic, that means the prices of other things must be rising faster than the average inflation rate; they must be getting more expensive ‘in real terms’.

It sounds odd to say that primary schools or health care are getting more expensive to run `in real terms’ because computers and t-shirts are cheaper — but it’s partly true. Some sort of currency conversion is always necessary when comparing different currencies — the 2001 dollar and the 2017 dollar — but it’s not always sufficient.


Stat of the Week Competition: May 27 – June 2 2017

Each week, we would like to invite readers of Stats Chat to submit nominations for our Stat of the Week competition and be in with the chance to win an iTunes voucher.

Here’s how it works:

  • Anyone may add a comment on this post to nominate their Stat of the Week candidate before midday Friday June 2 2017.
  • Statistics can be bad, exemplary or fascinating.
  • The statistic must be in the NZ media during the period of May 27 – June 2 2017 inclusive.
  • Quote the statistic, when and where it was published and tell us why it should be our Stat of the Week.

Next Monday at midday we’ll announce the winner of this week’s Stat of the Week competition, and start a new one.

(more…)

Stat of the Week Competition Discussion: May 27 – June 2 2017

If you’d like to comment on or debate any of this week’s Stat of the Week nominations, please do so below!

May 26, 2017

Big fat lies?

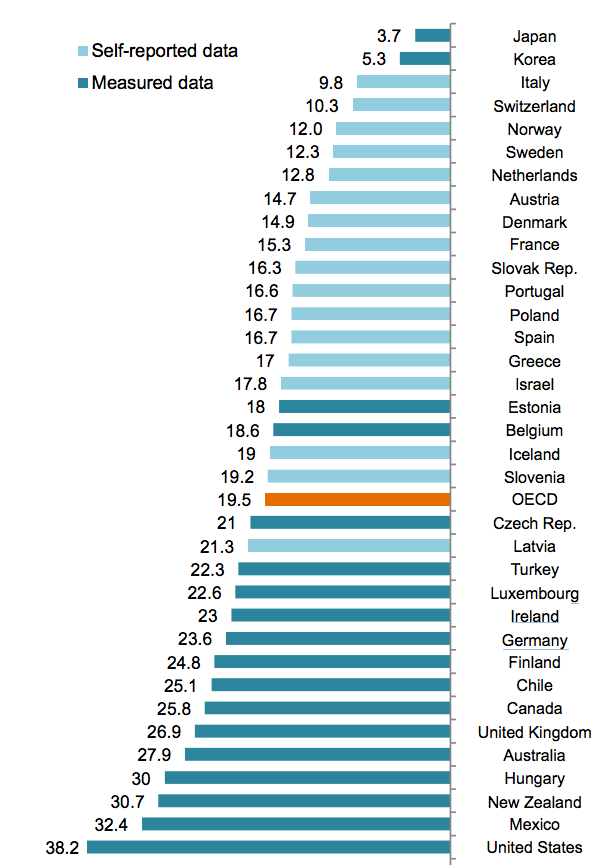
This is a graph from the OECD, of obesity prevalence:
oecd

The basic numbers aren’t novel. What’s interesting (as @cjsnowdon pointed out on Twitter) is the colour separation. The countries using self-reported height and weight data report lower rates of obesity than those using actual measurements.  It wouldn’t be surprising that people’s self-reported weight, over the telephone, tends to be a bit lower than what you’d actually measure if they were standing in front of you; this is a familiar problem with survey data, and usually we have no real way to tell how big the bias is.

In this example there’s something we can do.  The United States data come from the National Health And Nutrition Examination Surveys (NHANES), which involve physical and medical exams of about 5,000 people per year. The US also runs the Behavioral Risk Factor Surveillance System (BRFSS), which is a telephone interview of half a million people each year. BRFSS is designed to get reliable estimates for states or even individual counties, but we can still look at the aggregate data.

Doing the comparisons would take a bit of effort, except that one of my students, Daniel Choe, has already done it. He was looking at ways to combine the two surveys to get more accurate data than you’d get from either one separately.  One of his graphs shows a comparison of the obesity rate over a 16-year period using five different statistical models. The top right one, labelled ‘Saturated’, is the raw data.
combined

In the US in that year the prevalence of obesity based on self-reported height and weight was under 30%.  The prevalence based on measured height and weight was about 36% — there’s a bias of about 8 percentage points. That’s nowhere near enough to explain the difference between, say, the US and France, but it is enough that it could distort the rankings noticeably.

As you’d expect, the bias isn’t constant: for example, other research has found the relationship between higher education and lower obesity to be weaker when using real measurements than when using telephone data.  This sort of thing is one reason doctors and medical researchers are interested in cellphone apps and gadgets such as Fitbit — to get accurate answers even from the other end of a telephone or internet connection.

In memoriam Alastair Scott

AlastairScott4-560x373(Alastair didn’t contribute directly to StatsChat, but he was a major contributor to this being a department that would take it seriously.)

In memoriam: Alastair Scott, Emeritus Professor of Statistics (1939-2017).

Alastair Scott, one of the finest statisticians New Zealand has produced, died in Auckland, New Zealand on Thursday, May 25. He served the University of Auckland with distinction from 1972 to 2005.

His research was characterised by deep insight and he made pioneering contributions across a wide range of statistical fields. Alastair was acknowledged, in particular, as a world leader in survey sampling theory and the development of methods to efficiently obtain and analyse data from medical studies. His methods are applied in a wide range of areas, notably in public health. Beyond research, he contributed prolifically to the statistical profession in academia, government, and society.

Alastair was a Fellow of the Royal Society of New Zealand, the American Statistical Association, the Institute of Mathematical Statistics, the Royal Statistical Society, and an honorary life member of the New Zealand Statistical Association. In November last year, Alastair was awarded the Royal Society of New Zealand’s Jones Medal, which recognised his lifetime contribution to the mathematical sciences.

Alastair gained his first degrees at the University of Auckland: BSc in Mathematics in 1961 and MSc in Mathematics in 1962. After a period at the New Zealand Department of Scientific and Industrial Research, he pursued a PhD in Statistics at the University of Chicago, graduating in 1965. He then worked at the London School of Economics from 1965-1972.

Alastair returned to New Zealand in 1972 to a post in what was then the Department of Mathematics and Statistics at the University of Auckland; he and wife Margaret had decided that they wanted to raise their children, Andrew and Julie, in New Zealand. Throughout his career, Alastair was regularly offered posts at prestigious universities overseas, but turned them down. However, he held visiting positions at Bell Labs, the universities of North Carolina, Wisconsin, and UC Berkeley in the US, and at the University of Southampton in the UK.

In 1994, the University’s statistics staff, led by Professor George Seber, had a very amicable divorce from the Department of Mathematics and Statistics, and Alastair became the head of the new Department of Statistics. He helped set the tone for the department that still exists – hard-working, but welcoming, and social. The Department of Statistics is now the largest such school in Australasia.

In 2005, Alastair officially retired. A conference in Auckland that year in his honour attracted the largest concentration of first-rank international statisticians in New Zealand in one place at one time. Alastair kept an office in the department and continued writing and advising, coming into work almost every day.

Alastair Scott was an influential teacher and generous mentor to several generations of statisticians who valued his sage advice coupled with his trademark affability. Alastair had a full life professionally and personally. He was a wonderful teacher, mentor, colleague, and friend. We will all miss him greatly and we extend our sincere condolences to Margaret, Andrew and Julie, and his family, friends, and colleagues all over the world.


May 23, 2017

Super 18 Predictions for Round 14

Team Ratings for Round 14

The basic method is described on my Department home page.

Here are the team ratings prior to this week’s games, along with the ratings at the start of the season.

Current Rating Rating at Season Start Difference
Hurricanes 18.33 13.22 5.10
Crusaders 14.42 8.75 5.70
Highlanders 11.19 9.17 2.00
Lions 9.87 7.64 2.20
Chiefs 8.46 9.75 -1.30
Blues 3.12 -1.07 4.20
Brumbies 1.66 3.83 -2.20
Stormers 1.04 1.51 -0.50
Sharks 1.00 0.42 0.60
Waratahs -0.33 5.81 -6.10
Jaguares -4.04 -4.36 0.30
Bulls -5.55 0.29 -5.80
Force -9.93 -9.45 -0.50
Reds -10.32 -10.28 -0.00
Cheetahs -10.95 -7.36 -3.60
Kings -12.44 -19.02 6.60
Rebels -15.37 -8.17 -7.20
Sunwolves -17.26 -17.76 0.50


Performance So Far

So far there have been 102 matches played, 79 of which were correctly predicted, a success rate of 77.5%.
Here are the predictions for last week’s games.

Game Date Score Prediction Correct
1 Chiefs vs. Crusaders May 19 24 – 31 -5.80 TRUE
2 Stormers vs. Blues May 19 30 – 22 1.10 TRUE
3 Hurricanes vs. Cheetahs May 20 61 – 7 30.40 TRUE
4 Force vs. Highlanders May 20 6 – 55 -12.80 TRUE
5 Sunwolves vs. Sharks May 20 17 – 38 -13.30 TRUE
6 Kings vs. Brumbies May 20 10 – 19 -10.30 TRUE
7 Lions vs. Bulls May 20 51 – 14 16.50 TRUE
8 Waratahs vs. Rebels May 21 50 – 23 17.40 TRUE


Predictions for Round 14

Here are the predictions for Round 14. The prediction is my estimated expected points difference with a positive margin being a win to the home team, and a negative margin a win to the away team.

Game Date Winner Prediction
1 Blues vs. Chiefs May 26 Chiefs -1.80
2 Reds vs. Force May 26 Reds 3.10
3 Sunwolves vs. Cheetahs May 27 Cheetahs -2.30
4 Highlanders vs. Waratahs May 27 Highlanders 15.50
5 Rebels vs. Crusaders May 27 Crusaders -25.80
6 Bulls vs. Hurricanes May 27 Hurricanes -19.90
7 Sharks vs. Stormers May 27 Sharks 3.50
8 Jaguares vs. Brumbies May 27 Brumbies -1.70
9 Lions vs. Kings May 28 Lions 25.80


NRL Predictions for Round 12

Team Ratings for Round 12

The basic method is described on my Department home page.

Here are the team ratings prior to this week’s games, along with the ratings at the start of the season.

Current Rating Rating at Season Start Difference
Broncos 7.78 4.36 3.40
Storm 7.07 8.49 -1.40
Sharks 6.10 5.84 0.30
Raiders 4.86 9.94 -5.10
Sea Eagles 3.25 -2.98 6.20
Roosters 3.13 -1.17 4.30
Cowboys 1.65 6.90 -5.30
Dragons 1.48 -7.74 9.20
Panthers 0.45 6.08 -5.60
Titans -1.68 -0.98 -0.70
Eels -2.44 -0.81 -1.60
Bulldogs -3.05 -1.34 -1.70
Rabbitohs -4.05 -1.82 -2.20
Warriors -5.59 -6.02 0.40
Wests Tigers -8.31 -3.89 -4.40
Knights -12.69 -16.94 4.20


Performance So Far

So far there have been 88 matches played, 50 of which were correctly predicted, a success rate of 56.8%.
Here are the predictions for last week’s games.

Game Date Score Prediction Correct
1 Sharks vs. Cowboys May 18 18 – 14 8.80 TRUE
2 Warriors vs. Dragons May 19 14 – 30 -0.70 TRUE
3 Broncos vs. Wests Tigers May 19 36 – 0 16.60 TRUE
4 Titans vs. Sea Eagles May 20 10 – 30 2.00 FALSE
5 Eels vs. Raiders May 20 16 – 22 -3.30 TRUE
6 Knights vs. Panthers May 21 20 – 30 -9.60 TRUE
7 Bulldogs vs. Roosters May 21 18 – 24 -1.90 TRUE
8 Rabbitohs vs. Storm May 21 6 – 14 -7.50 TRUE


Predictions for Round 12

Here are the predictions for Round 12. The prediction is my estimated expected points difference with a positive margin being a win to the home team, and a negative margin a win to the away team.

Game Date Winner Prediction
1 Rabbitohs vs. Eels May 26 Rabbitohs 1.90
2 Warriors vs. Broncos May 27 Broncos -9.40
3 Sharks vs. Bulldogs May 27 Sharks 12.60
4 Raiders vs. Roosters May 28 Raiders 5.20


May 22, 2017

How rich do you feel

From Scott Macleod, in a Stat of the Week nomination

The NZ Herald claims that a person earning the median NZ salary of USD $33,500 (equivalent) is the 55 millionth richest person in the world by income.

However, this must be wrong.

There are 300 million people in the USA alone, and their median income is higher than ours. This means that the average New Zealander wouldn’t even be the 55 millionth richest person in the USA, let alone the world.

Basically, yes, but it’s not quite as simple as that.  That median NZ salary looks like what you get if you multiply the NZ median “weekly personal income from salary and wages among those receiving salary and wages” (eg here) by 52, which would be appropriate for people receiving salary or wage income 52 weeks per year. The median personal income for NZ will be quite a lot lower, and the median personal income for the US is also lower: about USD30,240.

Even so, there are about 250 million adults (by the definition used) in the US, and nearly half of them have higher personal income than USD33500, so that still comes to over 100 million people. And that’s without counting Germany or the UK — or cities such as  Beijing and Shanghai that have more people with incomes that high than New Zealand does.  And that’s also assuming the web page doesn’t do currency conversions — which it looks from the code as if it’s trying to.

The CARE calculator must indeed be wrong, or using an unusual definition of income, or something. Unfortunately, the code for how it does the calculation is hidden; they say “After calculating the distribution of income, we then use a statistical model to estimate your rank.” 

As a cross-check, Pew Global also has a web page based on World Bank data.  It doesn’t let you put in your own cutpoints, but it says 7% of the world’s population had more than $50/day to live on in 2011.  The CARE web page thinks it’s more like 4.7% now.  The agreement does seem to be better at lower incomes, too — the estimates will be more accurate for people who aren’t going to use the calculator than for people who are.