The recently ex-kids are ok
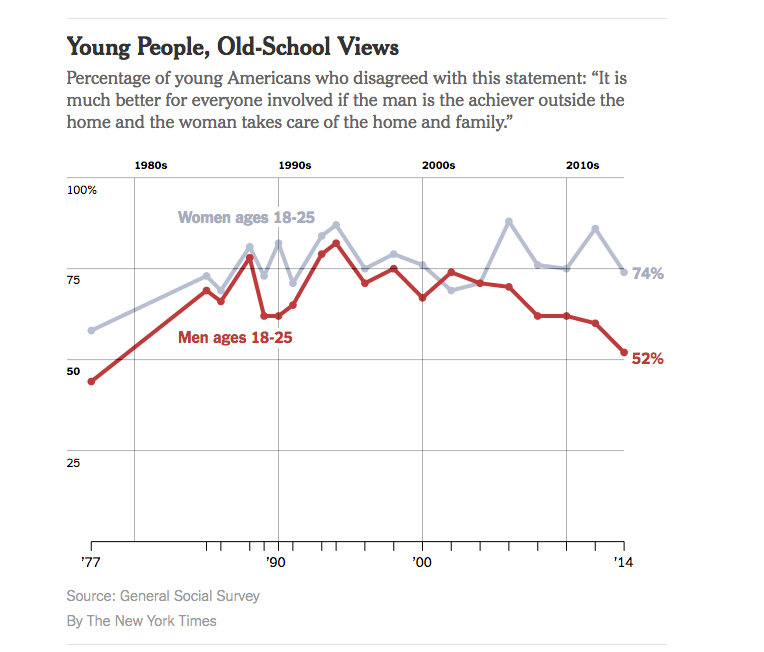
The New York Times had a story last week with the headline “Do Millennial Men Want Stay-at-Home Wives?”, and this depressing graph
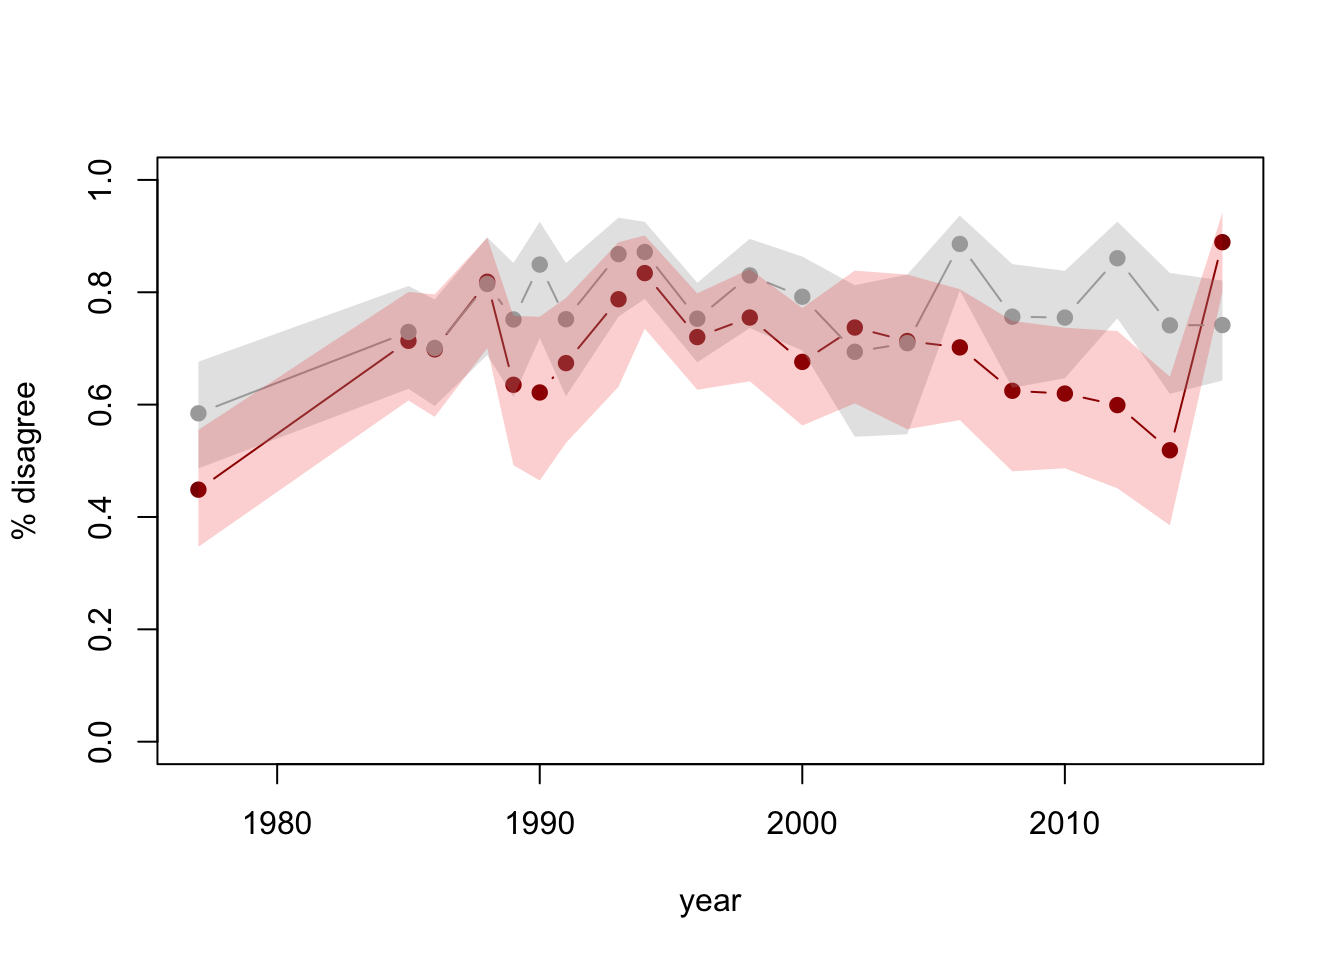
But, the graph doesn’t have any uncertainty indications, and while the General Social Survey is well-designed, that’s a pretty small age group (and also, an idiosyncratic definition of ‘millennial’)
So, I looked up the data and drew a graph with confidence intervals (full code here)
See the last point? The 2016 data have recently been released. Adding a year of data and uncertainty indications makes it clear there’s less support for the conclusion that it looked.
Other people did similar things: Emily Beam has a long post including some context
The Pepin and Cotter piece, in fact, presents two additional figures in direct contrast with the garbage millennial theory – in Monitoring the Future, millennial men’s support for women in the public sphere has plateaued, not fallen; and attitudes about women working have continued to improve, not worsen. Their conclusion is, therefore, that they find some evidence of a move away from gender equality – a nuance that’s since been lost in the discussion of their work.
and Kieran Healy tweeted
You may say every other sociologist in America did this yesterday, but I say I am doing my bit for reproducibility in social science. pic.twitter.com/Xdab692TK4
— Kieran Healy (@kjhealy) April 2, 2017
As a rule if you see survey data (especially on a small subset of the population) without any uncertainty displayed, be suspicious.
Also, it’s impressive how easy these sorts of analysis are with modern technology. They used to require serious computing, expensive software, and potentially some work to access the data. I did mine in an airport: commodity laptop, free WiFi, free software, user-friendly open-data archive. One reason that basic statistics training has become much more useful in the past few decades is that so many of the other barriers to DIY analysis have been removed.
Thomas Lumley (@tslumley) is Professor of Biostatistics at the University of Auckland. His research interests include semiparametric models, survey sampling, statistical computing, foundations of statistics, and whatever methodological problems his medical collaborators come up with. He also blogs at Biased and Inefficient See all posts by Thomas Lumley »

Your graphic brought up two obvious points.
1). 2016, obviously something is wrong here (in the data sense)
2). 1992 or 1993. It is outside the confidence interval for 1990. And against the trend. So either something major happened in those couple of years, but I don’t remember anything significant in those years, or the confidence intervals are underestimating the randomness of the surveys.
8 years ago
Actually I think it is between 1993 and 1991.
8 years ago
I think both 2016 and 2014 are ‘wrong’ in the sense of large random error — the percentage isn’t really that high, but it wasn’t really that low.
8 years ago
And I should add a third. People’s attitudes change slowly, there shouldn’t be much variance year to year, other than sampling error. ’89, ’90, ’91 are all below the confidence interval for ’88. There may be a reason for the early 90’s brief move towards sexism or traditionalism, which would make for an interesting article. But I was too busy listening to the broken up Pink Floyd at the time to have known.
8 years ago
In the year that Trump and Clinton were wrestling for the presidency, you’d kinda expect there to be a changes in attitude about women staying at home/being in the workforce. Even if it was just 18-25 year olds wanting to piss-off their Redneck parents.
When the GFC hit and there was only enough jobs to go around for one person in a couple then there would be more incentive for it to go to the male (who earns more, on average). So ideas about who should be in the workforce when unemployment is high may be more about finances than equality.
And, usually I’d buy the “attitudes change slowly” but you also have to remember that the 18-25 group is changing rapidly. In 8 years it has a complete turn-over of people in it. Where as the Over 25s…
And that without considering the huge growth these kids go through after leaving high school, doing college and entering the workforce.
8 years ago