Posts from March 2017 (37)

March 29, 2017

Technological progress in NZ polling

From a long story at stoppress.co.nz

For the first time ever, Newshub and Reid Research will conduct 25 percent of its polling via the internet. The remaining 75 percent of polling will continue to be collected via landline phone calls, with its sampling size of 1000 respondents and its margin of error of 3.1 percent remaining unchanged. The addition of internet polling—aided by Trace Research and its director Andrew Zhu—will aim to enhance access to 18-35-year-olds, as well as better reflect the declining use of landlines in New Zealand.

This is probably a good thing, not just because it’s getting harder to sample people. Relying on landlines leads people who don’t understand polling to assume that, say, the Greens will do much better in the election than in the polls because their voters are younger. And they don’t.

The downside of polling over the internet is it’s much harder to tell from outside if someone is doing a reasonable job of it. From the position of a Newshub viewer, it may be hard even to distinguish bogus online clicky polls from serious internet-based opinion research. So it’s important that Trace Research gets this right, and that Newshub is careful about describing different sorts of internet surveys.

As Patrick Gower says in the story

“The interpretation of data by the media is crucial. You can have this methodology that we’re using and have it be bang on and perfect, but I could be too loose with the way I analyse and present that data, and all that hard work can be undone by that. So in the end, it comes down to me and the other people who present it.”

It does. And it’s encouraging to see that stated explicitly.

March 28, 2017

Super 18 Predictions for Round 6

Team Ratings for Round 6

The basic method is described on my Department home page.

Here are the team ratings prior to this week’s games, along with the ratings at the start of the season.

Current Rating Rating at Season Start Difference
Hurricanes 17.79 13.22 4.60
Chiefs 10.88 9.75 1.10
Crusaders 8.45 8.75 -0.30
Highlanders 7.61 9.17 -1.60
Lions 7.41 7.64 -0.20
Brumbies 3.71 3.83 -0.10
Stormers 2.36 1.51 0.90
Blues 2.04 -1.07 3.10
Waratahs 1.55 5.81 -4.30
Sharks 0.85 0.42 0.40
Jaguares -1.58 -4.36 2.80
Bulls -2.46 0.29 -2.70
Cheetahs -8.30 -7.36 -0.90
Force -8.57 -9.45 0.90
Reds -9.87 -10.28 0.40
Rebels -11.78 -8.17 -3.60
Kings -17.75 -19.02 1.30
Sunwolves -19.45 -17.76 -1.70


Performance So Far

So far there have been 42 matches played, 32 of which were correctly predicted, a success rate of 76.2%.
Here are the predictions for last week’s games.

Game Date Score Prediction Correct
1 Crusaders vs. Force Mar 24 45 – 17 20.10 TRUE
2 Rebels vs. Waratahs Mar 24 25 – 32 -10.20 TRUE
3 Blues vs. Bulls Mar 25 38 – 14 6.40 TRUE
4 Brumbies vs. Highlanders Mar 25 13 – 18 0.80 FALSE
5 Sunwolves vs. Stormers Mar 25 31 – 44 -18.50 TRUE
6 Kings vs. Lions Mar 25 19 – 42 -21.50 TRUE
7 Cheetahs vs. Sharks Mar 25 30 – 38 -5.30 TRUE
8 Jaguares vs. Reds Mar 25 22 – 8 12.10 TRUE


Predictions for Round 6

Here are the predictions for Round 6. The prediction is my estimated expected points difference with a positive margin being a win to the home team, and a negative margin a win to the away team.

Game Date Winner Prediction
1 Highlanders vs. Rebels Mar 31 Highlanders 23.40
2 Blues vs. Force Apr 01 Blues 14.60
3 Chiefs vs. Bulls Apr 01 Chiefs 17.30
4 Reds vs. Hurricanes Apr 01 Hurricanes -23.70
5 Stormers vs. Cheetahs Apr 01 Stormers 14.20
6 Lions vs. Sharks Apr 01 Lions 10.10
7 Waratahs vs. Crusaders Apr 02 Crusaders -2.90


NRL Predictions for Round 5


Team Ratings for Round 5

The basic method is described on my Department home page.

Here are the team ratings prior to this week’s games, along with the ratings at the start of the season.

Current Rating Rating at Season Start Difference
Raiders 8.86 9.94 -1.10
Storm 8.13 8.49 -0.40
Sharks 6.61 5.84 0.80
Panthers 5.89 6.08 -0.20
Broncos 5.66 4.36 1.30
Cowboys 4.78 6.90 -2.10
Roosters 2.12 -1.17 3.30
Sea Eagles -0.06 -2.98 2.90
Eels -0.76 -0.81 0.00
Titans -2.90 -0.98 -1.90
Rabbitohs -3.15 -1.82 -1.30
Dragons -3.60 -7.74 4.10
Bulldogs -3.62 -1.34 -2.30
Wests Tigers -6.26 -3.89 -2.40
Warriors -8.03 -6.02 -2.00
Knights -15.71 -16.94 1.20


Performance So Far

So far there have been 32 matches played, 18 of which were correctly predicted, a success rate of 56.2%.
Here are the predictions for last week’s games.

Game Date Score Prediction Correct
1 Rabbitohs vs. Roosters Mar 23 6 – 20 0.50 FALSE
2 Panthers vs. Knights Mar 24 40 – 0 22.30 TRUE
3 Broncos vs. Raiders Mar 24 13 – 12 0.10 TRUE
4 Sea Eagles vs. Bulldogs Mar 25 36 – 0 1.90 TRUE
5 Eels vs. Sharks Mar 25 6 – 20 -2.00 TRUE
6 Titans vs. Cowboys Mar 25 26 – 32 -3.80 TRUE
7 Wests Tigers vs. Storm Mar 26 14 – 22 -11.50 TRUE
8 Dragons vs. Warriors Mar 26 26 – 12 7.30 TRUE


Predictions for Round 5

Here are the predictions for Round 5. The prediction is my estimated expected points difference with a positive margin being a win to the home team, and a negative margin a win to the away team.

Game Date Winner Prediction
1 Bulldogs vs. Broncos Mar 30 Broncos -5.80
2 Roosters vs. Sea Eagles Mar 31 Roosters 5.70
3 Cowboys vs. Rabbitohs Mar 31 Cowboys 11.40
4 Sharks vs. Knights Apr 01 Sharks 25.80
5 Raiders vs. Eels Apr 01 Raiders 13.10
6 Storm vs. Panthers Apr 01 Storm 5.70
7 Warriors vs. Titans Apr 02 Titans -1.10
8 Wests Tigers vs. Dragons Apr 02 Wests Tigers 0.80


March 27, 2017

Nice to know it’s not men’s fault

Q: Did you see the headline? “Science proves beautiful women do make men cheat on their partners”?

A: Yes.

Q: Isn’t that a bit unethical? Doing experiments to make men cheat on their partners?

A: That’s not what they did.

Q: Well, not “make”, I suppose. “Encourage”.

A: “Seduce”, perhaps?

Q: Yes!

A: ◔_◔.  No.

Q: No what?

A: No actual cheating on partners was measured.  The study participants ‘cheated’ with small amounts of money — a few dollars.

Q: Oh. Did the researchers say this would extend to cheating on partners?

A: In the research paper they say “sexy women can seduce men away from behaving honestly and may more readily attract males who lie than was previously thought” and “For men whose mating motivation is heightened by exposure to sexual stimuli, dishonesty appears to be a tactic for projecting characteristics preferred by women (e.g., large economic resources)

Q: So beautiful women make men cheat to get small amounts of money, because then they’ll look rich and desirable.

A: That seems to be the theory.

Q: And this is the women’s fault.

A: They don’t quite come out and say that. But it makes men lose self-control

Q: Yes, this evidence that sexualised pictures make men lose self-control. How did they measure that?

A: The men took longer to answer computer questions involving the Stroop Effect: like “what colour is the word RED

Q: Is it just me who finds this slightly anticlimactic in context?

A: No.

Q: Isn’t the whole thing probably just chance?

A: They did have a preregistered replication of their main result, so that’s less likely than usual.

Q: How about that participants thought experimenters showing sexualised pictures of women were jerks and deserved to be taken for small sums of money?

A: Conceivable, I suppose. But that’s not an evolutionary explanation, and this is an evolutionary journal.

Q: Seriously, though, this wasn’t very novel or surprising (even to the researchers). Why is this research international news?

A: Because the Daily Mail evolved in an environment where sensationalising any research connected with sex or cancer was rewarded, and it can’t help itself.


Briefly

  • There’s yet another ‘breakthrough’ test for future Alzheimers. The story is better than usual, pointing out “while the score could help to identify people for trials, it was too early to apply it as a genetic testing tool for use in the clinic.
  • Research from Yale finds that (in the US) a lot of the people who don’t accept that climate change is real do say they trust climate scientists, they just  don’t believe that most scientists believe in it. Which is actually weirder.
    warming
  • The Boston school system has switched from the Mercator projection to the Peters projection for maps in schools. Which is a step forward. But some of the coverage is repeating the myth that the Mercator projection became popular because it makes Europe look big. Here’s a guest post at mathbabe.org on the topic by Ernie Davis, and here’s the XKCD take

Stat of the Week Competition: March 25 – 31 2017

Each week, we would like to invite readers of Stats Chat to submit nominations for our Stat of the Week competition and be in with the chance to win an iTunes voucher.

Here’s how it works:

  • Anyone may add a comment on this post to nominate their Stat of the Week candidate before midday Friday March 31 2017.
  • Statistics can be bad, exemplary or fascinating.
  • The statistic must be in the NZ media during the period of March 25 – 31 2017 inclusive.
  • Quote the statistic, when and where it was published and tell us why it should be our Stat of the Week.

Next Monday at midday we’ll announce the winner of this week’s Stat of the Week competition, and start a new one.

(more…)

Stat of the Week Competition Discussion: March 25 – 31 2017

If you’d like to comment on or debate any of this week’s Stat of the Week nominations, please do so below!

March 24, 2017

Present exaggerated, future hypothetical

There’s a story at Stuff with the headline “Blood test picks up cancer before symptoms start to show“. It’s attributed to the Telegraph but doesn’t seem to have run there yet.( It’s here. I don’t think it was up when I wrote that, but I might have missed it).  The test looks at tiny amounts of tumour DNA that are circulating in the blood.

It’s not straightforward to demonstrate that a new test is better for early cancer detection than current methods. You need to use the test on a group of people who have cancer but don’t know it yet. Recruiting them is hard. In this story, the researchers didn’t do that. They made imaginary people with undetected cancer in a computer, and tested their imaginary blood to see if the cancer would be picked up.  That’s a good idea, but it’s a very early stage in the research process.

The researchers also went on to use the method on some real blood samples of people with lung, liver, or breast cancer, and without cancer. These aren’t the currently-undiagnosable people who might benefit in the future, but most of the cancer patients had early-stage disease by current standards.

The story says these results were very good

It picked up eight out of 10 cancers, and gave a false positive on fewer than one in 100 occasions.

The press release and the paper itself aren’t as positive. The test did pick up 8 out of 10 early-stage cancers, but the false positive rate was 20%.  That’s far too high for a screening test in people with no symptoms.  The test also did a lot better on liver cancer than on lung cancer or breast cancer, which isn’t very helpful for NZ or for the UK, since liver cancer is relatively rare in both countries.

As the story does say, this research is in its infancy, and the new test did much better than some standard machine-learning methods run on the same data. But it’s nowhere near ready for prime time: the headline is referring to potential future benefits of a different, further-developed test, but is using the present tense.


March 23, 2017

This ain’t exactly real

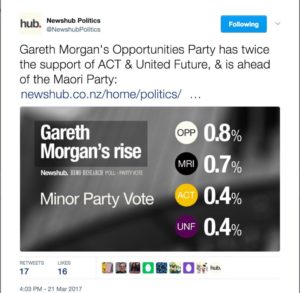
From Matthew Beveridge on Twitter, who also has a post on reporting standards.

C7gZ6asXUAAMMUf

In a poll of 1000 people, if we make the (generous) assumption that it’s a uniform random sample, these minor-party results mean 8 people for The Opportunities Party, 7 for the Māori Party, 4 for ACT and 4 for UnitedFuture.  That’s not a very impressive lead.

A 95% confidence interval (the equivalent of the usual margin of error statement, using my cheatsheet)  for TOP would be 0.3% to 1.6%; for the Māori Party 0.3% to 1.4%, and for ACT and UnitedFuture 0.1 to 1.0%.  There’s a lot of overlap.   A 95% confidence interval for the ratio of TOP to ACT support goes from 0.63 to 7.5, showing that more-sophisticated analysis confirming the conclusion: ACT could be more popular than TOP, or much less popular, but we don’t have enough information to be sure. Obviously, the same thing will be true only more so for the TOP/Māori comparison.

But there’s a more important problem: for at least three of these parties, the party vote is relatively unimportant. The Māori Party [correction] has won one  list seat in its history, and neither ACT and UnitedFuture has for the past two elections.  What matters most for these parties is their support in their key electorates.  It’s hard to poll for electorate support, both because it’s hard to sample from electorates and because you have to distinguish party vote and electorate vote intentions reliably. Judging from past election campaigns, we’ll probably get some polling of the Māori electorates, but it’s unlikely we’ll get any useful polling of Ōhāriu and Epsom.  However, I would feel pretty safe in predicting that ACT will end up with a seat, and much less confident that TOP will.

Democracy is coming

We have an election this year, so we are starting to have polling.

To save time, here are some potentially useful StatsChat posts about election polls:

  • A simple cheatsheet for working out the margin of error for minor parties (also including a simple Excel macro)