Posts from November 2016 (30)

November 18, 2016

Briefly

  • “So what I got from reading some of Clinton’s email is another piece of evidence confirming my intuition that political systems scale poorly.” (medium.com)
  • Cathy O’Neil on a program at Georgia State University: Here’s the thing. One of the hallmark characteristics of a WMD is that it punishes the poor, the unlucky, the sick, or the marginalized. This algorithm does the opposite – it offers them help.
November 15, 2016

Fake news and AI

From Russell Brown at Public Address

As Facebook moved from human curation to trust artificial intelligence to sift it stories, fakery exploded. It was a Google algorithm, not an editor, that made a wholly false claim about the popular vote the “top” story in its rankings. The idea that AI will actually write most of the news we see is genuinely horrifying.


Links are good for you

The Herald has found some “surprising health benefits of beer.” It found them in the Telegraph, but otherwise we’re not given a lot of help tracking things down.  There are eleven”surprising benefits”, labelled 1 to 10. Only two are even arguably new. None of them come with a link, or even with the absolute minimum of both a journal and a researcher name.

The unnumbered benefit is the one that’s closest to being new: that a new study of 80,000 people in China found higher HDL (good) cholesterol in people who drank a moderate amount of alcohol — which isn’t all that surprising, since that relationship has been studied for decades.  Here, the research is unpublished: it was presented at a conference this week. The basic conclusion was for moderate consumption of alcohol of any type, not just beer.

Number 1 (lowers the risk of kidney stones) seems to be true and about beer, though the story doesn’t mention that all the participants were smokers.

Number 2 (protects you from heart attacks) was about beer, but it wasn’t about heart attacks. It was about atherosclerosis. In hamsters.

Number 3 (reduces the risk of strokes) is hard to track down — “Harvard Medical School” isn’t very specific. They probably mean this research, which found a slightly lower risk of stroke in people (US male doctors) who drink small amounts of alcohol, not zero, but up to seven drinks a week.  The probably don’t mean this Harvard research showing the risk goes up for the hour after consumption. Again, not specifically beer.

In number 4, the headline claim “strengthens your bones” is borderline true, but the later “significantly reduce your risk of fracturing bones” doesn’t seem to be supported. The research actually found an increase in bone mineral density, which you’d expect to lead to stronger bones but doesn’t always.

Number 5 is partly true: the research wasn’t specific to beer, but men who drink 1-2 standard units of alcohol per day are at lower risk of diabetes, though the evidence that the alcohol is responsible isn’t all that strong.

Number 6 is “reduces the risk of Alzheimer’s”. The story talks about research stretching back to 1977. The Alzheimer’s Society says “It is no longer thought that low to moderate alcohol consumption protects against dementia.” The story mentions silicon and aluminium. The Alzheimer’s Society says Current medical and scientific opinion of the relevant research indicates that the findings do not convincingly demonstrate a causal relationship between aluminium and Alzheimer’s disease.”

Number 7 is about preventing insomnia. It glosses over the alcohol issue entirely.  The research was about the taste of beer, used a dose of less than a tablespoon, and didn’t measure insomnia. It didn’t even measure relaxation, just brain waves.

Number 8 (prevents cataracts). From the press release. “In tests with rat lenses, Trevithick’s laboratory found that antioxidants that act similarly to those in beer protect special parts of cells in the eye – called mitochondria. Damaged mitochondria can lead to an increased incidence of cataracts.” They weren’t looking at beer or even at chemicals in beer, or at cataracts. It’s a step forward to know that chemicals similar to those in beer can reduce damage in rats similar to the damage that causes cataracts, but that still leaves some gaps.

Number 9 (might cure cancer). Chemicals related to some chemicals in beer, at high enough doses, might potentially be turned into cancer treatments.  In order to do the first steps of the research, using the original beer chemicals, scientists need to be able to measure how much they have of them. To calibrate the measurements, they need pure synthetic versions. The research was about progress in working out the synthesis.

Number 10 is particularly special  –“beer helps you lose weight”. Not only is there a specific and detailed explanation of why that’s false in the original press release, it’s even in the Herald story — the doses in the study were the equivalent of 3500 pints of beer per day.
 

November 14, 2016

Stat of the Week Competition: November 12 – 18 2016

Each week, we would like to invite readers of Stats Chat to submit nominations for our Stat of the Week competition and be in with the chance to win an iTunes voucher.

Here’s how it works:

  • Anyone may add a comment on this post to nominate their Stat of the Week candidate before midday Friday November 18 2016.
  • Statistics can be bad, exemplary or fascinating.
  • The statistic must be in the NZ media during the period of November 12 – 18 2016 inclusive.
  • Quote the statistic, when and where it was published and tell us why it should be our Stat of the Week.

Next Monday at midday we’ll announce the winner of this week’s Stat of the Week competition, and start a new one.

(more…)

Stat of the Week Competition Discussion: November 12 – 18 2016

If you’d like to comment on or debate any of this week’s Stat of the Week nominations, please do so below!

November 13, 2016

What polls aren’t good for

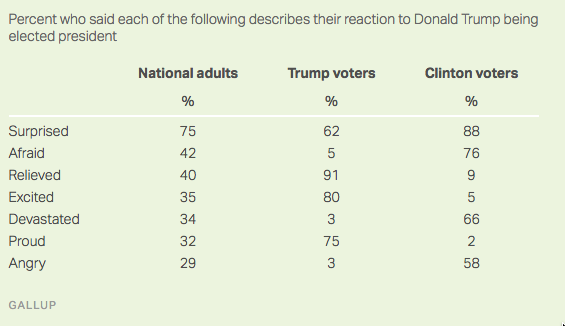
From Gallup, how Americans feel about the election

gallup

We can believe the broad messages that many people were surprised; that Trump supporters have positive feelings; that Clinton supporters have negative feelings; that there’s more anger and fear expressed that when Obama first was elected (though not than when he was re-elected). The surprising details are less reliable.

I’ve seen people making a lot of the 3% apparent “buyer’s remorse” among Trump voters, with one tweet I saw saying those votes would have been enough to swing the election. First of all, Clinton already has more votes that Trump, just distributed suboptimally, so even if these were Trump voters who had changed their minds it might not have made any difference to the result.  More importantly, though, Gallup has no way of knowing who the respondents voted for, or even if they voted at all.  The table is just based on what they said over the phone.

It could be that 3% of Trump voters regret it. It could also be that some Clinton voters or some non-voters claimed to have voted for Trump.  As we’ve seen in past examples even of high-quality social surveys, it’s very hard to estimate the size of a very small subpopulation from straightforward survey data.

November 12, 2016

Fizzy headlines

Herald (Daily Mail) headline: How just one can of fizzy drink a day raises the risk of developing type 2 diabetes by 50pc. Here’s the research abstract

  1. The research was about pre-diabetes, or ‘elevated fasting glucose/impaired glucose tolerance’ as it used to be called, not diabetes.  They aren’t remotely the same thing. According to this other research, so-called pre-diabetes has about a 5-10% chance per year of turning into diabetes and about the same chance of just going away.  About half the people in the study  developed pre-diabetes over a seven-year period, even among those who didn’t drink any soft drinks.
  2. The researchers distinguished sugar-sweetened and diet drinks (they saw no suggestion of a risk increase for diet drinks) but did not distinguish fizzy from non-fizzy sugar-sweetened drinks. So the headline divides drinks up in a completely different way from the research. This wasn’t ‘fizzy drink’ research.
  3. The research paper reports multiple estimates of the risk increase. Some models said nearly 50%, but some said about 25%.
  4. There’s a lot of uncertainty even in the purely mathematical sense: the model that says nearly 50% increase came with an uncertainty interval that goes down to 16%, and the one that says 25% has an uncertainty interval going all the way down to zero.

The research itself is perfectly reasonable, providing a bit more evidence on the risks of high-sugar diet (disclaimer: I know a few of the researchers). Even the story isn’t too bad, but the headline is basically completely wrong.

November 11, 2016

A little history, for the Cubs

Ok, there has been more news since the Chicago Cubs won the World Series than you get in most years. But I still wanted to give some excerpts from what statisticians were writing the last time the Cubs won.

social

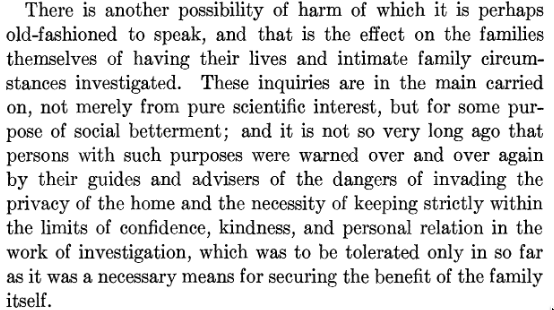
This is from “The Use and Misuse of Statistics in Social Work” by Kate Holladay Claghorn, in  Publications of the American Statistical Association Vol. 11, No. 82 (Jun., 1908), pp. 150-167.

Her primary examples of ‘misuse’ are investigations carried out with inadequate sample sizes or measurement approaches and results presented in hard-to-understand ways, but she also writes about the harms of research

social2

I didn’t recognise her name, but I see from Wikipedia that Dr Claghorn was the first woman at Yale whose PhD was actually awarded at the commencement ceremony, and that she became one of the founders of the NAACP.


Briefly

  • Comparing the results of different geocoding (ie, address-looking-up) software (from Richard Law)
November 10, 2016

Understanding uncertainty

Predicting the US election result wasn’t a Big Data problem. There had only ever been 57 presidential elections and there’s good polling data for less than half of them. What it shares with a lot of Big Data problems is the difficulty of making sure you have thought about all the uncertainty, in particular when there’s a lot less information than it looks like there is, and the quality of that information is fairly low.

In particular, it’s a lot easier to get an accurate prediction of the mean opinion-poll result and a good estimate of its uncertainty than it is to translate that into uncertainty over number of states won.  It’s not hard to find out what your model thinks the uncertainty is; that’s just a matter of running the model over and over again in simulation. But simulation won’t tell you what sources of uncertainty you’ve left out.

For the US elections it turns out one thing that matters is the amount of correlation between states in the polling errors. Since there are 1225 correlations and maybe twenty elections worth of good polling data, the correlations aren’t going to be empirically determinable even if you assume there’s nothing special about this election– you need to make assumptions about how the variables you have relate to the ones you’re trying to predict.

The predictions from 538 still might not have been based on correct assumptions, but they were good enough for their conclusions to be basically right — and no-one else’s were, apparently even including the Trump campaign.

It’s not that we should give up on modelling. As we saw last time, sitting around listening to experts pull numbers out of the air works rather worse. But it’s important to understand the uncertainty in predictions can be a lot more than you’d get by asking the model — and the same is true, only much worse, when you’re modelling the effects of social or health interventions rather than just forecasting.