Posts from July 2016 (39)

July 6, 2016

Super 18 Predictions for Round 16

Team Ratings for Round 16

The basic method is described on my Department home page.

Here are the team ratings prior to this week’s games, along with the ratings at the start of the season.

Current Rating Rating at Season Start Difference
Crusaders 8.89 9.84 -0.90
Highlanders 7.43 6.80 0.60
Hurricanes 6.67 7.26 -0.60
Waratahs 6.65 4.88 1.80
Lions 6.17 -1.80 8.00
Chiefs 5.46 2.68 2.80
Brumbies 5.27 3.15 2.10
Stormers 1.74 -0.62 2.40
Sharks 1.57 -1.64 3.20
Bulls -4.23 -0.74 -3.50
Blues -4.59 -5.51 0.90
Cheetahs -7.42 -9.27 1.90
Rebels -7.50 -6.33 -1.20
Jaguares -7.88 -10.00 2.10
Reds -9.40 -9.81 0.40
Force -10.40 -8.43 -2.00
Sunwolves -20.13 -10.00 -10.10
Kings -21.54 -13.66 -7.90


Performance So Far

So far there have been 117 matches played, 86 of which were correctly predicted, a success rate of 73.5%.
Here are the predictions for last week’s games.

Game Date Score Prediction Correct
1 Chiefs vs. Crusaders Jul 01 23 – 13 -5.30 FALSE
2 Brumbies vs. Reds Jul 01 43 – 24 18.10 TRUE
3 Sunwolves vs. Waratahs Jul 02 12 – 57 -19.70 TRUE
4 Hurricanes vs. Blues Jul 02 37 – 27 15.40 TRUE
5 Rebels vs. Stormers Jul 02 31 – 57 -2.40 TRUE
6 Cheetahs vs. Force Jul 02 30 – 29 7.80 TRUE
7 Kings vs. Highlanders Jul 02 18 – 48 -24.30 TRUE
8 Lions vs. Sharks Jul 02 37 – 10 5.50 TRUE
9 Jaguares vs. Bulls Jul 02 29 – 11 -2.10 FALSE


Predictions for Round 16

Here are the predictions for Round 16. The prediction is my estimated expected points difference with a positive margin being a win to the home team, and a negative margin a win to the away team.

Game Date Winner Prediction
1 Blues vs. Brumbies Jul 08 Brumbies -5.90
2 Reds vs. Chiefs Jul 08 Chiefs -10.90
3 Lions vs. Kings Jul 08 Lions 31.20
4 Crusaders vs. Rebels Jul 09 Crusaders 20.40
5 Waratahs vs. Hurricanes Jul 09 Waratahs 4.00
6 Force vs. Stormers Jul 09 Stormers -8.10
7 Bulls vs. Sunwolves Jul 09 Bulls 19.90
8 Sharks vs. Cheetahs Jul 09 Sharks 12.50
9 Jaguares vs. Highlanders Jul 09 Highlanders -11.30


NRL Predictions for Round 18

Team Ratings for Round 18

The basic method is described on my Department home page.

Here are the team ratings prior to this week’s games, along with the ratings at the start of the season.

Current Rating Rating at Season Start Difference
Storm 11.41 4.41 7.00
Cowboys 10.32 10.29 0.00
Sharks 5.92 -1.06 7.00
Bulldogs 5.02 1.50 3.50
Broncos 3.55 9.81 -6.30
Raiders 1.59 -0.55 2.10
Eels 1.03 -4.62 5.70
Sea Eagles -0.31 0.36 -0.70
Panthers -1.28 -3.06 1.80
Roosters -1.41 11.20 -12.60
Warriors -2.22 -7.47 5.20
Titans -3.70 -8.39 4.70
Dragons -3.94 -0.10 -3.80
Rabbitohs -3.95 -1.20 -2.70
Wests Tigers -4.54 -4.06 -0.50
Knights -15.81 -5.41 -10.40


Performance So Far

So far there have been 126 matches played, 77 of which were correctly predicted, a success rate of 61.1%.
Here are the predictions for last week’s games.

Game Date Score Prediction Correct
1 Roosters vs. Bulldogs Jun 30 20 – 24 -3.30 TRUE
2 Broncos vs. Storm Jul 01 6 – 48 0.80 FALSE
3 Warriors vs. Titans Jul 02 27 – 18 4.80 TRUE
4 Wests Tigers vs. Panthers Jul 02 34 – 26 -1.60 FALSE
5 Sharks vs. Eels Jul 02 34 – 24 7.50 TRUE
6 Raiders vs. Knights Jul 03 29 – 25 23.00 TRUE
7 Rabbitohs vs. Cowboys Jul 03 0 – 20 -9.80 TRUE
8 Sea Eagles vs. Dragons Jul 04 36 – 6 3.00 TRUE


Predictions for Round 18

Here are the predictions for Round 18. The prediction is my estimated expected points difference with a positive margin being a win to the home team, and a negative margin a win to the away team.

Game Date Winner Prediction
1 Eels vs. Roosters Jul 08 Eels 5.40
2 Bulldogs vs. Wests Tigers Jul 09 Bulldogs 9.60
3 Panthers vs. Sharks Jul 10 Sharks -4.20
4 Raiders vs. Cowboys Jul 11 Cowboys -5.70


July 4, 2016

Run away

There’s a piece in the Herald, from The Conversation (with attribution, and links intact, yay!), on the supposed brain benefits of running.  There’s an interesting evolutionary speculation that humans, specifically, might benefit from running because of our pre-history of long-distance running to hunt

The growth of new brain cells in the hippocampus and the enhancement of spatial memory that is brought on by endurance running is basically an evolutionary safety net for when you have outrun your knowledge, when you have run so far that you no longer know where you are and you need to learn, fast. It is a mechanism that makes information uptake easiest when historically you might have been tired, lost, and at your most vulnerable.

There’s also some actual evidence on brain cell growth

What the new research tells us is that it is not just any exercise that will create new brain cells for you. In the study by Finnish researchers, they discovered that only certain kinds of exercise are likely to result in the growth of new brain cells in adults.

As you will find if you follow the link (but not from reading the story), that research is in rats. Unless their ancestors, too, pursued their prey across miles of African savannah, it rather tends to undermine the evolutionary argument.

Stat of the Week Competition: July 2 – 8 2016

Each week, we would like to invite readers of Stats Chat to submit nominations for our Stat of the Week competition and be in with the chance to win an iTunes voucher.

Here’s how it works:

  • Anyone may add a comment on this post to nominate their Stat of the Week candidate before midday Friday July 8 2016.
  • Statistics can be bad, exemplary or fascinating.
  • The statistic must be in the NZ media during the period of July 2 – 8 2016 inclusive.
  • Quote the statistic, when and where it was published and tell us why it should be our Stat of the Week.

Next Monday at midday we’ll announce the winner of this week’s Stat of the Week competition, and start a new one.

(more…)

Stat of the Week Competition Discussion: July 2 – 8 2016

If you’d like to comment on or debate any of this week’s Stat of the Week nominations, please do so below!

July 3, 2016

Briefly

July 2, 2016

Dark and full of terrors

Two items from the Herald this week:

70-year-old licked by dog nearly dies from blood poisoning

One paracetamol in pregnancy could raise risk of autism

There has long been an argument over whether the daily news reports should show more good news (that isn’t sports). Supporters of the status quo argue that the bad news is the important news. That might be true for wars and rumors of war, but it isn’t true in stories fishing for a scary health problem.

The dog story reported a cause of sepsis that has been diagnosed about once every two years in the UK over the past quarter-century. Since there are about 30,000 cases of sepsis per year in the UK, that’s 0.00% of cases, to two decimal places.  It wouldn’t be surprising if the health benefits of having a dog were larger than this, and it’s pretty clear the benefits in happiness are.

The paracetamol story is the other sort of unnecessary health scare: something that probably isn’t true and certainly isn’t supported by enough evidence for a public-health warning.  Since paracetamol has nothing to recommend it as a recreational drug, women who take it during pregnancy are probably doing so for a good reason, and it’s going to be hard to distinguish the effects of that reason from those of the drug.

In fact, the study  (Table 2)found that mothers who took paracetamol during pregnancy had slightly lower risk of autism-spectrum symptoms in their children than those who didn’t. However, the mothers who took paracetamol looked as if they should have already have been at lower risk than those who didn’t. When the researchers attempted to control for this, there was basically the same risk of autism-spectrum symptoms in the children of those who took paracetamol as those who didn’t.

However, the basically-no-difference could be separated out into a higher level of symptoms  in boys and a lower level in girls, by a bit more than half a point on a scale where 15 points is the threshold for likely autism.  This got reported in the story as

There was also a link with paracetamol and signs of autism – but only in boys.

And the “One paracetamol” headline? There was absolutely no analysis in the paper comparing ‘one paracetamol’ to no paracetamol.

July 1, 2016

Too good to check

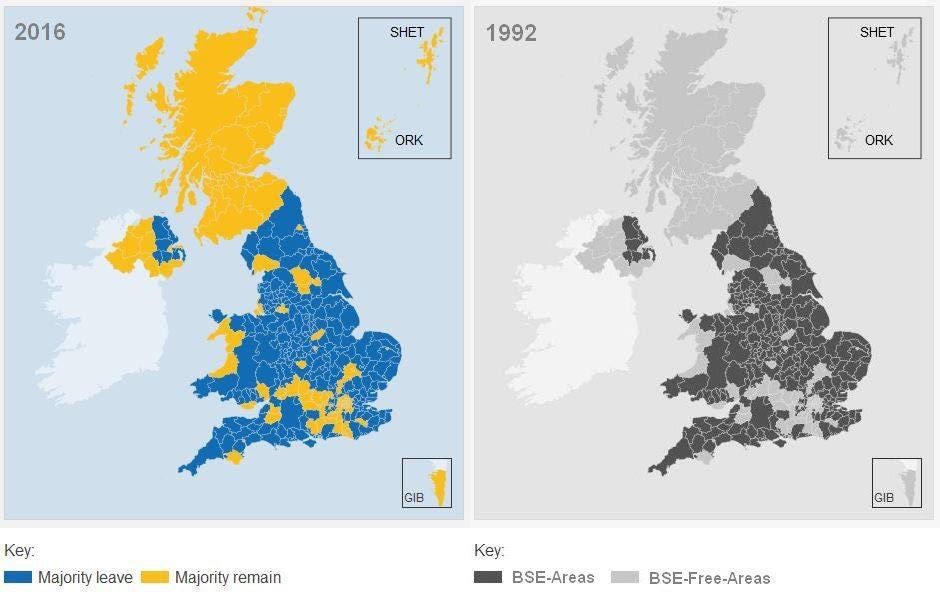
Twitter is a good way to get news and rumours of news from across the world, but it also exposes you to a lot of items that are either deliberate fraud or just ‘too good to check’.  Here’s one: it claims to compare maps of the ‘Leave’ vote with BSE prevalence.

CmEelBoUYAAysiE

It’s clear what idea the author was going for, and it’s also clear that it has to be unfounded as well as malicious. The BSE prions weren’t preferentially consumed in farming areas — people in cities eat hamburgers, too — and nvCJD is not only very rare, but primarily affects movement rather than political beliefs.

However, it’s not inconceivable that farming areas which experienced losses from BSE and then later from foot-and-mouth would be anti-government and possibly anti-European. Some correlation, even a strong correlation, would be possible for that reason.

If you cared about the truth, there’s a simple two-word Google search you could do before passing on the maps: BSE Scotland. Yes, there was mad cow disease north of the border. You could also note the implausibility of having exactly the same map layout, and a color scheme that was just a grayscale version of the modern one.

Thinking about the numbers

More students cheat in exams, and most are in Auckland, says the Herald.

This story combines two frequent StatsChat themes: denominators, and being careful about what was actually measured.

Auckland, as we have noted before, has a higher population than other regions.  As you will recall, it’s about a third of the NZ population, so it looks like making up about 50% of those caught cheating is excessive. That’s the sort of work that the paper might do for you — as well as checking if 1/3 is still about right as the proportion of students sitting NCEA exams (it seems to be).

On similar lines, if you look just at the totals without denominators, you’ll miss some notable values.  Northland had 25 students caught cheating, which is more than the much-larger Waikato and Canterbury regions. You’d expect about 10 at the national average rate and about 15 at the Auckland rate.

Much more important is the question of what proportion of those cheating were caught — to say things like

Again Central Plateau and the Cook Islands had no cheaters, and Wairarapa and Southland students were also honest

or to draw conclusions about trends over time assumes that you’re not missing many.

The story says

NZQA received 1,314,207 entries in NCEA and New Zealand Scholarship examinations from 145,464 students last year.

The 290 attempts at cheating that were caught come to just under 0.2% of students and just over 0.02% of exams.  Maybe I’m just cynical, but I’d be surprised if the real rate was as low as one exam in a thousand, let alone five times lower.