Another set of rugby predictions
The Herald has a new set of rugby team ratings going back into history, with pretty graphs as well, based on work by UoA student Wil Undy. These are ‘Elo’ ratings in the modified sense that fivethirtyeight.com uses the term. The original Elo method was for chess, where you only get a winner, not a margin of victory, but it’s been updated to use the extra information from the winning margin.
So, how are these different from the StatsChat ratings? The methods are fairly similar: there’s a rating for each team, which is updated using the results of each game, and there’s a tuning parameter that controls how much each new game is allowed to change the rating.
The primary difference is how the ratings are calibrated. In David Scott’s system the difference in ratings estimates the margin; in an Elo system the difference in ratings can be converted into a predicted probability of winning.
Just based on crude probability of getting the right winner, the StatsChat predictions may be very slightly better — for the last three seasons of Super 15, David Scott has got 65%, 66%, and 68% right, and the Herald claims 64-65% for Will Undy’s model. On the other hand, if you actually want to bet, a predicted probability could be more useful than a predicted margin.
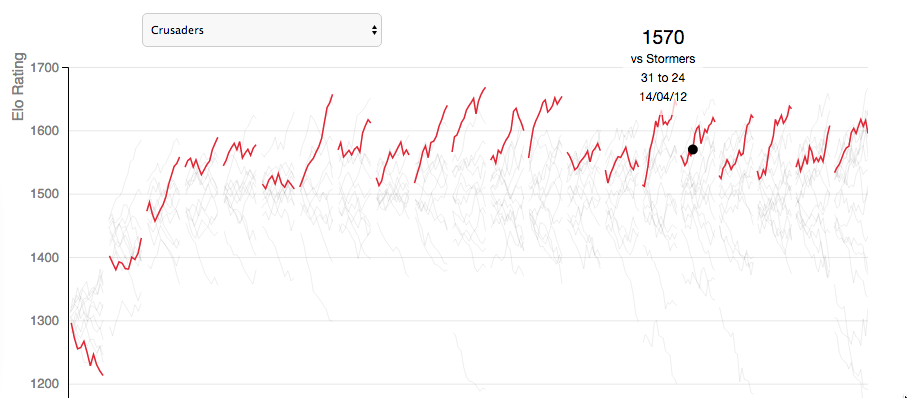
The graph for the Crusaders shows one interesting feature of the model
The Crusaders’s rating has improved through the season in every season for the past 15 years, suggesting that the between-season correction is too strong, or that memory for more than one year into the past might be helpful.
Rugby fans will be able to find other interesting patterns and places where tweaks could be made. What’s interesting about both Wil Undy’s new method and David Scott’s approach is how well you can do with a formula that knows nothing about rugby or rugby players and only remembers one number for each team. These models are most interesting as a baseline: how much better can you do by following the news and taking advantage of actual rugby knowledge?
Thomas Lumley (@tslumley) is Professor of Biostatistics at the University of Auckland. His research interests include semiparametric models, survey sampling, statistical computing, foundations of statistics, and whatever methodological problems his medical collaborators come up with. He also blogs at Biased and Inefficient See all posts by Thomas Lumley »

Don’t forget Stuff’s!
http://www.stuff.co.nz/sport/rugby/super-rugby/77284293/Interactive-The-history-of-every-Super-Rugby-team
Thx.
9 years ago
The Crusader shape might be some function of the draw – they played the easiest teams early and the hardest teams last. From memory the draw was pretty consistent from
year to year but at some point it was probably seeded i.e. the best team getting the easiest run across the season.
The Hurricanes used to go to South Africa early and they’d do it tough. People would write them off because they were so low on the table but then they’d have a run of easier teams/playing conditions and would make a late run up the table – and people would be surprised.
9 years ago
If the model is properly calibrated the order of the draw doesn’t matter much — certainly not that much.
9 years ago