Posts from May 2016 (41)

May 18, 2016

NRL Predictions for Round 11

Team Ratings for Round 11

The basic method is described on my Department home page.

Here are the team ratings prior to this week’s games, along with the ratings at the start of the season.

Current Rating Rating at Season Start Difference
Broncos 12.11 9.81 2.30
Cowboys 12.06 10.29 1.80
Storm 6.67 4.41 2.30
Sharks 6.35 -1.06 7.40
Bulldogs 2.36 1.50 0.90
Roosters 1.90 11.20 -9.30
Eels 0.88 -4.62 5.50
Panthers 0.45 -3.06 3.50
Raiders -0.55 -0.55 0.00
Sea Eagles -0.64 0.36 -1.00
Rabbitohs -0.89 -1.20 0.30
Dragons -3.24 -0.10 -3.10
Titans -5.04 -8.39 3.30
Warriors -6.04 -7.47 1.40
Wests Tigers -8.78 -4.06 -4.70
Knights -15.92 -5.41 -10.50


Performance So Far

So far there have been 80 matches played, 44 of which were correctly predicted, a success rate of 55%.
Here are the predictions for last week’s games.

Game Date Score Prediction Correct
1 Dragons vs. Raiders May 12 16 – 12 -0.40 FALSE
2 Eels vs. Rabbitohs May 13 20 – 22 5.90 FALSE
3 Panthers vs. Warriors May 14 30 – 18 5.60 TRUE
4 Storm vs. Cowboys May 14 15 – 14 -6.50 FALSE
5 Broncos vs. Sea Eagles May 14 30 – 6 14.40 TRUE
6 Knights vs. Sharks May 15 0 – 62 -12.80 TRUE
7 Wests Tigers vs. Bulldogs May 15 4 – 36 -7.80 TRUE
8 Titans vs. Roosters May 16 26 – 6 -7.70 FALSE


Predictions for Round 11

Here are the predictions for Round 11. The prediction is my estimated expected points difference with a positive margin being a win to the home team, and a negative margin a win to the away team.

Game Date Winner Prediction
1 Rabbitohs vs. Dragons May 19 Rabbitohs 2.40
2 Cowboys vs. Broncos May 20 Cowboys 2.90
3 Wests Tigers vs. Knights May 21 Wests Tigers 10.10
4 Warriors vs. Raiders May 21 Raiders -1.50
5 Sharks vs. Sea Eagles May 21 Sharks 10.00
6 Panthers vs. Titans May 22 Panthers 8.50
7 Bulldogs vs. Roosters May 22 Bulldogs 3.50
8 Eels vs. Storm May 23 Storm -2.80


May 17, 2016

Housing prices, SF edition

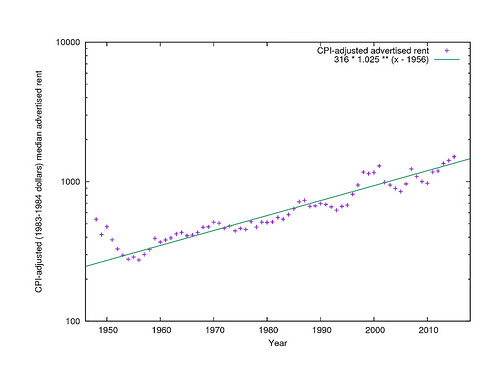
Eric Fischer set out to look at rental price trends in San Francisco. The standard dataset goes back only to 1979, which was also the start of rent control. Most people would have stopped there. But no:

I set out to replicate the DataBook’s methodology over a wider range of years, … Mostly I used the San Francisco Public Library’s page scans of the newspaper but resorted to microfilm for the few later years where no page scans are available.

That is, he copied down and entered the prices from the ads by hand.

There has been a remarkable constant trend in SF rental prices since the mid-1950s, with median real prices increasing steadily by 2.5%/year, decade after decade.26941938971_ea9415db14

For the years since 1975, when employment data are available, most of the deviations from this trend can be explained by increases or decreases in numbers of homes in the city, increases or decreases in number of jobs, and increases or decreases in total real salaries and wages paid (specifically salaries and wages, not all income).

Rent control didn’t have a big impact. Speculation didn’t have a big impact — prices were higher during the boom of the 1990s, but only as much as would be expected from more people in the city and the higher salaries and wages they were paid.

San Francisco County already has a population density of over 7000 people per square km — lower than the Auckland CBD, but higher than anywhere else in Auckland. It’s hard for them to increase supply enough to reduce prices, but they might manage to increase supply enough to stabilise prices.

(via Michael Andersen and @BarbsNZgarden)

Briefly

  • You’ve probably seen this, but Facebook’s news feed editing wasn’t as algorithmic as they were suggesting. Of course, that tells you nothing one way or the other about bias, as people including Cathy O’Neil point out.
  • The difficulties of turning data science into gobs and gobs of money, as illustrated by Palantir. From Roger Peng at Simply Statistics.
  • Finally for stats/literature dual nerds, an excerpt from the new book by historian of statistics Stephen Stigler

May 16, 2016

Stat of the Week Competition: May 14 – 20 2016

Each week, we would like to invite readers of Stats Chat to submit nominations for our Stat of the Week competition and be in with the chance to win an iTunes voucher.

Here’s how it works:

  • Anyone may add a comment on this post to nominate their Stat of the Week candidate before midday Friday May 20 2016.
  • Statistics can be bad, exemplary or fascinating.
  • The statistic must be in the NZ media during the period of May 14 – 20 2016 inclusive.
  • Quote the statistic, when and where it was published and tell us why it should be our Stat of the Week.

Next Monday at midday we’ll announce the winner of this week’s Stat of the Week competition, and start a new one.

(more…)

Stat of the Week Competition Discussion: May 14 – 20 2016

If you’d like to comment on or debate any of this week’s Stat of the Week nominations, please do so below!

May 13, 2016

Aggregation, not ok?

You’ve probably heard of OkCupid, a dating site. People give sites like that a lot of personal information. And, in a sense, the information is obviously not going to be kept secret — after all, the point of using a dating site is to be found by people you don’t already know.  When someone writes a script to collect the data from large numbers of users, and then publishes it in a convenient and easy to process format, you can just about see how they’d think that was ok. It’s harder to see how they’d be surprised not everyone feels that way.

Aggregation makes a difference because we can search, match, and analyse the data by computer. That’s important for two reasons.

First, it’s quicker and easier — you can get a set of records grouped by sexual preference or other interests almost as quickly as you can think of the question, and you can link usernames or other information to other datasets. The database includes potential matching variables like income, education level, age, job, country, city, which you could still use just taking down data one person at a time by hand, but it would be slow and boring.

Second, the database is impersonal. If you stood outside a gay bar watching who went in and out, you couldn’t really pretend you were innocently using publicly visible information.  If you signed up and went through dating profiles one at a time, it would be easier to pretend, but you’d still tend to see the people behind the data. When it’s a big spreadsheet, it’s easier to ignore how the people would feel about it.

Sometimes people aggregate and publish data knowing it may do harm, because they think there’s a higher interest involved in getting the data out — even if the data release is obviously illegal. This release isn’t obviously illegal (though there are possibilities), but the higher interest is pretty obscure too. The accompanying research paper says

As an example of the analyses one can do with the dataset, a cognitive ability test is constructed from 14 suitable items. To validate the dataset and the test, the relationship of cognitive ability to religious beliefs and political interest/participation is examined.

Those variables are so not what’s going to attract people to these data. But even if you think it’s important for anyone on the internet to be able to do that sort of correlation for variables such as sexual orientation and drug use, it’s hard to think of a reason to include the OkCupid username.

May 12, 2016

Stretching it a bit

Q; Did you see yoghurt prevents cancer?

A: Where?

Q: The Herald (from the Daily Telegraph): “8 ways to lower your cancer risk.” Number one is “Eat yoghurt”. And they even have a link to research. How’s that for impressive?

A: Not exactly a link. They mention the name of a journal, but don’t even give the researchers’ names.

Q: Can’t you find them?

A: Of course. It’s even open-access.

Q: So, how much yoghurt did the people have to eat?

A: No yoghurt was harmed in this experiment. Also no people.

Q: Mice?

A: Mice.

Q: But yoghurt?

A: No. Some of the mice were set up with a restricted set of gut bacteria (missing known nasty ones) by being raised in a mouse colony who all had the restricted set.

Q: But the story says “gave one group of mice beneficial bacteria through probiotic supplements and the other non-beneficial bacteria.

A: Yes, it does. The research paper, not so much. Nor even the press release.

Q: So why yoghurt?

A: One of the bacteria that was more common in the mice with the restricted set is a Lactobacillus strain. Other Lactobacillus strains, even sometimes from the same species, are involved in making yoghurt, sourdough, sauerkraut, kimchi, etc.

Q: And you could use the mouse bacteria to make these foods?

A: In principle, probably, though you might not want to advertise it that way.

Q: So, the mice with more Lactobacillus were less likely to get cancer?

A: These were mutant mice who all get cancer, so that’s not really the question. They took longer to get cancer.

Q: So we can’t really be confident yoghurt would prevent normal mice from getting cancer?

A: No, it’s too soon to tell.

Q: Good thing normal mice don’t read the newspapers, then.

May 11, 2016

Super 18 Predictions for Round 12


Team Ratings for Round 12

The basic method is described on my Department home page.

Here are the team ratings prior to this week’s games, along with the ratings at the start of the season.

Current Rating Rating at Season Start Difference
Crusaders 10.09 9.84 0.30
Hurricanes 7.09 7.26 -0.20
Highlanders 6.86 6.80 0.10
Chiefs 5.22 2.68 2.50
Waratahs 3.78 4.88 -1.10
Brumbies 2.75 3.15 -0.40
Stormers 1.62 -0.62 2.20
Sharks 1.29 -1.64 2.90
Lions 0.00 -1.80 1.80
Bulls -0.10 -0.74 0.60
Blues -3.68 -5.51 1.80
Rebels -5.29 -6.33 1.00
Cheetahs -7.08 -9.27 2.20
Jaguares -7.24 -10.00 2.80
Reds -9.61 -9.81 0.20
Force -10.87 -8.43 -2.40
Sunwolves -17.32 -10.00 -7.30
Kings -20.75 -13.66 -7.10


Performance So Far

So far there have been 85 matches played, 58 of which were correctly predicted, a success rate of 68.2%.
Here are the predictions for last week’s games.

Game Date Score Prediction Correct
1 Crusaders vs. Reds May 06 38 – 5 22.40 TRUE
2 Brumbies vs. Bulls May 06 23 – 6 5.50 TRUE
3 Sunwolves vs. Force May 07 22 – 40 -0.30 TRUE
4 Chiefs vs. Highlanders May 07 13 – 26 3.90 FALSE
5 Waratahs vs. Cheetahs May 07 21 – 6 14.80 TRUE
6 Sharks vs. Hurricanes May 07 32 – 15 -4.40 FALSE
7 Kings vs. Blues May 07 18 – 34 -12.70 TRUE


Predictions for Round 12

Here are the predictions for Round 12. The prediction is my estimated expected points difference with a positive margin being a win to the home team, and a negative margin a win to the away team.

Game Date Winner Prediction
1 Highlanders vs. Crusaders May 13 Highlanders 0.30
2 Rebels vs. Brumbies May 13 Brumbies -4.50
3 Hurricanes vs. Reds May 14 Hurricanes 20.70
4 Waratahs vs. Bulls May 14 Waratahs 7.90
5 Sunwolves vs. Stormers May 14 Stormers -14.90
6 Cheetahs vs. Kings May 14 Cheetahs 17.20
7 Lions vs. Blues May 14 Lions 7.70
8 Jaguares vs. Sharks May 14 Sharks -4.50


May 10, 2016

Foreign real-estate investment

The first data under the new real-estate ownership reporting scheme is out. The Herald has a story and also includes a full copy of the report.

So, what proportion of Auckland property sales were reported as being to China?

In Auckland, the level of foreign investment was slightly higher than the national level, at 4 per cent, or 474 properties. Nearly 60 per cent of these properties went to Chinese tax residents.

That’s 60% of 4%, or a bit under 2.5%.  Auckland is different; in the rest of New Zealand the majority of foreign (tax-residency) investors are Australians.

The LINZ report does a good job explaining the real limitations of `tax residence’ as a criterion, but it’s a lot better than any previous data we’ve had.

There were also questions about actual residency and intention to occupy a home, but these were harder to interpret because of property bought by companies or trusts, where the questions didn’t have a good answer.

I’d suggest starting with the report rather than the news coverage.


May 9, 2016

What’s wrong with science news

“Coffee today is like God in the Old Testament”, says John Oliver, reviewing the positive and negative headlines over the past year or so.  It’s excellent, if a little overblown in places.

On a related note, another site has fallen for the ‘cheese addiction/casomorphin’ hoax that we’ve seen before a few times. This time it’s Pharmacy Times.