Posts from March 2016 (44)

March 9, 2016

Making it truly better by bus

Tom ElliottAuckland commuters know the frustration well: You’re waiting for a bus, and the electronic board shows it’s three minutes away. Ten minutes later, you’re still standing there, wondering what’s going on. Or the board may say a bus is 10 minutes away – but it suddenly turns up when you’re not paying attention.

Department of Statistics doctoral student Tom Elliott, pictured, also knows that irritation well – he was once a regular bus user – and his PhD research aims to come up with a model that leads to better predictions. Read the full story here.

Not the most literate?

The Herald (and/or the Otago Daily Times) say

 New Zealand is the fifth most literate country in the world.

and

New Zealand ranked higher than Germany (9), Canada (10), the US (11), UK (14) and Australia (15).

Newshub had a similar story and the NZEI welcomed the finding.  One of the nice things about the Herald story is it provides a link. If you follow that link, the ratings look a bit different.

literacy

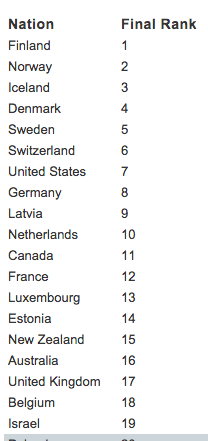
There are five other rankings in addition to the “Final Rank”, but none of them has NZ at number five.

lit2

So, where did the numbers come from? It can’t be a mistake at the Herald, because Newshub had the same numbers (as did Finland Todayand basically everyone except the Washington Post)

Although nobody links, I did track down the press release. It has the ranks given by the Herald, and it has the quotes they used from the creator of the ranking.  The stories would have been written before the site went live, so the reporters wouldn’t have been able to check the site even if it had occurred to them to do so.  I have no idea how the press release managed to disagree with the site itself, and while it would be nice to see corrections published, I won’t hold my breath.


Underlying this relatively minor example is a problem with the intersection of ‘instant news’ and science that I’ve mentioned before.  Science stories are often written before the research is published, and often released before it is published. This is unnecessary except for the biggest events: the science would be just as true (or not) and just as interesting (or not) a day later.

At least the final rank still shows NZ beating Australia.

Super 18 Predictions for Round 3

Team Ratings for Round 3

The basic method is described on my Department home page.

Here are the team ratings prior to this week’s games, along with the ratings at the start of the season.

Current Rating Rating at Season Start Difference
Crusaders 8.71 9.84 -1.10
Brumbies 6.44 3.15 3.30
Highlanders 5.92 6.80 -0.90
Hurricanes 4.97 7.26 -2.30
Waratahs 4.22 4.88 -0.70
Chiefs 2.90 2.68 0.20
Stormers 0.80 -0.62 1.40
Lions -0.50 -1.80 1.30
Sharks -0.63 -1.64 1.00
Bulls -1.24 -0.74 -0.50
Blues -4.73 -5.51 0.80
Rebels -6.61 -6.33 -0.30
Force -7.77 -8.43 0.70
Jaguares -9.08 -10.00 0.90
Cheetahs -9.81 -9.27 -0.50
Sunwolves -10.53 -10.00 -0.50
Reds -11.03 -9.81 -1.20
Kings -15.25 -13.66 -1.60


Performance So Far

So far there have been 17 matches played, 10 of which were correctly predicted, a success rate of 58.8%.
Here are the predictions for last week’s games.

Game Date Score Prediction Correct
1 Crusaders vs. Blues Mar 04 28 – 13 17.20 TRUE
2 Brumbies vs. Waratahs Mar 04 32 – 15 4.20 TRUE
3 Chiefs vs. Lions Mar 05 32 – 36 9.00 FALSE
4 Highlanders vs. Hurricanes Mar 05 17 – 16 4.90 TRUE
5 Reds vs. Force Mar 05 6 – 22 2.50 FALSE
6 Bulls vs. Rebels Mar 05 45 – 25 7.90 TRUE
7 Cheetahs vs. Stormers Mar 05 10 – 20 -6.70 TRUE
8 Sharks vs. Jaguares Mar 05 19 – 15 13.60 TRUE


Predictions for Round 3

Here are the predictions for Round 3. The prediction is my estimated expected points difference with a positive margin being a win to the home team, and a negative margin a win to the away team.

Game Date Winner Prediction
1 Blues vs. Hurricanes Mar 11 Hurricanes -6.20
2 Force vs. Brumbies Mar 11 Brumbies -10.70
3 Highlanders vs. Lions Mar 12 Highlanders 10.40
4 Rebels vs. Reds Mar 12 Rebels 7.90
5 Sunwolves vs. Cheetahs Mar 12 Sunwolves 3.30
6 Kings vs. Chiefs Mar 12 Chiefs -14.10
7 Stormers vs. Sharks Mar 12 Stormers 4.90


NRL Predictions for Round 2

Team Ratings for Round 2

The basic method is described on my Department home page.

Here are the team ratings prior to this week’s games, along with the ratings at the start of the season.

Current Rating Rating at Season Start Difference
Broncos 9.93 9.81 0.10
Cowboys 9.69 10.29 -0.60
Roosters 8.07 11.20 -3.10
Storm 3.97 4.41 -0.40
Bulldogs 3.13 1.50 1.60
Rabbitohs 1.93 -1.20 3.10
Dragons 0.34 -0.10 0.40
Raiders -0.35 -0.55 0.20
Sharks -0.46 -1.06 0.60
Sea Eagles -1.26 0.36 -1.60
Panthers -3.26 -3.06 -0.20
Wests Tigers -4.01 -4.06 0.00
Eels -4.75 -4.62 -0.10
Knights -6.66 -5.41 -1.20
Titans -7.14 -8.39 1.20
Warriors -7.51 -7.47 -0.00


Performance So Far

So far there have been 8 matches played, 6 of which were correctly predicted, a success rate of 75%.
Here are the predictions for last week’s games.

Game Date Score Prediction Correct
1 Eels vs. Broncos Mar 03 4 – 17 -11.40 TRUE
2 Sea Eagles vs. Bulldogs Mar 04 6 – 28 1.90 FALSE
3 Raiders vs. Panthers Mar 05 30 – 22 5.50 TRUE
4 Wests Tigers vs. Warriors Mar 05 34 – 26 7.40 TRUE
5 Cowboys vs. Sharks Mar 05 20 – 14 14.40 TRUE
6 Roosters vs. Rabbitohs Mar 06 10 – 42 15.40 FALSE
7 Titans vs. Knights Mar 06 30 – 12 0.00 TRUE
8 Storm vs. Dragons Mar 07 18 – 16 7.50 TRUE


Predictions for Round 2

Here are the predictions for Round 2. The prediction is my estimated expected points difference with a positive margin being a win to the home team, and a negative margin a win to the away team.

Game Date Winner Prediction
1 Panthers vs. Bulldogs Mar 10 Bulldogs -3.40
2 Broncos vs. Warriors Mar 11 Broncos 21.40
3 Raiders vs. Roosters Mar 12 Roosters -5.40
4 Rabbitohs vs. Knights Mar 12 Rabbitohs 11.60
5 Eels vs. Cowboys Mar 12 Cowboys -11.40
6 Sharks vs. Dragons Mar 13 Sharks 2.20
7 Storm vs. Titans Mar 13 Storm 14.10
8 Wests Tigers vs. Sea Eagles Mar 14 Wests Tigers 0.30


March 8, 2016

A link for the day

My first Listener column, a couple of years ago was on the US gender pay gap and what it does and doesn’t mean. It’s now open-access.

March 7, 2016

A good source of iron

Stuff has a story under the lead

Now that it’s autumn, flu season isn’t far off and there’s plenty you could be doing in the kitchen to give your body that extra oomph for the cold months ahead.

Sadly they don’t mean making a phone call to book a flu vaccine shot: they have a list of herbs and spices with unsupported health claims.

Take the first, cinnamon.  Stuff says “It is high in antioxidants, is an anti-inflammatory and has an effect in lowering blood sugar.”  The  National Center for Complementary and Integrative Health , who are about as sympathetic as you can get to this sort of thing “High-quality clinical evidence (i.e., studies in people) to support the use of cinnamon for any medical condition is generally lacking. An analysis of five clinical trials concluded that cinnamon does not appear to affect factors related to diabetes and heart disease.”

Or, for a total failure to do arithmetic, saffron. Stuff says “It is a good source of vitamins, magnesium and iron.” Now, it’s true that saffron is high in nutrients for its weight. A mere 100g of saffron will supply about two-thirds of your daily iron and magnesium, and substantial amounts of vitamins C and B-6. By weight, it does better than spinach. But the typical serving of saffron is a small fraction of a gram, with nutrient contents that would round to zero in any sensible display.

Following the lines of previous StatsChat food advice, I think the photo caption  just needs a bit of editing: “Herbs and spices are an easy way to add healthy elements  flavour to your diet.

(via Mark Hanna and Bart Janssen)

Briefly

  • From Public Address: An example of unfunded drugs other than Keytruda (pembrolizumab) that might be higher up a priority list
  • Sensible presentation of stats in a Herald story on seatbelts and crashes
  • From Fusion: “How this company tracked 16,000 Iowa caucus-goers via their phones”
  • And finally, two notes on the flag referendum. First, if the current flag doesn’t win, New Zealand will go down in history as the new example of opinion-poll failure, since current polls give it an almost 2-1 lead. Second, in case it turns out to be necessary, a mnemonic for the official number of leaflets on the fern: it’s the number of players on a team for the Silver Ferns (netball, 7), plus the White Ferns (cricket, 11), plus the Black Ferns (rugby union, 15) — a celebration of NZ women’s sports.

Crime reports in NZ

The Herald Insights section has a multi-day exploration of police burglary reports, starting with a map at the Census meshblock level.

burglary

When you have counts of things on a map there’s always an issue of denominators and areas.  There’s the “one cow, one vote” phenomenon where rural areas dominate the map, and also the question of whether to show the raw count, the fraction of the population, or something else.  Burglaries are especially tricky in this context, because the crime location need not be a household, and the perpetrator need not live nearby, so the meshblock population really isn’t the right denominator.  The Herald hasn’t standardised, which I think is a reasonable default.

It’s also an opportunity to link again to Graeme Edgeler’s discussions of  why ‘burglary’ is a wider category than most people realise.

Redesign of a graphic

This graph, from the Wall Street Journal last year, was one of a series showing the impact of vaccination

wsj-polio-dataviz

Randall Olson looks at ways to redesign it to communicate the numbers more effectively.

March 3, 2016

Soft drink doses

From the Herald today

Coca-Cola would prefer to see more people drinking less of its products rather than a few people drinking a lot. So one can a week is quite alright, according to the folks from Coke.

So, how does that compare to current consumption? We don’t know specifically for Coca-Cola, but Stuff gave figures a year ago for fizzy soft drinks

New Zealanders drank just under 73 litres of carbonated drinks each in 2014 – a fraction lower than Australia where the per-capita consumption sat just under 75 litres.

The figure excludes sports drinks, tea and coffee, and other soft drinks, and 73 litres a year breaks down to nearly four cans a week, and that’s averaged over the whole population. Averaged over just those who drink carbonated soft drinks it’s obviously going to be more.

Coca-Cola Amatil would probably be happy if people who don’t currently drink Coke started drinking a can a week, or if people switched to Coke from L&P, Fanta, or Six Barrel Soda Celery Tonic, but if everyone who drinks fizzy soft drinks regularly were to cut down to one can a week, the market would shrink a lot.