Posts from March 2016 (44)

March 16, 2016

NRL Predictions for Round 3

Team Ratings for Round 3

The basic method is described on my Department home page.

Here are the team ratings prior to this week’s games, along with the ratings at the start of the season.

Current Rating Rating at Season Start Difference
Broncos 9.46 9.81 -0.30
Cowboys 8.62 10.29 -1.70
Roosters 7.61 11.20 -3.60
Storm 4.28 4.41 -0.10
Rabbitohs 3.98 -1.20 5.20
Bulldogs 3.02 1.50 1.50
Sharks 1.30 -1.06 2.40
Raiders 0.12 -0.55 0.70
Dragons -1.41 -0.10 -1.30
Sea Eagles -2.23 0.36 -2.60
Wests Tigers -3.05 -4.06 1.00
Panthers -3.15 -3.06 -0.10
Eels -3.67 -4.62 1.00
Warriors -7.04 -7.47 0.40
Titans -7.45 -8.39 0.90
Knights -8.71 -5.41 -3.30


Performance So Far

So far there have been 16 matches played, 12 of which were correctly predicted, a success rate of 75%.
Here are the predictions for last week’s games.

Game Date Score Prediction Correct
1 Panthers vs. Bulldogs Mar 10 16 – 18 -3.40 TRUE
2 Broncos vs. Warriors Mar 11 25 – 10 21.40 TRUE
3 Raiders vs. Roosters Mar 12 21 – 20 -5.40 FALSE
4 Rabbitohs vs. Knights Mar 12 48 – 6 11.60 TRUE
5 Eels vs. Cowboys Mar 12 20 – 16 -11.40 FALSE
6 Sharks vs. Dragons Mar 13 30 – 2 2.20 TRUE
7 Storm vs. Titans Mar 13 34 – 16 14.10 TRUE
8 Wests Tigers vs. Sea Eagles Mar 14 36 – 22 0.30 TRUE


Predictions for Round 3

Here are the predictions for Round 3. The prediction is my estimated expected points difference with a positive margin being a win to the home team, and a negative margin a win to the away team.

Game Date Winner Prediction
1 Cowboys vs. Roosters Mar 17 Cowboys 4.00
2 Bulldogs vs. Eels Mar 18 Bulldogs 9.70
3 Knights vs. Raiders Mar 19 Raiders -5.80
4 Panthers vs. Broncos Mar 19 Broncos -9.60
5 Titans vs. Wests Tigers Mar 19 Wests Tigers -1.40
6 Warriors vs. Storm Mar 20 Storm -7.30
7 Dragons vs. Rabbitohs Mar 20 Rabbitohs -2.40
8 Sea Eagles vs. Sharks Mar 21 Sharks -0.50


March 15, 2016

Joseph Pulitzer on statistics in journalism

From the North American Review, May 1904, writing about the proposed School of Journalism at Columbia University.

Everybody says that statistics should be taught. But how ?

Statistics are not simply figures. It is said that nothing lies  like figures except facts. You want statistics to tell you the truth. You can find truth there if you know how to get at it, and  romance, human interest, humor and fascinating revelations as well. The journalist must know how to find all these things truth, of course, first. His figures must bear examination. It is much better to understate than to overstate his case, so that his critics and not himself may be put to confusion when they challenge him to verify his comparisons.

He must not read his statistics blindly; he must be able to test them by knowledge and by common sense. He must always be
on the alert to discover how far they can actually be trusted and what they really mean. The analysis of statistics to get at the essential truth of them has become a well-developed science whose principles are systematically taught. And what a fascinating science it is!

via Amelia McNamara and Mark Hansen.

Briefly

  • The Ombudsman has released guidelines on Official Information Act requests through social media (PDF). Summary: it’s still a question, so it still gets answered.
  • From NiemanLabs, how some news publishers are doing interactive graphics for mobile devices

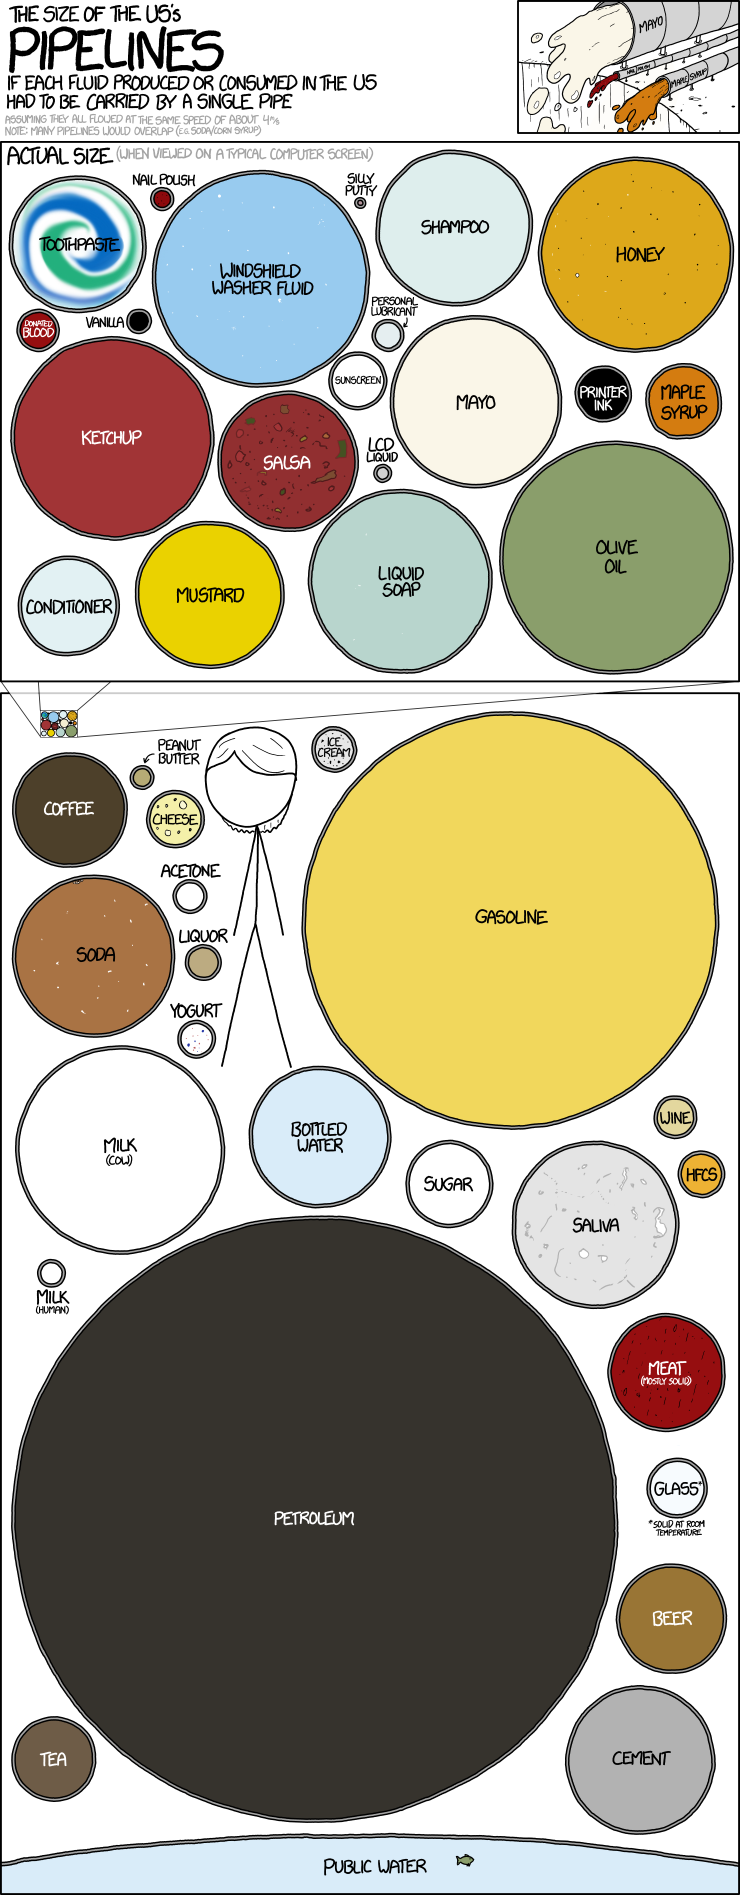
And from XKCD: how much of various fluids does the US consume, using pipeline diameters to illustrate

pipelines

(Update: Yes, I realise this is the sort of bubble plot we usually say mean things about. Not the point, here).

March 14, 2016

Dementia and rugby

Dylan Cleaver has a feature story in the Herald on the Taranaki rugby team who won the Ranfurly Shield in 1964. Five of the 22 have been diagnosed with dementia. Early on in the process he asked me to comment on how surprising that was.

The key fact here is 1964: the five developed dementia fairly young, in their 60s and early 70s. That happens even in people who have no family history and no occupational risks, as I know personally, but it’s unusual.

I couldn’t find NZ data, but I did find a Dutch study (PDF, Table 3) estimating that a man who is alive and healthy at 55 has a 1.5% risk of diagnosed dementia by 70 and 3.2% by 75. There’s broadly similar data from the Framingham study in the US.   The chance of getting 5 or more out of 22 depends on exact ages and on how many died earlier of other causes, but if these were just 22 men chosen at random the chance would be less than 1 in 10,000 — probably much less.  People who know about rugby tell me the fact they were all in the back line is also relevant, and that makes the chance much smaller.

There are still at least two explanations. The first, obviously, is that rugby — at least as played in those days — caused similar cumulative brain damage to that seen in American football players. The second, though, is that we’re hearing about the 1964 Taranaki team partly because of the dementia cases — there wouldn’t have been this story if there had only been two cases, and there might have been a story about some other team instead. That is, it could be a combination of a tragic fluke and the natural human tendency to see patterns.  Statistics is bad at disentangling these; the issue crops up over and over again in cancer surveillance.

In the light of what has been seen in the US, I’d say it’s plausible that concussions contributed to the Taranaki cases.  There have already been changes to the game to reduce repeated concussions, which should reduce the risk in the future. There is also a case for more systematic evaluation of former players, to get a more reliable estimate of the risk, though the fact there’s nothing that can currently be done about it means that players and family members need to be involved in that decision.

Stat of the Week Competition: March 12 – 18 2016

Each week, we would like to invite readers of Stats Chat to submit nominations for our Stat of the Week competition and be in with the chance to win an iTunes voucher.

Here’s how it works:

  • Anyone may add a comment on this post to nominate their Stat of the Week candidate before midday Friday March 18 2016.
  • Statistics can be bad, exemplary or fascinating.
  • The statistic must be in the NZ media during the period of March 12 – 18 2016 inclusive.
  • Quote the statistic, when and where it was published and tell us why it should be our Stat of the Week.

Next Monday at midday we’ll announce the winner of this week’s Stat of the Week competition, and start a new one.

(more…)

Stat of the Week Competition Discussion: March 12 – 18 2016

If you’d like to comment on or debate any of this week’s Stat of the Week nominations, please do so below!

March 11, 2016

Getting to see opinion poll uncertainty

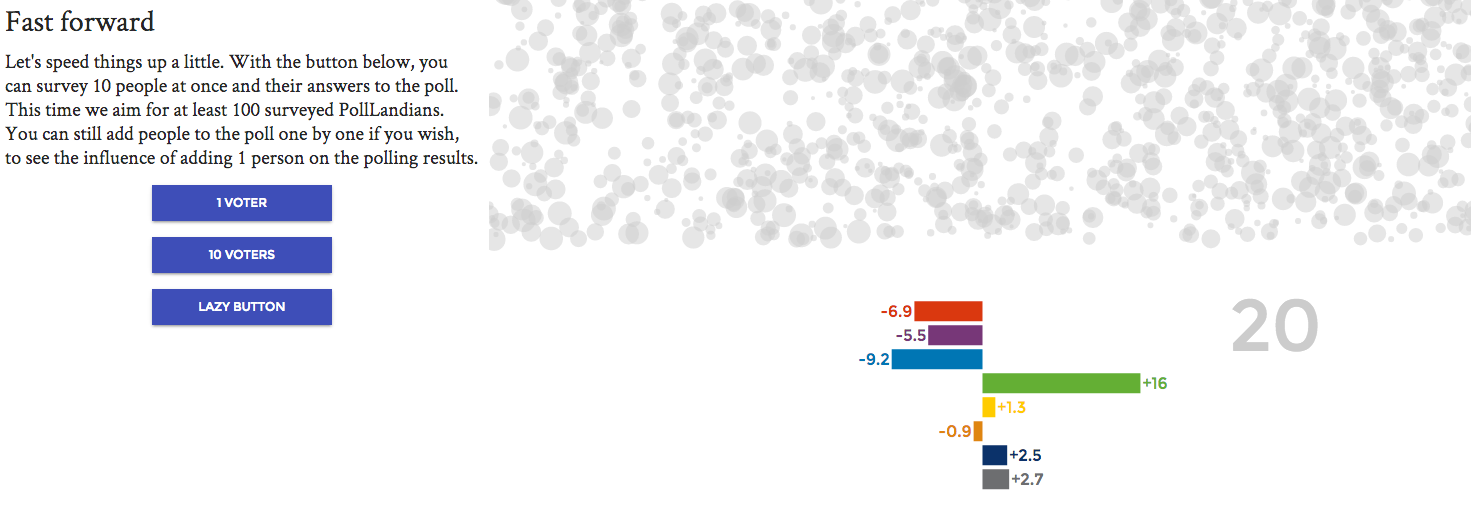
Rock’n Poll has a lovely guide to sampling uncertainty in election polls, guiding you step by step to see how approximate the results would be in the best of all possible worlds. Highly recommended.

Of course, we’re not in the best of all possible worlds, and in addition to pure sampling uncertainty we have ‘house effects’ due to different methodology between polling firms and ‘design effects’ due to the way the surveys compensate for non-response.  And on top of that there are problems with the hypothetical question ‘if an election were held tomorrow’, and probably issues with people not wanting to be honest.

Even so, the basic sampling uncertainty gives a good guide to the error in opinion polls, and anything that makes it easier to understand is worth having.

poll-land

(via Harkanwal Singh)

Cancer screening

Usually when there are complaints about cancer screening in New Zealand it’s people complaining there isn’t enough.  The Herald has an interesting example of the opposite, under the headline, “Cervical test switch ‘wrong’“.  The ‘switch’ is from looking for actual abnormal cells on screening to just looking for high-risk strains of the virus HPV, which are responsible for nearly all cervical cancer.

Everyone agrees that viral testing is important, and that, all things being equal it is more sensitive.  The specialists who are complaining say that the initial screen should look for abnormal cells as well, and only proceed further if they are found. The problem with screening based just on the virus is that it will lead to a bigger increase in repeat screening, biopsy, and treatment, with added inconvenience, risk and expense.

Also, as they say in the NZ Medical Journal

The detection of a sexually transmitted infection rather than a significant cytological abnormality is a major change in the aim of screening. This may reduce screening participation. Any reduction in screening coverage will reduce protection from cervical cancer.

I’m not an expert on cervical screening, so I don’t know the answers, but the issues being raised are the right sort of questions to ask about a change in a successful population screening program.

March 10, 2016

The silent majority

Some headlines:

Herald: “Dead people on Facebook could outnumber the living

Stuff: “There will be more dead people than living on Facebook

But not any time soon:

Daily Mail: “Facebook will become the world’s biggest virtual graveyard with more profiles of dead people than living users by the end of the century, say experts

So who are these experts? They are a statistician, Hachem Saddiki. The original idea came from Fusion, where Kristen V. Brown raised the question of when declining growth and lack of automatic deletion after death would lead to a majority of dead accounts, and looked for someone to work it out.

The Fusion story talks about some of the uncertainties — how fast will Facebook grow, what will happen to death rates across the world.  It doesn’t consider death rates of companies and technologies, though.

A 2012 report said

According to the report, the 61-year tenure for the average firm in 1958 narrowed to 25 years in 1980—to 18 years in 2011. At the current churn rate, 75% of the S&P 500 will be replaced by 2027.

You might expect Facebook to last longer than average, but there must be some chance it doesn’t make it to four times the average.

Much more importantly, will Facebook survive the technology transitions in anything like its current form — the equivalent of moving from player piano to Spotify in the music world?

Mark Twain noted in Life on the Mississippi

“In the space of one hundred and seventy six years the Lower Mississippi has shortened itself two hundred and forty-two miles. That is an average of a trifle over a mile and a third per year.”

His conclusion might well apply to the Facebook prediction: “One gets such wholesale returns of conjecture out of such a trifling investment of fact.”

Briefly

  • “Uber officials suggested that if an email address or rider/driver last name contains the word “rape” like “Jason Rape” or “Don Draper” it will be included when queried. … misspellings of the word “rate” and expressions like “you raped my wallet” accounted for false positives in the search results seen in the obtained screenshots.” So maybe we have a return of the ‘Scunthorpe’ problem, but maybe that’s as bogus an explanation as it sounds. From Buzzfeed.
  • In Stuff’s list of the 17 most dangerous foods, the entry on the Jamaican vegetable ‘ackee’ says “In 2011 there were 35 poisoning cases” and also “1 in 1000 people develop ackee fruit poisoning each year in the Caribbean”.  This fails simple arithmetic: there are more than 35000 people in the Caribbean. A 1991 analysis by the CDC found a rate of 1 in 100,000 restricted to Jamaica, which seems much more plausible.  The list is also wrong about absinthe, and is unusual in considering rhubarb leaves to be a food.
  • A visualisation of the ages people get married (in the US), from Flowing Data
  • “If Bernie Sanders were to defeat Hillary Clinton in Michigan’s Democratic primary, it would be “among the greatest polling errors in primary history,”” He did. It was. Fivethirtyeight.com tries to explain how.